Home > Comparison > Consumer Defensive > GIS vs MKC
The strategic rivalry between General Mills, Inc. and McCormick & Company, Incorporated shapes the packaged foods sector’s competitive landscape. General Mills operates as a diversified consumer foods giant with broad retail and foodservice channels. McCormick focuses on high-margin spices and flavor solutions with global consumer and industrial reach. This analysis pits scale against specialization to identify which trajectory offers superior risk-adjusted returns for a diversified portfolio in 2026.
Table of contents
Companies Overview
General Mills and McCormick anchor the packaged foods sector with strong brand portfolios and global reach.
General Mills, Inc.: Global Packaged Foods Leader
General Mills dominates as a global consumer foods manufacturer with a diverse product range. Its core revenue comes from branded foods across five segments, including cereals, snacks, pet food, and frozen products. In 2026, the company focuses on expanding its organic offerings and digital distribution channels to capture evolving consumer preferences.
McCormick & Company, Incorporated: Flavor Innovator
McCormick leads the spices and seasoning market with a dual-segment model: Consumer and Flavor Solutions. It generates revenue by selling branded spices, sauces, and flavor blends worldwide. The company emphasizes innovation in flavor solutions and expanding its global footprint, especially in emerging markets, to drive growth in 2026.
Strategic Collision: Similarities & Divergences
General Mills pursues a broad portfolio strategy, while McCormick specializes in flavor-centric products. Both compete fiercely in packaged foods but with distinct approaches: General Mills focuses on brand diversity, McCormick on flavor innovation. Investors face contrasting profiles—General Mills offers scale and stability, McCormick offers niche leadership with higher growth potential.
Income Statement Comparison
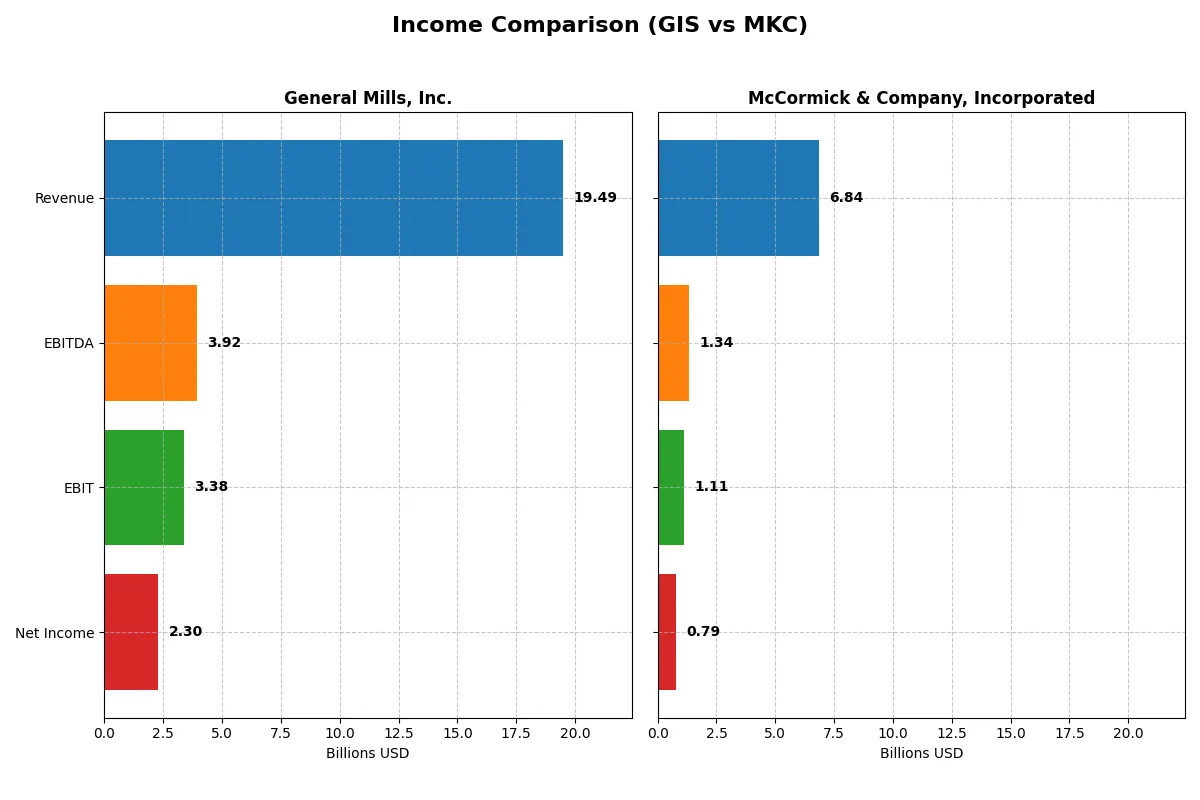
This data dissects the core profitability and scalability of both corporate engines to reveal who dominates the bottom line:
| Metric | General Mills, Inc. (GIS) | McCormick & Company, Incorporated (MKC) |
|---|---|---|
| Revenue | 19.5B | 6.8B |
| Cost of Revenue | 12.8B | 4.2B |
| Operating Expenses | 3.4B | 1.5B |
| Gross Profit | 6.7B | 2.6B |
| EBITDA | 3.9B | 1.3B |
| EBIT | 3.4B | 1.1B |
| Interest Expense | 549M | 196M |
| Net Income | 2.3B | 789M |
| EPS | 4.12 | 2.94 |
| Fiscal Year | 2025 | 2025 |
Income Statement Analysis: The Bottom-Line Duel
This income statement comparison exposes which company manages its revenue and costs most efficiently to deliver shareholder value.
General Mills, Inc. Analysis
General Mills’ revenue slightly declined to $19.5B in 2025 from $19.9B in 2024, with net income falling to $2.3B. Its gross margin stands at a solid 34.55%, but net margin contracted to 11.78%, reflecting margin pressure. Despite a dip in top-line and earnings growth, it maintains favorable operating expense control, hinting at cautious efficiency.
McCormick & Company, Incorporated Analysis
McCormick’s revenue rose modestly to $6.8B in 2025 from $6.7B in 2024, with net income edging up to $789M. It boasts a higher gross margin at 37.9%, while net margin remains healthy at 11.54%. The company shows steady operational momentum and controlled expenses, supporting a favorable overall income statement trend and EPS growth.
Margin Strength vs. Growth Stability
McCormick exhibits superior margin efficiency and steady revenue growth, while General Mills faces pressure on margins and income declines. Based on the latest fiscal data, McCormick’s profile shows more consistent profitability and operational discipline. Investors favor firms that combine margin robustness with sustainable growth, making McCormick’s income statement more attractive.
Financial Ratios Comparison
These vital ratios act as a diagnostic tool to expose the underlying fiscal health, valuation premiums, and capital efficiency of companies:
| Ratios | General Mills, Inc. (GIS) | McCormick & Company, Inc. (MKC) |
|---|---|---|
| ROE | 24.95% | 13.76% |
| ROIC | 9.62% | 7.93% |
| P/E | 12.90 | 22.59 |
| P/B | 3.22 | 3.11 |
| Current Ratio | 0.67 | 0.70 |
| Quick Ratio | 0.43 | 0.28 |
| D/E (Debt-to-Equity) | 1.66 | 0.70 |
| Debt-to-Assets | 46.3% | 30.3% |
| Interest Coverage | 6.02 | 5.57 |
| Asset Turnover | 0.59 | 0.52 |
| Fixed Asset Turnover | 4.83 | 4.72 |
| Payout Ratio | 58.3% | 61.2% |
| Dividend Yield | 4.52% | 2.71% |
| Fiscal Year | 2025 | 2025 |
Efficiency & Valuation Duel: The Vital Signs
Financial ratios serve as a company’s DNA, exposing hidden risks and operational strengths that shape investment decisions.
General Mills, Inc.
General Mills boasts a strong 24.95% ROE and an 11.78% net margin, signaling solid profitability. Its P/E of 12.9 suggests a fairly valued stock, while a high dividend yield of 4.52% rewards shareholders. However, a low current ratio of 0.67 and elevated debt levels raise liquidity concerns, despite overall operational efficiency.
McCormick & Company, Incorporated
McCormick shows a moderate 13.76% ROE with an 11.54% net margin, reflecting decent profitability. The stock trades at a higher P/E of 22.59, indicating a stretched valuation. Its lower dividend yield of 2.71% contrasts with a healthier debt-to-equity ratio of 0.7, yet liquidity ratios remain weak, suggesting cautious financial management.
Valuation Discipline vs. Profitability Resilience
General Mills offers a more attractive risk-reward profile with superior profitability and a compelling dividend, albeit with liquidity risks. McCormick carries a premium valuation and moderate returns, fitting investors prioritizing growth over income. The choice depends on an investor’s tolerance for valuation stretch versus dividend reliability.
Which one offers the Superior Shareholder Reward?
General Mills (GIS) delivers a superior shareholder reward in 2026. It offers a robust 4.5% dividend yield with a payout ratio of 58%, well-covered by free cash flow at 79%. Its share buyback program further boosts total returns, reflecting a balanced distribution strategy. McCormick (MKC) yields a lower 2.7%, with a higher 61% payout ratio and weaker free cash flow coverage near 77%. MKC’s buybacks are less intense relative to GIS. I see GIS’s model as more sustainable and rewarding, combining steady dividends and aggressive buybacks for long-term value.
Comparative Score Analysis: The Strategic Profile
The radar chart reveals the fundamental DNA and trade-offs of General Mills, Inc. and McCormick & Company, Incorporated:
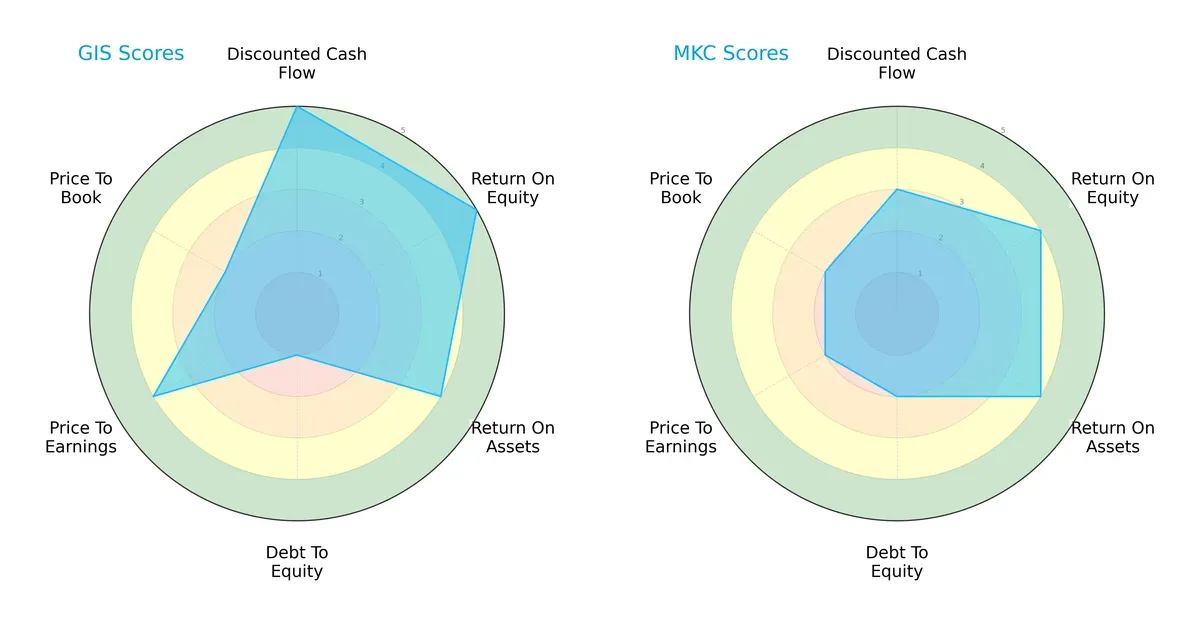
General Mills leads with a stronger DCF (5 vs. 3) and ROE (5 vs. 4), showcasing superior cash flow valuation and shareholder returns. McCormick matches closely in ROA (4 vs. 4) and has a slightly better debt-to-equity score (2 vs. 1), signaling better financial risk management. Valuation metrics favor General Mills on P/E (4 vs. 2), but both tie on P/B (2 each). Overall, General Mills presents a more balanced, high-efficiency profile, while McCormick relies on moderate financial stability and operational efficiency.
Bankruptcy Risk: Solvency Showdown
The Altman Z-Scores put both firms in the grey zone, with McCormick slightly ahead at 2.49 versus General Mills at 2.36:
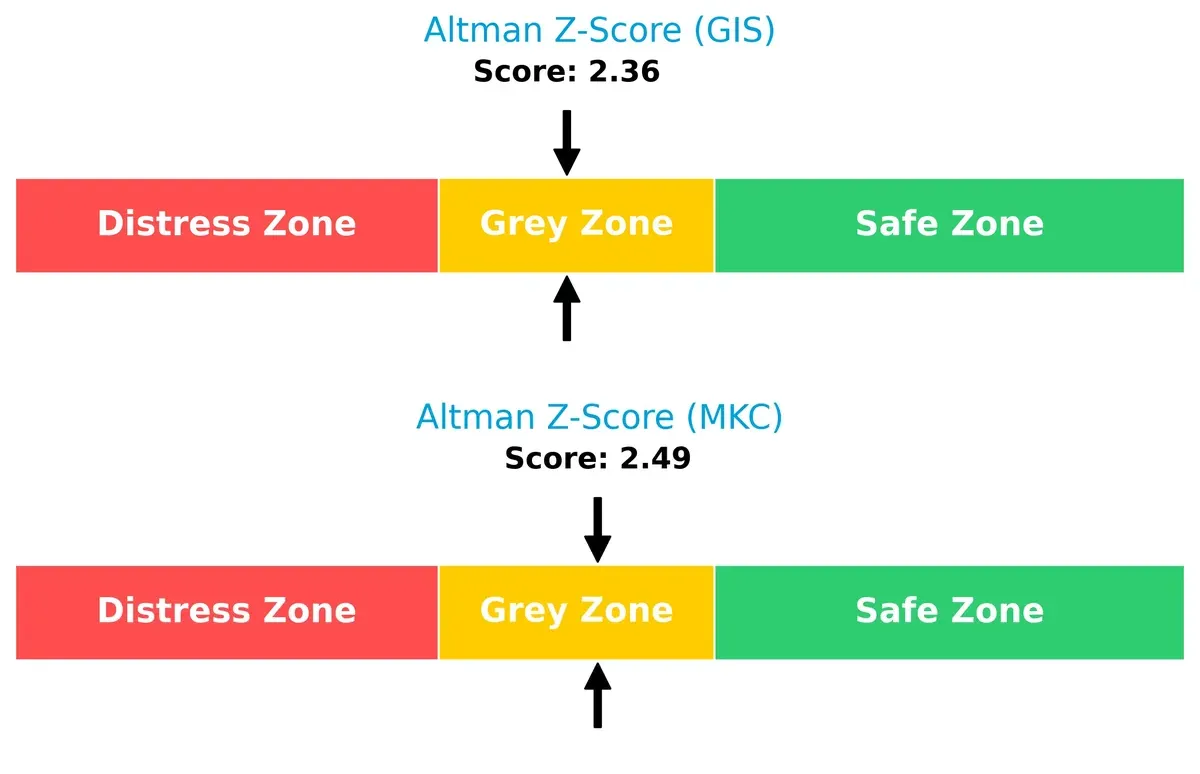
Both companies face moderate bankruptcy risk in this cycle. McCormick’s marginally higher score suggests a slightly stronger long-term solvency outlook, but neither is firmly in the safe zone, urging cautious monitoring.
Financial Health: Quality of Operations
General Mills and McCormick share identical Piotroski F-Scores of 6, indicating average financial health:
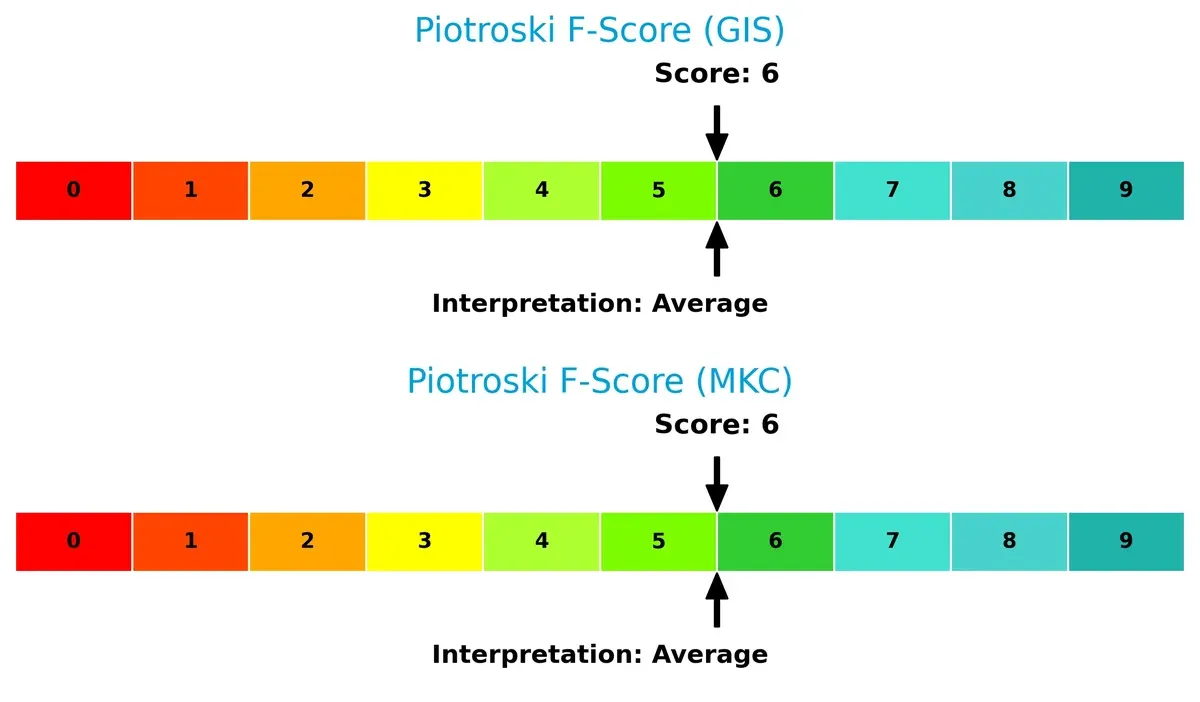
Both firms show solid, though not peak, operational and financial quality. No glaring red flags appear, but neither demonstrates the very strong internal metrics (8-9 range) that would signal optimal financial strength. Investors should weigh this average quality against sector benchmarks.
How are the two companies positioned?
This section dissects the operational DNA of General Mills and McCormick by comparing their revenue distribution and internal strengths and weaknesses. The goal is to confront their economic moats and identify the more resilient, sustainable competitive advantage in today’s market.
Revenue Segmentation: The Strategic Mix
This visual comparison dissects how General Mills and McCormick diversify their income streams and where their primary sector bets lie:
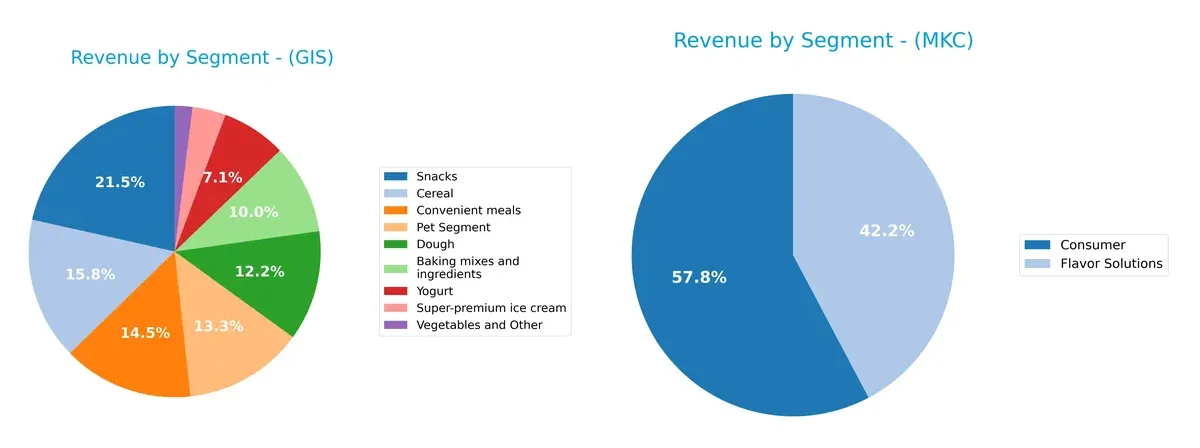
General Mills features a broad portfolio, with Snacks leading at $4.19B, but significant contributions also come from Cereal ($3.08B) and Pet Segment ($2.59B). McCormick pivots around two main segments: Consumer at $3.95B and Flavor Solutions at $2.89B, showing less diversification. General Mills’ varied mix reduces concentration risk, while McCormick’s dual focus suggests strong market specialization but greater exposure to segment-specific pressures.
Strengths and Weaknesses Comparison
This table compares the Strengths and Weaknesses of General Mills, Inc. and McCormick & Company, Incorporated:
General Mills Strengths
- Diversified product portfolio with multiple segments
- Strong profitability with 11.78% net margin and 24.95% ROE
- Favorable WACC at 4.1% supports capital efficiency
- High dividend yield of 4.52% attracts income investors
- Global presence with $3.7B revenue outside the US
McCormick Strengths
- Consistent revenue growth in Consumer and Flavor Solutions segments
- Favorable net margin at 11.54% and WACC at 6.17%
- Solid interest coverage ratio of 5.65 supports debt service
- Global reach across Americas, Asia Pacific, and EMEA regions
- Favorable fixed asset turnover at 4.72 indicates efficient asset use
General Mills Weaknesses
- Low current ratio (0.67) and quick ratio (0.43) indicate liquidity concerns
- High debt-to-equity ratio of 1.66 raises leverage risk
- Unfavorable P/B ratio at 3.22 suggests potential overvaluation
- Neutral ROIC (9.62%) close to WACC reduces economic profit
- Moderate asset turnover at 0.59 may limit operational efficiency
McCormick Weaknesses
- Low quick ratio (0.28) signals liquidity risk
- Neutral ROE at 13.76% below sector leaders
- Higher P/E ratio of 22.59 may reflect elevated valuation
- Debt-to-equity at 0.7 is moderate but requires monitoring
- Larger neutral ratio share in global ratios suggests mixed financial health
General Mills shows strength in diversified products, strong profitability, and attractive dividends but faces liquidity and leverage risks. McCormick benefits from consistent segment growth and global reach but must address liquidity and valuation challenges to enhance financial resilience.
The Moat Duel: Analyzing Competitive Defensibility
A structural moat is the only reliable shield protecting long-term profits from relentless competition erosion. Let’s dissect how these firms defend their turf:
General Mills, Inc.: Brand Power and Scale Economies
General Mills rides a strong brand portfolio and scale advantages, reflected in a 5.5% ROIC premium over WACC and stable 17% EBIT margins. New product innovation and international expansion could deepen this moat in 2026.
McCormick & Company, Incorporated: Innovation-Driven Niche Moat
McCormick leverages flavor innovation and premium positioning, yet its ROIC only slightly exceeds WACC by 1.8%, signaling weaker value creation than General Mills. Still, its growing ROIC trend and global flavor solutions hint at future moat strengthening.
Wide Scale Brand vs. Innovation Niche: The Moat Face-Off
General Mills boasts a wider, more durable moat with strong value creation and margin stability. McCormick shows promise but remains slightly below the moat threshold. General Mills is better positioned to defend market share amid intensifying competition.
Which stock offers better returns?
The past year shows distinct bearish trends for both stocks, with General Mills exhibiting sharper losses and increased volatility compared to McCormick’s more moderate decline and decelerating downtrend.
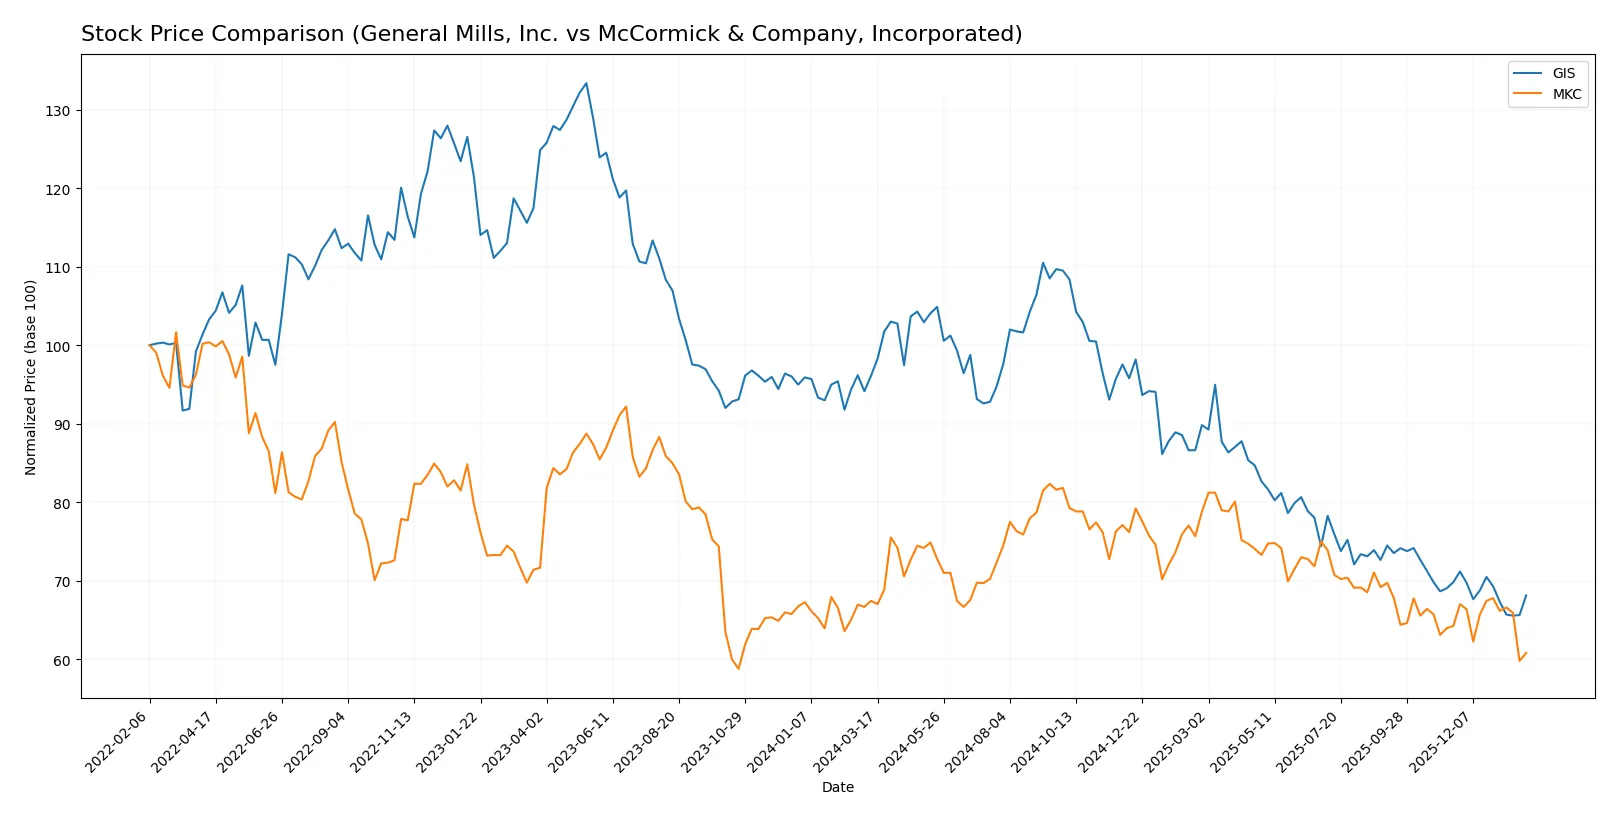
Trend Comparison
General Mills, Inc. (GIS) experienced a 29.11% price decline over the last 12 months, marking an accelerating bearish trend with a high volatility of 9.02 and prices ranging between 75.06 and 44.51. McCormick & Company, Inc. (MKC) posted a 9.84% loss over the same period, showing a decelerating bearish trend with lower volatility at 5.29 and a price range of 83.76 to 60.79. GIS’s steeper decline and higher volatility contrast with MKC’s more tempered losses, making McCormick the better-performing stock in market terms over the past year.
Target Prices
Analysts project solid upside for General Mills and McCormick, reflecting confidence in their sector positioning.
| Company | Target Low | Target High | Consensus |
|---|---|---|---|
| General Mills, Inc. | 47 | 63 | 52.2 |
| McCormick & Company, Incorporated | 67 | 85 | 73.57 |
General Mills trades below its $52.2 consensus, suggesting potential upside from current $46.26. McCormick’s $73.57 consensus significantly exceeds its $61.83 price, indicating strong analyst conviction.

Don’t Let Luck Decide Your Entry Point
Optimize your entry points with our advanced ProRealTime indicators. You’ll get efficient buy signals with precise price targets for maximum performance. Start outperforming now!
How do institutions grade them?
Here is a comparison of the latest institutional grades for General Mills, Inc. and McCormick & Company, Incorporated:
General Mills, Inc. Grades
The following table shows recent grades assigned by reputable financial institutions for General Mills:
| Grading Company | Action | New Grade | Date |
|---|---|---|---|
| Wells Fargo | Maintain | Equal Weight | 2026-01-05 |
| Morgan Stanley | Maintain | Underweight | 2025-12-22 |
| Wells Fargo | Maintain | Equal Weight | 2025-12-18 |
| Bernstein | Maintain | Market Perform | 2025-12-18 |
| TD Cowen | Maintain | Hold | 2025-12-18 |
| TD Cowen | Maintain | Hold | 2025-12-15 |
| Wells Fargo | Maintain | Equal Weight | 2025-12-12 |
| Jefferies | Maintain | Hold | 2025-12-11 |
| Stifel | Maintain | Buy | 2025-12-11 |
| Mizuho | Maintain | Neutral | 2025-09-19 |
McCormick & Company, Incorporated Grades
Below are recent institutional grades for McCormick & Company from well-known analysts:
| Grading Company | Action | New Grade | Date |
|---|---|---|---|
| Barclays | Maintain | Equal Weight | 2026-01-26 |
| UBS | Maintain | Neutral | 2026-01-23 |
| Stifel | Maintain | Hold | 2026-01-23 |
| Barclays | Maintain | Equal Weight | 2025-10-08 |
| Jefferies | Maintain | Buy | 2025-10-08 |
| Deutsche Bank | Maintain | Hold | 2025-10-08 |
| Stifel | Maintain | Hold | 2025-10-08 |
| UBS | Maintain | Neutral | 2025-10-08 |
| Bernstein | Maintain | Outperform | 2025-10-08 |
| UBS | Maintain | Neutral | 2025-10-01 |
Which company has the best grades?
McCormick generally receives higher ratings, including Bernstein’s “Outperform” and Jefferies’ “Buy.” General Mills’ grades cluster around “Hold” and “Equal Weight.” Investors may view McCormick’s stronger grades as a signal of better growth or stability potential.
Risks specific to each company
In 2026, both firms face critical pressure points and systemic threats shaped by the evolving market, regulatory landscape, and operational realities. These risk categories identify their most significant challenges:
1. Market & Competition
General Mills, Inc.
- Faces intense competition in packaged foods with broad product portfolio but operates in a mature market limiting growth.
McCormick & Company, Incorporated
- Competes in spices and condiments with strong brands but faces pricing pressure and innovation demands in diverse markets.
2. Capital Structure & Debt
General Mills, Inc.
- High debt-to-equity ratio (1.66) signals leverage risk despite solid interest coverage (6.16x).
McCormick & Company, Incorporated
- Moderate leverage (debt-to-equity 0.7) reflects balanced capital structure with strong interest coverage (5.65x).
3. Stock Volatility
General Mills, Inc.
- Negative beta (-0.068) suggests stock moves inversely to market, potentially a defensive play but limits upside.
McCormick & Company, Incorporated
- Beta of 0.617 shows moderate correlation to market swings, implying higher volatility and growth potential.
4. Regulatory & Legal
General Mills, Inc.
- Subject to food safety regulations worldwide; litigation risks tied to product recalls remain material.
McCormick & Company, Incorporated
- Faces stringent food and labeling regulations across global markets, with added complexity in flavor solutions segment.
5. Supply Chain & Operations
General Mills, Inc.
- Complex global supply chain with exposure to raw material price inflation and logistical disruptions.
McCormick & Company, Incorporated
- Relies on sourcing diverse spices globally, vulnerable to agricultural supply shocks and geopolitical trade barriers.
6. ESG & Climate Transition
General Mills, Inc.
- Increasing pressure to reduce carbon footprint and ensure sustainable sourcing amid rising consumer ESG expectations.
McCormick & Company, Incorporated
- Faces ESG challenges in sustainable farming and climate impact on raw material availability; active in transition initiatives.
7. Geopolitical Exposure
General Mills, Inc.
- Exposure to North America, Europe, Asia, Latin America; political instability and tariffs pose risks.
McCormick & Company, Incorporated
- Operates in Americas, EMEA, and Asia; geopolitical tensions and trade policies could impact supply and sales.
Which company shows a better risk-adjusted profile?
General Mills faces significant leverage risk with its high debt-to-equity ratio, despite stable interest coverage and defensive stock volatility. McCormick has a more balanced capital structure and moderate market sensitivity but contends with complex global sourcing risks. The most impactful risk for General Mills is its elevated financial leverage, which could strain flexibility in a volatile economic cycle. For McCormick, supply chain vulnerabilities due to geopolitical and agricultural dependencies stand out. Overall, McCormick presents a better risk-adjusted profile, supported by lower leverage and a more favorable balance between market exposure and operational risk. Recent data highlight General Mills’ debt-to-equity ratio at 1.66 as a red flag, demanding cautious monitoring.
Final Verdict: Which stock to choose?
General Mills, Inc. (GIS) stands out as a cash-generating powerhouse with a durable competitive advantage, supported by its strong ROIC exceeding WACC. Its point of vigilance lies in its elevated leverage and weak liquidity ratios, which could pressure its financial flexibility. GIS fits well in an Aggressive Growth portfolio seeking value creation through operational efficiency.
McCormick & Company, Inc. (MKC) boasts a strategic moat rooted in brand loyalty and pricing power within the spices and flavorings niche. While its profitability margins are slightly lower than GIS, MKC offers a comparatively safer balance sheet with moderate leverage and stable income growth. It suits a GARP (Growth at a Reasonable Price) portfolio focusing on steady expansion and risk management.
If you prioritize robust value creation with aggressive capital deployment, GIS is the compelling choice due to its superior economic moat and high returns on invested capital. However, if you seek better stability and moderate growth with a safer financial profile, MKC offers a more prudent option despite commanding a premium valuation. Each scenario aligns with distinct investor risk tolerances and growth expectations.
Disclaimer: Investment carries a risk of loss of initial capital. The past performance is not a reliable indicator of future results. Be sure to understand risks before making an investment decision.
Go Further
I encourage you to read the complete analyses of General Mills, Inc. and McCormick & Company, Incorporated to enhance your investment decisions: