In the competitive world of packaged foods, General Mills, Inc. (GIS) and Lamb Weston Holdings, Inc. (LW) stand out as key players with overlapping market presence and distinctive innovation strategies. General Mills offers a diverse portfolio spanning cereals to pet food, while Lamb Weston specializes in frozen potato products with strong retail and foodservice channels. This comparison will guide you in identifying which company holds the most promise for your investment portfolio.
Table of contents
Companies Overview
I will begin the comparison between General Mills and Lamb Weston by providing an overview of these two companies and their main differences.
General Mills Overview
General Mills, Inc. is a well-established player in the packaged foods industry, manufacturing and marketing a wide range of branded consumer foods globally. Its product portfolio includes ready-to-eat cereals, snacks, frozen foods, pet food, and organic products. The company operates across multiple segments including North America Retail and Pet, serving various retail and foodservice channels from its Minneapolis headquarters.
Lamb Weston Overview
Lamb Weston Holdings, Inc. specializes in value-added frozen potato products and operates through four segments: Global, Foodservice, Retail, and Other. The company markets products under its own brands as well as licensed and retailer brands, serving customers worldwide. Headquartered in Eagle, Idaho, Lamb Weston focuses on frozen potatoes, appetizers, and commercial ingredients for retail and foodservice markets.
Key similarities and differences
Both companies operate in the packaged foods sector, targeting retail and foodservice customers globally. General Mills offers a broader product range, including cereals, snacks, and pet food, while Lamb Weston concentrates on frozen potato products and related items. General Mills has a larger workforce and market capitalization, reflecting its more diversified portfolio and longer market presence compared to Lamb Weston’s specialized focus.
Income Statement Comparison
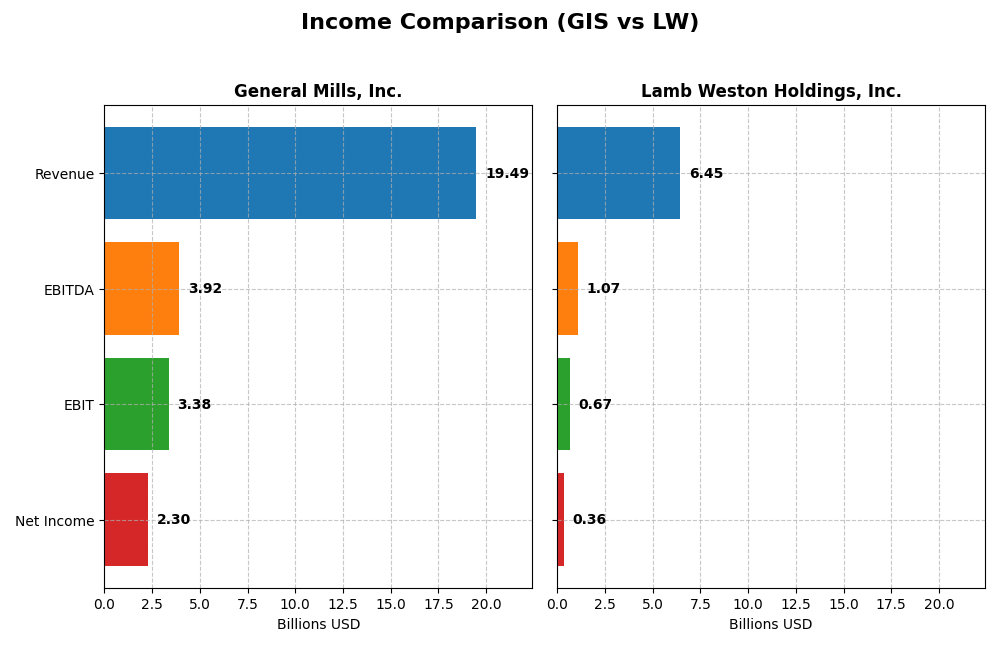
The table below presents a side-by-side comparison of key income statement metrics for General Mills, Inc. and Lamb Weston Holdings, Inc. for the fiscal year 2025.
| Metric | General Mills, Inc. (GIS) | Lamb Weston Holdings, Inc. (LW) |
|---|---|---|
| Market Cap | 23.7B | 5.8B |
| Revenue | 19.5B | 6.5B |
| EBITDA | 3.9B | 1.1B |
| EBIT | 3.4B | 665M |
| Net Income | 2.3B | 357M |
| EPS | 4.12 | 2.51 |
| Fiscal Year | 2025 | 2025 |
Income Statement Interpretations
General Mills, Inc.
General Mills showed modest revenue growth of 7.5% over 2021-2025 but experienced a 1.87% revenue decline in 2025. Net income decreased overall by 1.91%, with net margin shrinking by 8.75%. Despite these declines, gross margin remained favorable at 34.55% in 2025. The latest year exhibited weaker growth and margin compression, reflecting some operational challenges.
Lamb Weston Holdings, Inc.
Lamb Weston’s revenue surged 75.74% over the period but slightly declined by 0.25% in 2025. Net income grew 12.4% overall but halved in net margin in the last year, dropping to 5.54%. EBIT margin stayed positive at 10.31%. The recent year’s performance showed sharp decreases in profitability metrics and earnings per share, signaling margin pressure despite strong longer-term growth.
Which one has the stronger fundamentals?
General Mills maintains stronger profitability margins (gross 34.55%, net 11.78%) with a stable interest expense ratio, though recent revenue and income trends are negative. Lamb Weston demonstrates robust revenue and net income growth overall but suffers from significant margin contraction recently. Both companies face short-term headwinds, making fundamental strength dependent on margin resilience versus growth dynamics.
Financial Ratios Comparison
This table presents the most recent fiscal year key financial ratios for General Mills, Inc. (GIS) and Lamb Weston Holdings, Inc. (LW), enabling a straightforward comparison of their financial performance and stability.
| Ratios | General Mills, Inc. (2025) | Lamb Weston Holdings, Inc. (2025) |
|---|---|---|
| ROE | 24.95% | 20.56% |
| ROIC | 9.62% | 7.43% |
| P/E | 12.90 | 22.21 |
| P/B | 3.22 | 4.56 |
| Current Ratio | 0.67 | 1.38 |
| Quick Ratio | 0.43 | 0.68 |
| D/E | 1.66 | 2.39 |
| Debt-to-Assets | 46.3% | 56.2% |
| Interest Coverage | 6.02 | 3.70 |
| Asset Turnover | 0.59 | 0.87 |
| Fixed Asset Turnover | 4.83 | 1.68 |
| Payout ratio | 58.3% | 57.9% |
| Dividend yield | 4.52% | 2.61% |
Interpretation of the Ratios
General Mills, Inc.
General Mills shows a solid financial profile with favorable net margin of 11.78% and return on equity at 24.95%. However, concerns arise from a low current ratio of 0.67 and a debt-to-equity ratio of 1.66, indicating liquidity and leverage challenges. The dividend yield of 4.52% is supported by stable payouts, reflecting consistent shareholder returns without apparent risk of unsustainable distributions.
Lamb Weston Holdings, Inc.
Lamb Weston’s ratios present mixed signals: a neutral net margin of 5.54% and a favorable return on equity of 20.56%, but weaker liquidity with a quick ratio of 0.68 and a high debt-to-assets ratio at 56.21%. Its dividend yield stands at 2.61%, supported by moderate payouts, though higher leverage and neutral interest coverage suggest some financial pressure.
Which one has the best ratios?
General Mills exhibits a more favorable overall ratio profile with half of its key metrics rated positively, including profitability and dividend yield, despite some liquidity concerns. Lamb Weston faces more neutral or unfavorable ratios, particularly regarding leverage and liquidity, resulting in a slightly less favorable financial stance compared to General Mills.
Strategic Positioning
This section compares the strategic positioning of General Mills, Inc. and Lamb Weston Holdings, Inc., focusing on market position, key segments, and exposure to technological disruption:
General Mills, Inc.
- Large market cap at 23.7B USD in packaged foods, facing broad competition.
- Diverse product portfolio including cereals, snacks, pet food, yogurt, and baking mixes.
- No explicit mention of technological disruption exposure in available data.
Lamb Weston Holdings, Inc.
- Smaller market cap of 5.8B USD, competing in frozen potato products.
- Concentrated mainly on frozen potatoes with segments in Foodservice, Retail, and Global.
- No explicit mention of technological disruption exposure in available data.
General Mills vs Lamb Weston Positioning
General Mills has a diversified business model spanning multiple food categories, offering resilience but also complexity. Lamb Weston focuses on frozen potato products, providing specialization but higher concentration risk, based on the provided data.
Which has the best competitive advantage?
General Mills demonstrates a very favorable moat with growing ROIC above WACC, indicating durable competitive advantage. Lamb Weston has a slightly favorable moat with declining ROIC, suggesting less robust profitability sustainability.
Stock Comparison
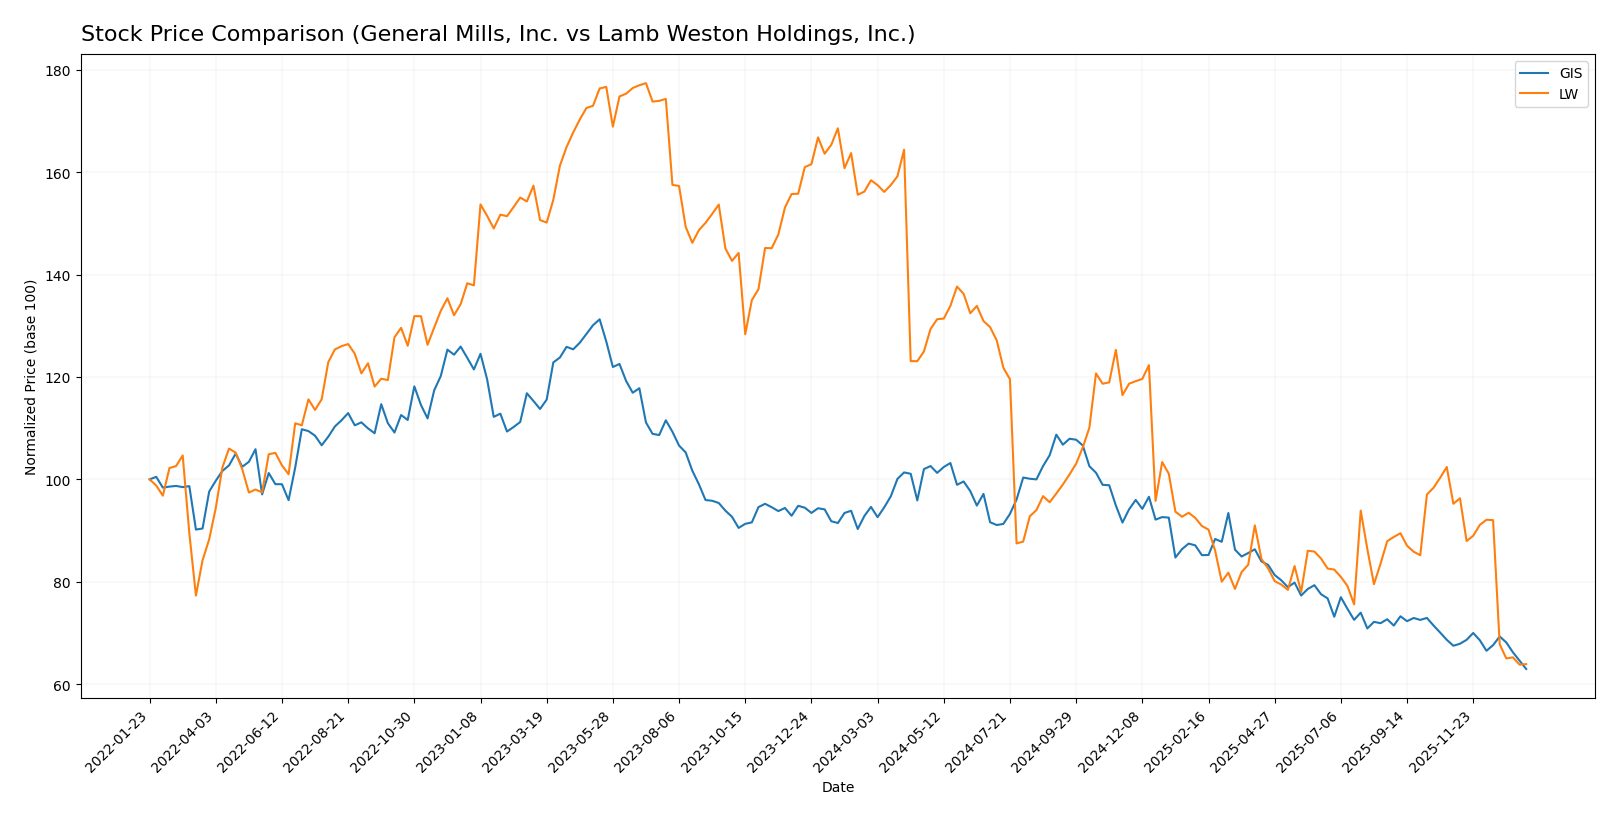
The stock price movements of General Mills, Inc. (GIS) and Lamb Weston Holdings, Inc. (LW) over the past year reveal significant bearish trends with contrasting acceleration patterns and trading volume dynamics.
Trend Analysis
General Mills, Inc. (GIS) experienced a -33.44% price decline over the past 12 months, indicating a bearish trend with accelerating downward momentum. The stock ranged between a high of 75.06 and a low of 43.48, supported by an 8.84 standard deviation.
Lamb Weston Holdings, Inc. (LW) showed a more severe bearish trend with a -59.65% price decline over the same period, but the decline is decelerating. The stock fluctuated from a high of 106.53 to a low of 41.37, with higher volatility at a 15.2 standard deviation.
Comparing both stocks, General Mills has outperformed Lamb Weston in market performance over the last year, showing a less steep decline and an accelerating but smaller loss in value.
Target Prices
Analysts present a clear consensus on target prices for General Mills, Inc. and Lamb Weston Holdings, Inc.
| Company | Target High | Target Low | Consensus |
|---|---|---|---|
| General Mills, Inc. | 63 | 47 | 52.2 |
| Lamb Weston Holdings, Inc. | 68 | 46 | 52.67 |
The target consensus for both companies is significantly above their current prices ($43.48 for General Mills and $41.43 for Lamb Weston), suggesting moderate upside potential according to analysts.
Analyst Opinions Comparison
This section compares analysts’ ratings and grades for General Mills, Inc. (GIS) and Lamb Weston Holdings, Inc. (LW):
Rating Comparison
GIS Rating
- Rating: A- indicating a very favorable overall assessment.
- Discounted Cash Flow Score: 5, very favorable, suggesting undervaluation.
- ROE Score: 5, very favorable, showing efficient profit generation.
- ROA Score: 4, favorable, reflecting effective asset utilization.
- Debt To Equity Score: 1, very unfavorable, indicating high financial risk.
- Overall Score: 4, favorable overall financial standing.
LW Rating
- Rating: B indicating a very favorable overall assessment.
- Discounted Cash Flow Score: 4, favorable, indicating slight undervaluation.
- ROE Score: 5, very favorable, showing efficient profit generation.
- ROA Score: 4, favorable, reflecting effective asset utilization.
- Debt To Equity Score: 1, very unfavorable, indicating high financial risk.
- Overall Score: 3, moderate overall financial standing.
Which one is the best rated?
Based on the data, GIS has a higher overall score (4 vs. 3) and a better discounted cash flow rating, despite both companies sharing identical ROE, ROA, and debt-to-equity scores. GIS is thus rated more favorably overall.
Scores Comparison
Here is a comparison of the Altman Z-Score and Piotroski Score for the two companies:
GIS Scores
- Altman Z-Score: 2.43, indicating moderate risk in the grey zone.
- Piotroski Score: 6, reflecting average financial strength.
LW Scores
- Altman Z-Score: 2.75, indicating moderate risk in the grey zone.
- Piotroski Score: 9, reflecting very strong financial strength.
Which company has the best scores?
LW has a slightly higher Altman Z-Score, both in the grey zone, and a significantly stronger Piotroski Score compared to GIS. This suggests LW exhibits stronger financial health based strictly on these scores.
Grades Comparison
Here is a comparison of the recent grades assigned to both companies by reputable grading firms:
General Mills, Inc. Grades
The following table lists recent grades from recognized financial institutions for General Mills, Inc.:
| Grading Company | Action | New Grade | Date |
|---|---|---|---|
| Wells Fargo | Maintain | Equal Weight | 2026-01-05 |
| Morgan Stanley | Maintain | Underweight | 2025-12-22 |
| Wells Fargo | Maintain | Equal Weight | 2025-12-18 |
| TD Cowen | Maintain | Hold | 2025-12-18 |
| Bernstein | Maintain | Market Perform | 2025-12-18 |
| TD Cowen | Maintain | Hold | 2025-12-15 |
| Wells Fargo | Maintain | Equal Weight | 2025-12-12 |
| Stifel | Maintain | Buy | 2025-12-11 |
| Jefferies | Maintain | Hold | 2025-12-11 |
| Mizuho | Maintain | Neutral | 2025-09-19 |
Overall, General Mills’ grades predominantly indicate a hold or equal weight stance, with occasional buy recommendations, reflecting a cautious but generally stable outlook.
Lamb Weston Holdings, Inc. Grades
Below are recent grades from well-known grading firms for Lamb Weston Holdings, Inc.:
| Grading Company | Action | New Grade | Date |
|---|---|---|---|
| Wells Fargo | Maintain | Overweight | 2025-12-23 |
| Barclays | Maintain | Overweight | 2025-12-23 |
| B of A Securities | Maintain | Neutral | 2025-12-22 |
| Stifel | Maintain | Hold | 2025-12-22 |
| Deutsche Bank | Maintain | Hold | 2025-12-22 |
| Wells Fargo | Maintain | Overweight | 2025-10-01 |
| B of A Securities | Maintain | Neutral | 2025-10-01 |
| Barclays | Maintain | Overweight | 2025-07-25 |
| Wells Fargo | Maintain | Overweight | 2025-07-24 |
| Wells Fargo | Maintain | Overweight | 2025-07-09 |
Lamb Weston’s grades mostly suggest an overweight or buy stance, with some hold and neutral ratings, pointing to a generally more optimistic market view compared to General Mills.
Which company has the best grades?
Lamb Weston Holdings, Inc. has received more favorable grades, predominantly “Overweight,” compared to General Mills, Inc.’s mostly “Hold” and “Equal Weight” ratings. For investors, this suggests that Lamb Weston is viewed as having stronger growth or value potential in the near term.
Strengths and Weaknesses
Below is a comparative table summarizing the key strengths and weaknesses of General Mills, Inc. (GIS) and Lamb Weston Holdings, Inc. (LW) based on recent financial and operational data.
| Criterion | General Mills, Inc. (GIS) | Lamb Weston Holdings, Inc. (LW) |
|---|---|---|
| Diversification | Highly diversified product portfolio across multiple food categories, including snacks, cereals, pet products, and super-premium ice cream (leading segment: Snacks at $4.19B). | More focused on frozen potato products and foodservice segments with moderate diversification (leading segment: Global Segment at $2.93B). |
| Profitability | Strong profitability with net margin at 11.78% and ROE at 24.95%, indicating efficient returns on equity. | Moderate profitability with net margin at 5.54% and ROE at 20.56%, reflecting decent but lower margin levels. |
| Innovation | Demonstrates a durable competitive advantage with growing ROIC (+2.87% trend) and a very favorable moat status. | Creating value but facing declining ROIC (-26.5% trend), signaling challenges in sustaining profitability improvements. |
| Global presence | Solid global footprint with broad product reach and substantial international sales. | Global presence mainly through the Global Segment but less diverse compared to GIS. |
| Market Share | Leading presence in multiple food categories with steady revenue growth across segments. | Strong in frozen potato market niche but with concentrated product exposure. |
Key takeaways: General Mills shows greater diversification, stronger profitability, and a durable competitive advantage with improving returns. Lamb Weston, while profitable, faces declining efficiency and narrower diversification, which may increase risk. Investors prioritizing stable growth and broad exposure may lean toward GIS, whereas those focused on niche market leadership should weigh LW’s challenges carefully.
Risk Analysis
Below is a comparative table highlighting key risks for General Mills, Inc. (GIS) and Lamb Weston Holdings, Inc. (LW) based on the most recent 2025 data:
| Metric | General Mills, Inc. (GIS) | Lamb Weston Holdings, Inc. (LW) |
|---|---|---|
| Market Risk | Low beta (-0.07) suggests low market volatility sensitivity | Moderate beta (0.44) indicates moderate market sensitivity |
| Debt level | Moderate debt-to-assets (46.25%), D/E 1.66 (unfavorable) | Higher debt-to-assets (56.21%), D/E 2.39 (unfavorable) |
| Regulatory Risk | Moderate, food industry subject to health and safety regulations | Moderate, similar regulatory environment as GIS |
| Operational Risk | Diversified product portfolio reduces risk | Focused on frozen potato products, higher concentration risk |
| Environmental Risk | Exposure due to agricultural supply chain and sustainability pressures | Similar agricultural sourcing risks, increasing eco-regulation impact |
| Geopolitical Risk | Moderate, global operations but mainly North America | Moderate, global reach but concentrated in foodservice and retail |
The most impactful risks are the elevated leverage levels for both companies, with Lamb Weston showing higher debt exposure, increasing financial risk. Market risk is relatively contained, especially for General Mills with its negative beta. Operational risk weighs more on Lamb Weston due to narrower product focus, making it more vulnerable to market shifts or supply disruptions. Environmental and regulatory pressures remain ongoing challenges given the agricultural inputs and evolving standards in the food sector.
Which Stock to Choose?
General Mills, Inc. (GIS) shows a slightly unfavorable income statement trend with a 1-year revenue decline of -1.87% and a net margin contraction of -6.32%. Despite this, GIS maintains favorable profitability ratios, including a 24.95% ROE and a 4.52% dividend yield, though liquidity ratios and debt levels are less favorable. Its overall rating is very favorable (A-), supported by a very favorable moat indicating durable competitive advantage.
Lamb Weston Holdings, Inc. (LW) presents a neutral income statement evaluation with a strong overall revenue growth of 75.74% over five years but a sharp 1-year net margin drop of -50.64%. Financial ratios show mixed signals: favorable ROE at 20.56% but unfavorable debt metrics and a moderate rating (B). Its economic moat is slightly favorable with declining ROIC, suggesting weakening profitability.
Investors favoring stability and a durable competitive moat might find GIS’s strong rating and consistent profitability more appealing, while those with a tolerance for volatility and focus on growth could interpret LW’s significant revenue expansion and strong Piotroski score as potential. The choice could vary depending on the investor’s risk profile and strategy.
Disclaimer: Investment carries a risk of loss of initial capital. The past performance is not a reliable indicator of future results. Be sure to understand risks before making an investment decision.
Go Further
I encourage you to read the complete analyses of General Mills, Inc. and Lamb Weston Holdings, Inc. to enhance your investment decisions: