In the dynamic world of packaged foods, JBS N.V. and General Mills, Inc. stand out as global leaders shaping consumer choices. Both companies operate within the same industry yet pursue distinct innovation strategies and market approaches, offering unique investment opportunities. This comparison highlights their strengths and challenges, helping you, the investor, decide which company presents the most compelling case for your portfolio in 2026.
Table of contents
Companies Overview
I will begin the comparison between JBS N.V. and General Mills, Inc. by providing an overview of these two companies and their main differences.
JBS N.V. Overview
JBS N.V. is a global protein and food company headquartered in the Netherlands. Its operations span beef, pork, chicken, fish, and lamb products, along with leather, biodiesel, and packaging materials. Founded in 1953, JBS also engages in meat processing, pet food production, logistics, and energy generation, positioning itself as a diversified leader in the packaged foods industry.
General Mills, Inc. Overview
General Mills, Inc., based in Minneapolis, Minnesota, is a leading manufacturer and marketer of branded consumer foods worldwide. Established in 1866, the company operates across multiple segments, offering cereals, snacks, dairy, frozen foods, and pet products. It markets numerous well-known brands and serves retail, foodservice, and e-commerce channels globally within the packaged foods sector.
Key similarities and differences
Both JBS and General Mills operate within the packaged foods industry, focusing on global markets and diverse product portfolios. JBS emphasizes protein products and related by-products with extensive vertical integration, while General Mills centers on branded consumer foods and pet products with a strong focus on marketing and retail distribution. Their business models differ in product specialization and operational scope, with JBS covering broader industrial activities beyond food production.
Income Statement Comparison
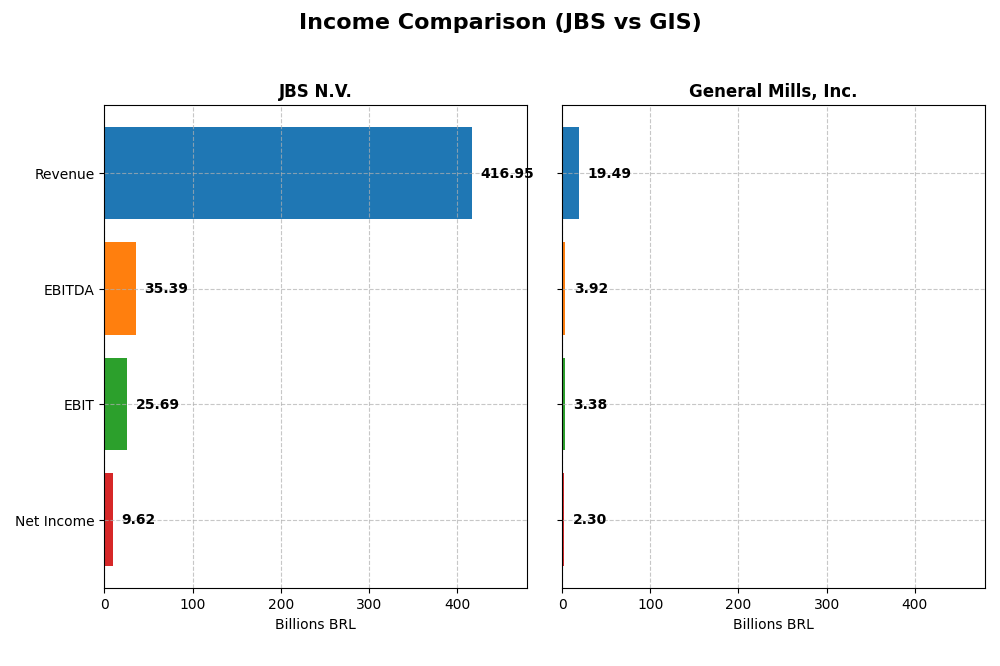
The table below presents a side-by-side comparison of key income statement metrics for JBS N.V. and General Mills, Inc. for their most recent fiscal years.
| Metric | JBS N.V. (2024) | General Mills, Inc. (2025) |
|---|---|---|
| Market Cap | 31.7B BRL | 23.7B USD |
| Revenue | 417B BRL | 19.5B USD |
| EBITDA | 35.4B BRL | 3.9B USD |
| EBIT | 25.7B BRL | 3.4B USD |
| Net Income | 9.6B BRL | 2.3B USD |
| EPS | 30.55 BRL | 4.12 USD |
| Fiscal Year | 2024 | 2025 |
Income Statement Interpretations
JBS N.V.
JBS experienced significant revenue growth of 14.61% in the most recent year, contributing to a 54.31% increase over the 2020-2024 period. Net income rebounded strongly from a negative figure in 2023 to 9.62B BRL in 2024, marking a 890.83% rise in net margin and a 1514.35% jump in EPS. Margins remain generally stable but showed marked improvement in profitability metrics in 2024.
General Mills, Inc.
General Mills showed a slight revenue decline of 1.87% in 2025, after modest overall growth of 7.5% since 2021. Net income and margins contracted, with net income down 1.91% over the period and a 6.32% net margin decrease in the last year. Despite stable gross and EBIT margins above 17%, recent declines in profitability ratios and EPS reflect some operational pressures.
Which one has the stronger fundamentals?
JBS displays stronger fundamentals with favorable growth across revenue, net income, margins, and EPS, reversing previous losses and improving profitability significantly in 2024. Conversely, General Mills faces challenges with declining recent revenue and net income, and unfavorable margin trends, despite maintaining relatively high absolute margins. JBS’s performance indicates more robust income statement improvements.
Financial Ratios Comparison
The table below compares key financial ratios for JBS N.V. and General Mills, Inc. based on their most recent fiscal year data.
| Ratios | JBS N.V. (2024) | General Mills, Inc. (2025) |
|---|---|---|
| ROE | 21.47% | 24.95% |
| ROIC | 8.61% | 9.62% |
| P/E | 3.20 | 12.90 |
| P/B | 0.69 | 3.22 |
| Current Ratio | 1.47 | 0.67 |
| Quick Ratio | 0.90 | 0.43 |
| D/E (Debt-to-Equity) | 3.01 | 1.66 |
| Debt-to-Assets | 53.56% | 46.25% |
| Interest Coverage | 2.33 | 6.02 |
| Asset Turnover | 1.65 | 0.59 |
| Fixed Asset Turnover | 4.85 | 4.83 |
| Payout Ratio | 46.14% | 58.33% |
| Dividend Yield | 14.42% | 4.52% |
Interpretation of the Ratios
JBS N.V.
JBS exhibits a mix of strong and weak ratios, with favorable return on equity at 21.47% and a low price-to-earnings ratio of 3.2, indicating potential undervaluation. However, the company faces concerns with a high debt-to-equity ratio of 3.01 and a net margin of just 2.31%. Dividend yield is high at 14.42%, but coverage by free cash flow is cautious due to leverage risks.
General Mills, Inc.
General Mills shows strong profitability with a net margin of 11.78% and return on equity near 25%. Yet, liquidity ratios are weak, with current and quick ratios below 1, signaling possible short-term financial stress. The dividend yield at 4.52% is covered by stable earnings and moderate payout, though the price-to-book ratio of 3.22 is relatively high, reflecting premium valuation.
Which one has the best ratios?
Both JBS and General Mills have a balanced set of favorable and unfavorable ratios, each with unique strengths and weaknesses. JBS benefits from strong asset turnover and low valuation multiples but carries higher leverage. General Mills offers superior profitability and dividend stability but struggles with liquidity and valuation. Overall, neither company overwhelmingly outperforms the other in all ratio categories.
Strategic Positioning
This section compares the strategic positioning of JBS and General Mills, Inc., including market position, key segments, and exposure to technological disruption:
JBS
- Operates worldwide in protein and food industries, facing competitive pressure in packaged foods.
- Key segments include beef, pork, chicken, poultry, plant-based products, and diversified byproducts.
- Exposure to disruption is not explicitly stated or detailed in provided data.
General Mills, Inc.
- Manufactures and markets branded consumer foods globally, competing in multiple packaged food segments.
- Operates five segments: cereals, snacks, pet food, baking mixes, and refrigerated meals, with diverse branded products.
- No explicit information on technological disruption exposure is provided in the available data.
JBS vs General Mills, Inc. Positioning
JBS adopts a diversified strategy with broad protein and byproduct offerings, while General Mills focuses on branded consumer food products across multiple segments. JBS’s scale contrasts with General Mills’ concentrated branded portfolio.
Which has the best competitive advantage?
General Mills shows a very favorable moat with growing ROIC, indicating durable competitive advantage. JBS has a slightly favorable moat with declining ROIC, suggesting value creation but weakening profitability.
Stock Comparison
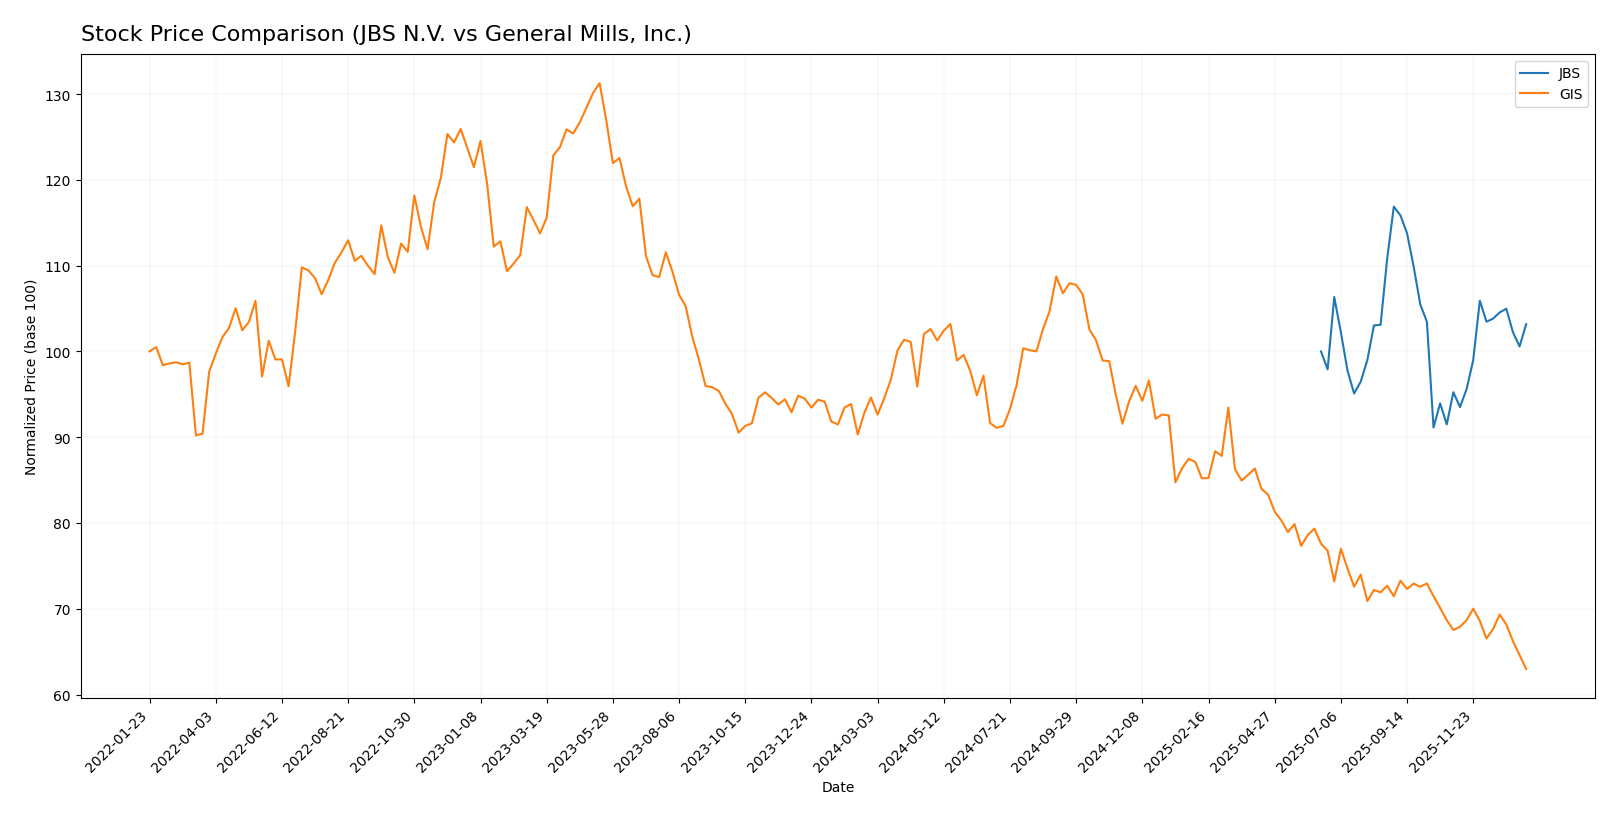
The stock price chart highlights JBS N.V.’s modest bullish trend with price acceleration, contrasting with General Mills, Inc.’s marked bearish movement and heightened volatility over the past 12 months.
Trend Analysis
JBS N.V. experienced a 3.17% price increase over the past year, indicating a bullish trend with accelerating momentum. The stock showed a low volatility of 0.9 std deviation and traded between 12.64 and 16.21.
General Mills, Inc. registered a significant 33.44% price decline, reflecting a bearish trend with acceleration. The stock exhibited high volatility at 8.84 std deviation, with prices ranging from 43.48 to 75.06 during the period.
Comparing both, JBS N.V. delivered the highest market performance with a positive 3.17% change, while General Mills posted a substantial negative return over the same timeframe.
Target Prices
The target price consensus from recognized analysts indicates promising upside potential for both JBS N.V. and General Mills, Inc.
| Company | Target High | Target Low | Consensus |
|---|---|---|---|
| JBS N.V. | 20 | 17 | 18.5 |
| General Mills, Inc. | 63 | 47 | 52.2 |
Analysts expect JBS shares to rise from the current 14.31 USD to a consensus target of 18.5 USD, signaling a significant upside. General Mills is forecasted to increase from 43.48 USD to approximately 52.2 USD, reflecting moderate growth potential aligned with its stable market position.
Analyst Opinions Comparison
This section compares analysts’ ratings and grades for JBS N.V. and General Mills, Inc.:
Rating Comparison
JBS Rating
- Rating: A, considered very favorable by analysts.
- Discounted Cash Flow Score: 4, indicating a favorable assessment of future cash flows.
- ROE Score: 5, reflecting very efficient profit generation from shareholders’ equity.
- ROA Score: 5, showing very effective use of assets to generate earnings.
- Debt To Equity Score: 1, representing a very unfavorable financial risk due to high leverage.
- Overall Score: 4, a favorable summary of the company’s financial standing.
GIS Rating
- Rating: A-, also considered very favorable by analysts.
- Discounted Cash Flow Score: 5, suggesting a very favorable outlook on future cash flows.
- ROE Score: 5, equally reflecting very efficient profit generation from shareholders’ equity.
- ROA Score: 4, indicating favorable but slightly lower asset utilization efficiency than JBS.
- Debt To Equity Score: 1, similarly representing very unfavorable financial risk due to leverage.
- Overall Score: 4, also a favorable summary of financial standing.
Which one is the best rated?
Both companies share the same overall score of 4 and very favorable primary ratings, but GIS has a higher discounted cash flow score (5 vs. 4) and a slightly lower ROA score compared to JBS. Their debt-to-equity risk is equally unfavorable.
Scores Comparison
Here is a comparison of the financial scores for JBS and General Mills, Inc.:
JBS Scores
- Altman Z-Score: 10.74, in the safe zone, indicating low bankruptcy risk.
- Piotroski Score: 8, very strong financial health indication.
GIS Scores
- Altman Z-Score: 2.43, in the grey zone, indicating moderate bankruptcy risk.
- Piotroski Score: 6, average financial health indication.
Which company has the best scores?
Based on the provided data, JBS shows superior scores with a higher Altman Z-Score firmly in the safe zone and a very strong Piotroski Score. General Mills has a moderate Altman Z-Score and average Piotroski Score, indicating relatively weaker financial strength compared to JBS.
Grades Comparison
Here is a comparison of the recent grades assigned to JBS N.V. and General Mills, Inc.:
JBS N.V. Grades
The following table summarizes recent grades from recognized financial institutions for JBS N.V.:
| Grading Company | Action | New Grade | Date |
|---|---|---|---|
| JP Morgan | Maintain | Overweight | 2025-10-14 |
| JP Morgan | Maintain | Overweight | 2025-09-03 |
| Stephens & Co. | Maintain | Overweight | 2025-08-15 |
| Stephens & Co. | Maintain | Overweight | 2025-06-26 |
Grades for JBS N.V. have consistently been “Overweight,” reflecting a positive outlook maintained over several months.
General Mills, Inc. Grades
Below is a summary of recent grades from reputable financial firms for General Mills, Inc.:
| Grading Company | Action | New Grade | Date |
|---|---|---|---|
| Wells Fargo | Maintain | Equal Weight | 2026-01-05 |
| Morgan Stanley | Maintain | Underweight | 2025-12-22 |
| Wells Fargo | Maintain | Equal Weight | 2025-12-18 |
| TD Cowen | Maintain | Hold | 2025-12-18 |
| Bernstein | Maintain | Market Perform | 2025-12-18 |
| TD Cowen | Maintain | Hold | 2025-12-15 |
| Wells Fargo | Maintain | Equal Weight | 2025-12-12 |
| Stifel | Maintain | Buy | 2025-12-11 |
| Jefferies | Maintain | Hold | 2025-12-11 |
| Mizuho | Maintain | Neutral | 2025-09-19 |
Grades for General Mills, Inc. range mostly between “Hold” and “Equal Weight,” with occasional “Buy” and “Underweight” ratings, indicating a mixed but generally cautious stance.
Which company has the best grades?
JBS N.V. consistently holds an “Overweight” rating, suggesting stronger analyst confidence compared to General Mills, Inc., which mostly receives “Hold” or “Equal Weight” grades. This difference may influence investors seeking more bullish outlooks towards JBS.
Strengths and Weaknesses
Below is a comparison of key strengths and weaknesses for JBS N.V. and General Mills, Inc., based on their latest financial and strategic data.
| Criterion | JBS N.V. | General Mills, Inc. |
|---|---|---|
| Diversification | Focused mainly on meat processing; limited product range diversification. | Broad product portfolio including snacks, cereals, pet food, and dairy. |
| Profitability | Moderate net margin (2.31%), high ROE (21.47%), but declining ROIC trend. | Strong net margin (11.78%), high ROE (24.95%), and growing ROIC trend. |
| Innovation | Moderate innovation with stable asset turnover; less emphasis on new product categories. | Active innovation across multiple segments including super-premium ice cream and convenient meals. |
| Global presence | Strong global meat processing footprint. | Global reach with diversified food product presence. |
| Market Share | Leading player in meat industry but facing profitability pressure. | Significant market share in packaged foods and snacks with durable competitive advantage. |
Key takeaways: General Mills shows a more diversified product base and improving profitability, signaling a durable competitive advantage. JBS, while profitable, faces a declining ROIC trend and less diversification, suggesting caution despite its strong market position.
Risk Analysis
Below is a comparative risk table for JBS N.V. and General Mills, Inc. based on the most recent data available (2025-2026):
| Metric | JBS N.V. | General Mills, Inc. |
|---|---|---|
| Market Risk | Beta 0.48 (low volatility) | Beta -0.07 (stable, defensive) |
| Debt level | High (DE 3.01; Debt/Assets 53.56%) | Moderate-High (DE 1.66; Debt/Assets 46.25%) |
| Regulatory Risk | Moderate (global meat industry regulations) | Moderate (food safety and labeling) |
| Operational Risk | High (complex global supply chain, meat processing) | Moderate (diverse product portfolio, supply chain) |
| Environmental Risk | Elevated (meat industry carbon footprint, deforestation concerns) | Moderate (sustainability initiatives ongoing) |
| Geopolitical Risk | Moderate (exposure to Latin America, Brazil) | Low-Moderate (mainly US operations) |
JBS faces the most impactful risks from high leverage and environmental concerns due to its extensive meat processing operations and global footprint. General Mills, while stable with low market volatility, shows moderate debt and operational risks but benefits from diversification and lower geopolitical exposure. Investors should weigh JBS’s financial strength against its higher leverage and environmental scrutiny.
Which Stock to Choose?
JBS N.V. shows a favorable income evolution with a 14.61% revenue growth in 2024 and strong profitability indicators such as a 21.47% ROE. Its financial ratios are slightly favorable overall, despite elevated debt levels and a neutral current ratio. The company holds a very favorable “A” rating reflecting solid returns and undervaluation signs.
General Mills, Inc. presents an unfavorable income trend with a slight revenue decline of 1.87% in 2025 and mixed profitability; net margin stands at 11.78% with a 24.95% ROE. Financial ratios are slightly favorable but tempered by weak liquidity and debt metrics. The firm’s rating is very favorable “A-” yet signals moderate valuation concerns.
For investors, the choice might depend on risk tolerance and investment strategy: growth-oriented profiles could find JBS’s improving income and strong valuation metrics appealing, while those prioritizing durable profitability and stable competitive advantage may view General Mills’ very favorable moat and rating as attractive despite recent income challenges.
Disclaimer: Investment carries a risk of loss of initial capital. The past performance is not a reliable indicator of future results. Be sure to understand risks before making an investment decision.
Go Further
I encourage you to read the complete analyses of JBS N.V. and General Mills, Inc. to enhance your investment decisions: