In the competitive world of packaged foods, General Mills, Inc. (GIS) and Hormel Foods Corporation (HRL) stand out as two industry giants with significant market presence and innovation strategies. Both companies offer diverse product lines catering to evolving consumer preferences, from ready-to-eat meals to specialty snacks. This article explores their business models and growth prospects to help you decide which company best fits your investment portfolio in 2026.
Table of contents
Companies Overview
I will begin the comparison between General Mills and Hormel Foods by providing an overview of these two companies and their main differences.
General Mills Overview
General Mills, Inc. is a global manufacturer and marketer of branded consumer foods. The company operates across five segments, including North America Retail and Pet products. Its portfolio covers a wide range of items such as cereals, yogurt, snacks, and pet food. Headquartered in Minneapolis, Minnesota, General Mills is well-established in the packaged foods industry with a market capitalization of approximately 23.7B USD.
Hormel Foods Overview
Hormel Foods Corporation develops and distributes meat, nuts, and other food products primarily in the United States and internationally. It operates through four segments, including Grocery Products and Jennie-O Turkey Store, offering perishable and shelf-stable items under brands like SPAM and SKIPPY. Based in Austin, Minnesota, Hormel holds a market cap near 12.6B USD and serves retail, foodservice, and commercial customers.
Key similarities and differences
Both General Mills and Hormel Foods operate in the packaged foods sector and serve retail and foodservice channels. General Mills has a broader product range including pet food and international segments, while Hormel focuses more on meat and related perishable products. General Mills is nearly twice as large by market cap and employs more people, reflecting its more diversified portfolio compared to Hormel’s specialized offerings.
Income Statement Comparison
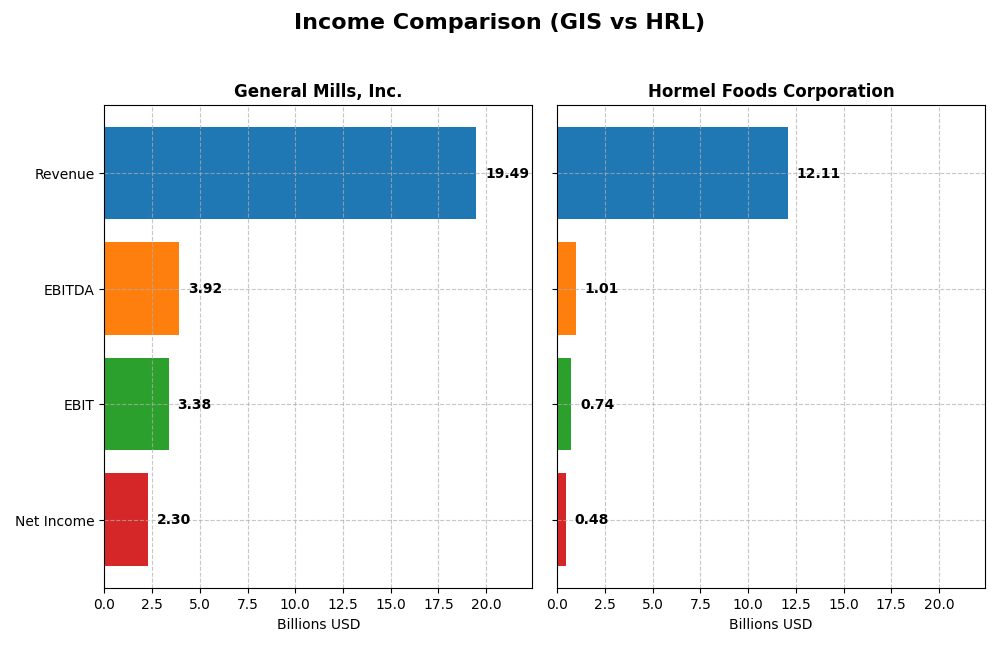
The table below presents the most recent fiscal year income statement metrics for General Mills, Inc. and Hormel Foods Corporation, enabling a straightforward financial comparison.
| Metric | General Mills, Inc. (GIS) | Hormel Foods Corporation (HRL) |
|---|---|---|
| Market Cap | 23.7B | 12.6B |
| Revenue | 19.5B | 12.1B |
| EBITDA | 3.92B | 1.01B |
| EBIT | 3.38B | 742M |
| Net Income | 2.30B | 478M |
| EPS | 4.12 | 0.87 |
| Fiscal Year | 2025 | 2025 |
Income Statement Interpretations
General Mills, Inc.
General Mills showed modest revenue growth of 7.5% over 2021-2025 but experienced a 1.87% decline in revenue in the most recent year. Net income slightly decreased overall by 1.91%, with net margins falling 8.75%. Despite this, the company maintained favorable gross (34.55%) and EBIT (17.36%) margins, though recent net margin and EPS growth slowed, reflecting pressured profitability in 2025.
Hormel Foods Corporation
Hormel’s revenue grew 6.32% over the period but declined 1.55% in the last year, accompanied by a sharp 47.38% drop in net income overall. Margins remained neutral to unfavorable, with a 3.95% net margin in 2025 and a steep 41.51% net margin contraction year-over-year. EBIT and EPS also fell sharply, indicating significant recent profitability challenges.
Which one has the stronger fundamentals?
Both companies face unfavorable income statement evaluations for recent years, with declines in profitability and net income. General Mills demonstrates stronger margins and more stability despite slight revenue and income setbacks, while Hormel suffers more severe margin compression and net income declines. Overall, General Mills exhibits relatively stronger financial fundamentals in profitability and margin metrics.
Financial Ratios Comparison
The table below presents the most recent key financial ratios for General Mills, Inc. (GIS) and Hormel Foods Corporation (HRL), providing a snapshot of their profitability, liquidity, leverage, efficiency, and dividend metrics as of fiscal year 2025.
| Ratios | General Mills, Inc. (GIS) | Hormel Foods Corporation (HRL) |
|---|---|---|
| ROE | 24.95% | 6.04% |
| ROIC | 9.62% | 4.31% |
| P/E | 12.90 | 24.84 |
| P/B | 3.22 | 1.50 |
| Current Ratio | 0.67 | 2.47 |
| Quick Ratio | 0.43 | 1.20 |
| D/E (Debt-to-Equity) | 1.66 | 0.36 |
| Debt-to-Assets | 46.25% | 21.34% |
| Interest Coverage | 6.02 | 9.21 |
| Asset Turnover | 0.59 | 0.90 |
| Fixed Asset Turnover | 4.83 | 5.41 |
| Payout Ratio | 58.33% | 132.41% |
| Dividend Yield | 4.52% | 5.33% |
Interpretation of the Ratios
General Mills, Inc.
General Mills shows a mix of strong and weak ratios with a favorable net margin of 11.78% and robust ROE at 24.95%, indicating effective profitability. However, its current and quick ratios are low at 0.67 and 0.43, raising liquidity concerns. The dividend yield is attractive at 4.52%, supported by a consistent payout, though debt levels warrant caution.
Hormel Foods Corporation
Hormel Foods exhibits weaker profitability ratios, with a net margin of 3.95% and ROE of 6.04%, both unfavorable. Its liquidity is strong, with a current ratio of 2.47 and low debt-to-equity at 0.36. The dividend yield stands at 5.33%, reflecting steady shareholder returns, balanced by a neutral PE ratio and cautious capital structure.
Which one has the best ratios?
Both companies have 50% favorable ratios, but General Mills demonstrates stronger profitability and coverage ratios, while Hormel Foods excels in liquidity and lower leverage. Each presents trade-offs: General Mills faces liquidity and debt challenges, whereas Hormel’s profitability remains subdued despite its solid balance sheet.
Strategic Positioning
This section compares the strategic positioning of General Mills, Inc. and Hormel Foods Corporation, including market position, key segments, and exposure to disruption:
General Mills, Inc.
- Market leader in packaged foods with a $23.7B market cap; faces competitive pressure in diverse retail channels.
- Diversified segments: cereals, snacks, pet food, dairy, and frozen meals driving revenue across five geographic areas.
- Exposure to disruption moderate; operates multiple product categories including organic and wellness, adapting product mix.
Hormel Foods Corporation
- Mid-sized player at $12.6B market cap, focusing on meat products with moderate competitive pressure.
- Concentrated in meat, nuts, and food products across grocery, refrigerated, turkey, and international segments.
- Faces technological disruption mostly in meat processing and foodservice innovation, with a narrower product range.
General Mills, Inc. vs Hormel Foods Corporation Positioning
General Mills pursues a diversified approach across multiple food categories and global markets, offering broad revenue streams but facing complex competitive dynamics. Hormel focuses more narrowly on meat and related products, potentially limiting diversification but allowing concentrated operational focus.
Which has the best competitive advantage?
General Mills exhibits a very favorable moat with growing ROIC exceeding WACC, indicating durable competitive advantage and efficient capital use. Hormel shows a very unfavorable moat with declining ROIC below WACC, signaling value destruction and weaker competitive positioning.
Stock Comparison
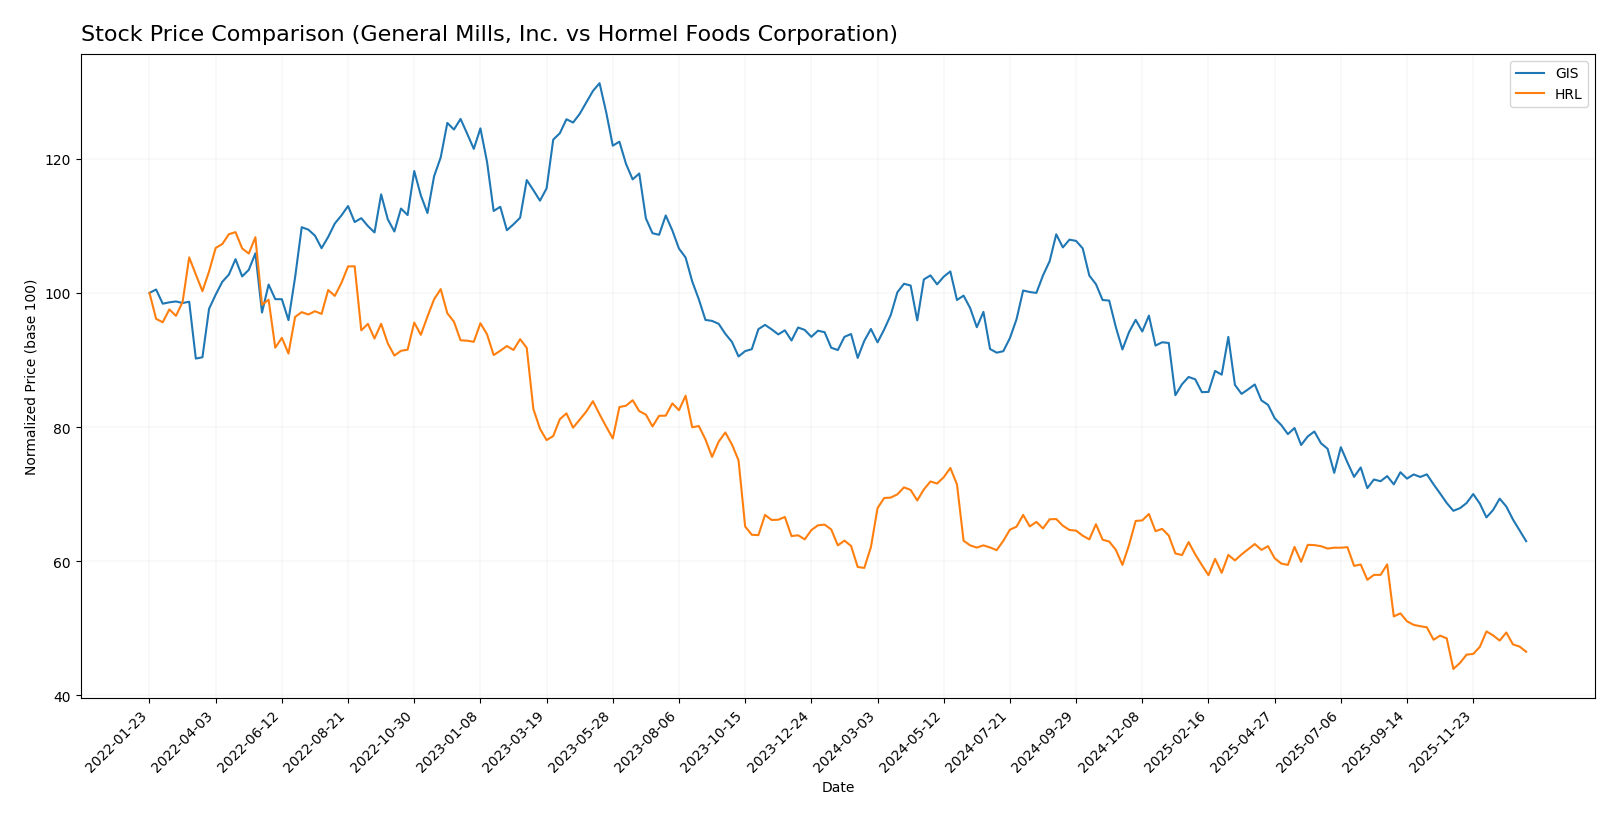
The past 12 months reveal contrasting stock price dynamics for General Mills, Inc. and Hormel Foods Corporation, with both experiencing notable price declines overall yet diverging in recent directional momentum and volatility.
Trend Analysis
General Mills, Inc. (GIS) shows a bearish trend over the past year, with a 33.44% price decline and accelerating downward momentum. The stock’s volatility is high (std deviation 8.84), hitting a low of 43.48 and a high of 75.06.
Hormel Foods Corporation (HRL) also exhibits a bearish trend over the same period, with a 25.11% price decrease and accelerating decline. However, HRL’s volatility is lower (std deviation 3.52), with prices ranging from 21.59 to 36.31.
Comparing recent trends, HRL reversed to a 5.84% positive price change while GIS continued to decline by 6.72%. HRL delivered the stronger market performance in the latest period despite both stocks showing overall yearly declines.
Target Prices
Here is the target price consensus for General Mills, Inc. and Hormel Foods Corporation based on reliable analyst data.
| Company | Target High | Target Low | Consensus |
|---|---|---|---|
| General Mills, Inc. | 63 | 47 | 52.2 |
| Hormel Foods Corporation | 30 | 26 | 27.75 |
Analysts expect General Mills’ stock to rise significantly from its current price of $43.48 to a consensus target of $52.2, while Hormel Foods has a more modest upside from $22.85 to a consensus target of $27.75. Both stocks show positive outlooks relative to their current prices.
Analyst Opinions Comparison
This section compares analysts’ ratings and grades for General Mills, Inc. (GIS) and Hormel Foods Corporation (HRL):
Rating Comparison
GIS Rating
- Rating: A-, considered Very Favorable.
- Discounted Cash Flow Score: 5, Very Favorable, indicating strong future cash flow projections.
- ROE Score: 5, Very Favorable, reflecting efficient profit generation from equity.
- ROA Score: 4, Favorable, demonstrating effective asset utilization.
- Debt To Equity Score: 1, Very Unfavorable, suggesting high financial risk from debt levels.
- Overall Score: 4, Favorable, reflecting strong overall financial standing.
HRL Rating
- Rating: B, considered Very Favorable.
- Discounted Cash Flow Score: 4, Favorable, showing good but lower valuation confidence.
- ROE Score: 2, Moderate, indicating weaker efficiency in generating equity returns.
- ROA Score: 3, Moderate, showing average asset utilization efficiency.
- Debt To Equity Score: 3, Moderate, indicating balanced financial risk management.
- Overall Score: 3, Moderate, indicating average overall financial health.
Which one is the best rated?
Based strictly on the provided data, General Mills (GIS) is better rated with higher scores in discounted cash flow, ROE, ROA, and overall score, despite its unfavorable debt-to-equity score compared to Hormel Foods (HRL).
Scores Comparison
The following table compares the Altman Z-Score and Piotroski Score of General Mills, Inc. (GIS) and Hormel Foods Corporation (HRL):
GIS Scores
- Altman Z-Score: 2.43, in the grey zone indicating moderate bankruptcy risk
- Piotroski Score: 6, average financial strength
HRL Scores
- Altman Z-Score: 5.17, in the safe zone indicating low bankruptcy risk
- Piotroski Score: 7, strong financial strength
Which company has the best scores?
HRL has a higher Altman Z-Score in the safe zone and a stronger Piotroski Score compared to GIS, which is in the grey zone with an average Piotroski Score. Based strictly on these scores, HRL demonstrates stronger financial health.
Grades Comparison
The following sections present the recent grades and rating consensus for General Mills, Inc. and Hormel Foods Corporation:
General Mills, Inc. Grades
This table summarizes the latest professional grades for General Mills, Inc. from reputable grading companies.
| Grading Company | Action | New Grade | Date |
|---|---|---|---|
| Wells Fargo | Maintain | Equal Weight | 2026-01-05 |
| Morgan Stanley | Maintain | Underweight | 2025-12-22 |
| Wells Fargo | Maintain | Equal Weight | 2025-12-18 |
| TD Cowen | Maintain | Hold | 2025-12-18 |
| Bernstein | Maintain | Market Perform | 2025-12-18 |
| TD Cowen | Maintain | Hold | 2025-12-15 |
| Wells Fargo | Maintain | Equal Weight | 2025-12-12 |
| Stifel | Maintain | Buy | 2025-12-11 |
| Jefferies | Maintain | Hold | 2025-12-11 |
| Mizuho | Maintain | Neutral | 2025-09-19 |
The overall grading trend for General Mills, Inc. reflects a predominantly neutral to cautious outlook, with most ratings clustered around hold or equal weight.
Hormel Foods Corporation Grades
This table summarizes the latest professional grades for Hormel Foods Corporation from reputable grading companies.
| Grading Company | Action | New Grade | Date |
|---|---|---|---|
| Barclays | Maintain | Overweight | 2025-12-09 |
| JP Morgan | Maintain | Overweight | 2025-12-05 |
| B of A Securities | Maintain | Neutral | 2025-12-05 |
| Piper Sandler | Maintain | Neutral | 2025-12-05 |
| JP Morgan | Maintain | Overweight | 2025-11-21 |
| Piper Sandler | Maintain | Neutral | 2025-11-06 |
| Goldman Sachs | Maintain | Buy | 2025-10-30 |
| Goldman Sachs | Maintain | Buy | 2025-08-29 |
| B of A Securities | Maintain | Neutral | 2025-08-29 |
| Barclays | Maintain | Overweight | 2025-08-29 |
Hormel Foods Corporation’s grades indicate a generally favorable outlook, dominated by overweight and buy ratings from major financial institutions.
Which company has the best grades?
Hormel Foods Corporation has received comparatively stronger grades than General Mills, Inc., with more overweight and buy ratings versus mostly hold and equal weight grades for General Mills. This difference could influence investors seeking more positively viewed stocks.
Strengths and Weaknesses
The table below compares key strengths and weaknesses of General Mills, Inc. (GIS) and Hormel Foods Corporation (HRL) based on their recent financial and operational data.
| Criterion | General Mills, Inc. (GIS) | Hormel Foods Corporation (HRL) |
|---|---|---|
| Diversification | Highly diversified product portfolio including snacks (4.19B), pet segment (2.59B), cereals (3.08B), and convenient meals (2.82B). | Diversified across foodservice (3.94B), retail (7.46B), and international (0.71B) segments, with strong presence in perishable meat (8.51B). |
| Profitability | Strong profitability with net margin of 11.78% and ROE at 24.95%, ROIC neutral at 9.62%. | Lower profitability; net margin at 3.95%, ROE 6.04%, and ROIC 4.31%, all unfavorable. |
| Innovation | Demonstrates durable competitive advantage with growing ROIC, indicating effective capital use and innovation. | Declining ROIC trend indicates challenges in sustaining innovation and capital efficiency. |
| Global presence | Established global footprint with significant product variety across categories. | Focused more on North American markets, with smaller international segment revenue. |
| Market Share | Strong market position in snacks and cereals segments with growing profitability. | Solid market share in meat products but facing value erosion and declining profitability. |
Key takeaways: General Mills shows a durable competitive advantage with strong profitability and diversification, making it a value creator. Hormel Foods, despite good diversification and balance sheet strength, faces profitability challenges and declining capital efficiency, signaling caution for investors.
Risk Analysis
Below is a comparative table highlighting key risks for General Mills, Inc. (GIS) and Hormel Foods Corporation (HRL) based on the most recent data from 2025.
| Metric | General Mills, Inc. (GIS) | Hormel Foods Corporation (HRL) |
|---|---|---|
| Market Risk | Low beta (-0.068) indicating defensive stock, but price volatility risk exists with recent price decline | Moderate beta (0.324), somewhat sensitive to market fluctuations |
| Debt level | High debt-to-equity ratio (1.66), moderate debt-to-assets (46.25%) | Low debt-to-equity (0.36), low debt-to-assets (21.34%) indicating strong balance sheet |
| Regulatory Risk | Moderate, subject to food safety and labeling regulations globally | Moderate, similar regulatory environment as GIS in food industry |
| Operational Risk | Medium, diverse product portfolio and global operations could face supply chain disruptions | Medium, reliance on perishable products and international segments can affect operations |
| Environmental Risk | Moderate, exposure through agricultural supply chains and packaging sustainability | Moderate, similar exposure to environmental regulations and sustainability pressures |
| Geopolitical Risk | Moderate, global presence exposes company to trade tensions and tariffs | Moderate, international operations can be influenced by geopolitical events |
In synthesis, the most impactful risk for General Mills is its relatively high leverage, which could constrain financial flexibility despite favorable profitability metrics. Hormel Foods benefits from a stronger balance sheet but faces moderate market sensitivity and operational risks. Both companies operate in regulated, global food sectors where supply chain and geopolitical factors remain key concerns.
Which Stock to Choose?
General Mills, Inc. (GIS) shows a mixed income evolution with slight revenue decline recently but maintains favorable profitability margins and an overall strong rating of A-. Its debt levels are relatively high, reflected in some unfavorable leverage ratios, yet it demonstrates a very favorable economic moat with growing ROIC exceeding WACC.
Hormel Foods Corporation (HRL) presents an unfavorable income growth outlook with declining profitability metrics, though its financial ratios reflect stronger liquidity and lower debt levels. The company holds a solid B rating and a very unfavorable economic moat due to ROIC below WACC and a declining trend.
Investors prioritizing durable competitive advantages and profitability may find GIS’s strong moat and favorable ratings indicative of potential quality investing appeal. Conversely, those valuing financial stability and lower leverage might view HRL’s stronger liquidity and moderate rating as more aligned with risk-averse profiles, despite its weaker income growth.
Disclaimer: Investment carries a risk of loss of initial capital. The past performance is not a reliable indicator of future results. Be sure to understand risks before making an investment decision.
Go Further
I encourage you to read the complete analyses of General Mills, Inc. and Hormel Foods Corporation to enhance your investment decisions: