Home > Comparison > Industrials > GD vs TDG
The strategic rivalry between General Dynamics Corporation and TransDigm Group Incorporated shapes the aerospace and defense sector’s future. General Dynamics operates as a diversified industrial titan with broad aerospace, marine, and combat systems capabilities. In contrast, TransDigm focuses on high-margin, specialized aircraft components and power systems. This analysis pits industrial breadth against niche specialization to identify which trajectory offers superior risk-adjusted returns for a diversified portfolio.

Table of contents
Companies Overview
General Dynamics and TransDigm are key players shaping aerospace and defense markets with distinct operational footprints.
General Dynamics Corporation: Integrated Aerospace & Defense Powerhouse
General Dynamics commands a strong position in aerospace and defense through diverse segments including Aerospace, Marine Systems, Combat Systems, and Technologies. It generates revenue by designing and building business jets, nuclear submarines, combat vehicles, and advanced IT defense solutions. In 2026, its strategic focus centers on expanding technological innovations in AI, cloud computing, and unmanned systems to sustain competitive advantage.
TransDigm Group Incorporated: Specialist in Aircraft Components
TransDigm excels as a specialist in engineered aircraft components spanning mechanical actuators, cockpit systems, and safety restraints. Its revenue model relies heavily on supplying critical parts to airframe manufacturers, airlines, and military agencies. In 2026, TransDigm emphasizes portfolio expansion in power and control systems and non-aviation applications, enhancing its niche dominance in aerospace subsystems and specialized markets.
Strategic Collision: Similarities & Divergences
Both companies operate in aerospace and defense but diverge sharply in scope and approach. General Dynamics pursues an integrated, full-spectrum defense model, while TransDigm focuses on high-margin, niche components. Their primary battleground lies in defense industry supply chains, where scale meets specialization. Investors should note General Dynamics’ broad portfolio contrasts with TransDigm’s targeted growth, defining distinct risk and return profiles.
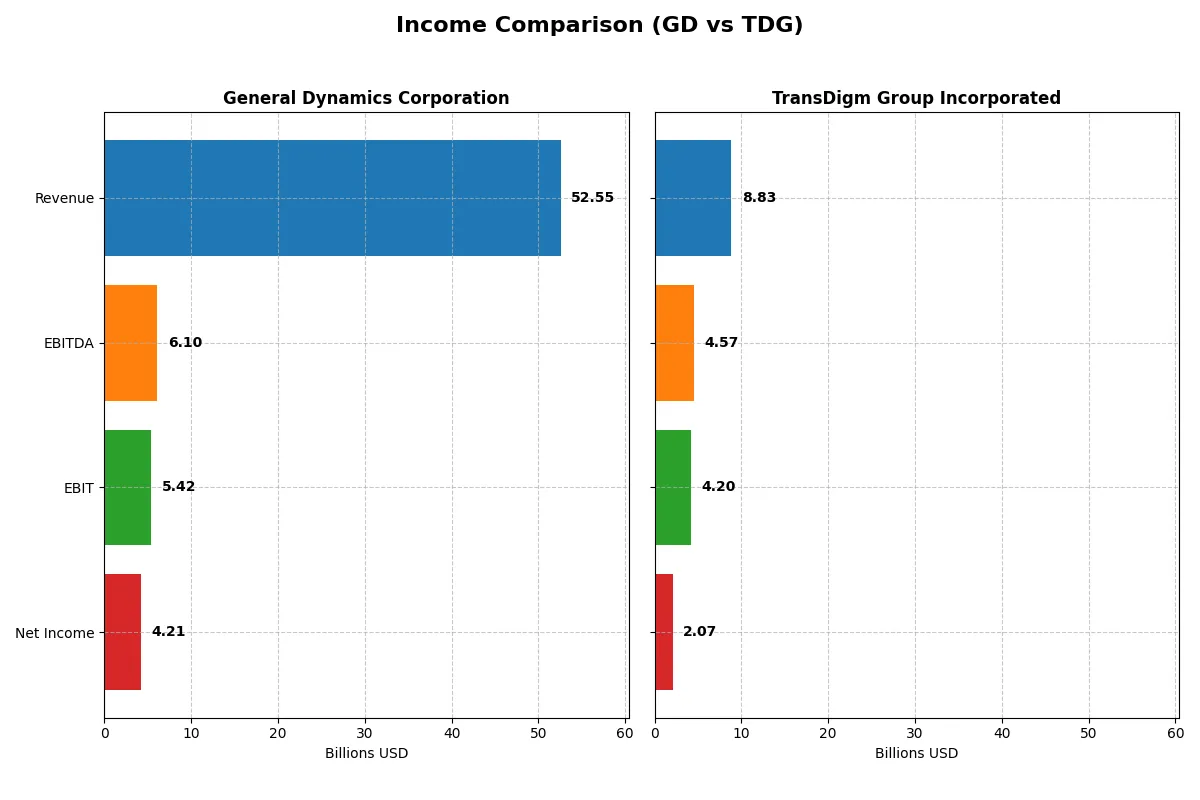
Income Statement Comparison
This table dissects the core profitability and scalability of both corporate engines to reveal who dominates the bottom line:
| Metric | General Dynamics Corporation (GD) | TransDigm Group Incorporated (TDG) |
|---|---|---|
| Revenue | 52.6B | 8.8B |
| Cost of Revenue | 44.6B | 3.5B |
| Operating Expenses | 2.6B | 1.1B |
| Gross Profit | 7.9B | 5.3B |
| EBITDA | 6.1B | 4.6B |
| EBIT | 5.4B | 4.2B |
| Interest Expense | 314M | 1.57B |
| Net Income | 4.2B | 1.9B |
| EPS | 15.64 | 32.08 |
| Fiscal Year | 2025 | 2025 |
Income Statement Analysis: The Bottom-Line Duel
This income statement comparison reveals the true operational efficiency and profitability dynamics of two major industry players.
General Dynamics Corporation Analysis
General Dynamics shows robust revenue growth, rising from $38.5B in 2021 to $52.5B in 2025, marking a 36.6% increase. Net income advances steadily to $4.2B in 2025. Gross margin remains stable around 15%, while net margin improves favorably to 8%. The company sustains strong EBIT margin growth, reflecting efficient cost control and operational momentum.
TransDigm Group Incorporated Analysis
TransDigm delivers impressive revenue growth, nearly doubling from $4.8B in 2021 to $8.8B in 2025—an 84% surge. Net income soars over 200% to $2.1B, with gross margin expanding significantly to 60%. EBIT margin hits a remarkable 47.6%, despite elevated interest expenses. Net margin climbs to 23.5%, indicating superior profitability and accelerating earnings per share.
Margin Power vs. Revenue Scale
TransDigm outpaces General Dynamics in margin expansion and net income growth, boasting industry-leading profitability ratios. General Dynamics leverages scale with solid revenue and consistent margin improvement but lags in margin dominance. For investors, TransDigm’s high-margin profile offers attractive earnings growth, while General Dynamics provides steady, scale-driven performance.
Financial Ratios Comparison
These vital ratios act as a diagnostic tool to expose the underlying fiscal health, valuation premiums, and capital efficiency of each company:
| Ratios | General Dynamics Corporation (GD) | TransDigm Group Incorporated (TDG) |
|---|---|---|
| ROE | 16.4% | -21.4% |
| ROIC | 10.7% | 15.2% |
| P/E | 21.6x | 37.0x |
| P/B | 3.55x | -7.92x |
| Current Ratio | 1.44 | 3.21 |
| Quick Ratio | 0.89 | 2.25 |
| D/E | 0.31 | -3.10 |
| Debt-to-Assets | 14.0% | 131.1% |
| Interest Coverage | 17.1x | 2.65x |
| Asset Turnover | 0.92 | 0.39 |
| Fixed Asset Turnover | 6.98 | 5.59 |
| Payout Ratio | 37.8% | 464% |
| Dividend Yield | 1.75% | 12.55% |
| Fiscal Year | 2025 | 2025 |
Efficiency & Valuation Duel: The Vital Signs
Financial ratios act as a company’s DNA, exposing hidden risks and highlighting operational strengths that shape investment decisions.
General Dynamics Corporation
General Dynamics shows a favorable ROE at 16.43% and solid ROIC at 10.66%, reflecting efficient capital use. Its P/E of 21.58 is neutral, indicating fair valuation. Dividend yield stands at 1.75%, rewarding shareholders modestly while maintaining a balanced reinvestment approach with no heavy R&D spend.
TransDigm Group Incorporated
TransDigm posts a strong net margin of 23.49% and impressive ROIC of 15.22%, yet suffers a negative ROE at -21.41%, signaling operational challenges. Its P/E of 36.99 appears stretched, reflecting high market expectations. A hefty 12.55% dividend yield compensates shareholders amid a complex capital structure with high debt-to-assets ratio.
Balanced Efficiency vs. High-Yield Risk
Both companies present slightly favorable metrics but differ markedly in risk profiles. General Dynamics offers steadier profitability and valuation balance. TransDigm delivers higher shareholder yield but struggles with leverage and return consistency. Investors seeking stability may favor General Dynamics, while those targeting yield might consider TransDigm’s riskier profile.
Which one offers the Superior Shareholder Reward?
I compare General Dynamics (GD) and TransDigm Group (TDG) by their dividend yields, payout ratios, and share buybacks. GD pays a steady 1.75–2.25% dividend yield with a payout ratio around 38–43%, supported by free cash flow coverage near 77–80%. TDG’s dividend yield is highly volatile, spiking to 12.55% in 2025 but with an unsustainable payout ratio exceeding 460% that year. GD maintains a disciplined share repurchase program complementing dividends for shareholder returns. TDG’s buyback activity is less clear, but its massive debt levels and negative equity raise sustainability concerns. GD’s balanced, cash-covered dividends plus buybacks offer a more reliable total return profile. I conclude GD provides superior, sustainable shareholder reward in 2026.
Comparative Score Analysis: The Strategic Profile
The radar chart reveals the fundamental DNA and trade-offs of General Dynamics Corporation and TransDigm Group Incorporated, highlighting their core strengths and vulnerabilities:
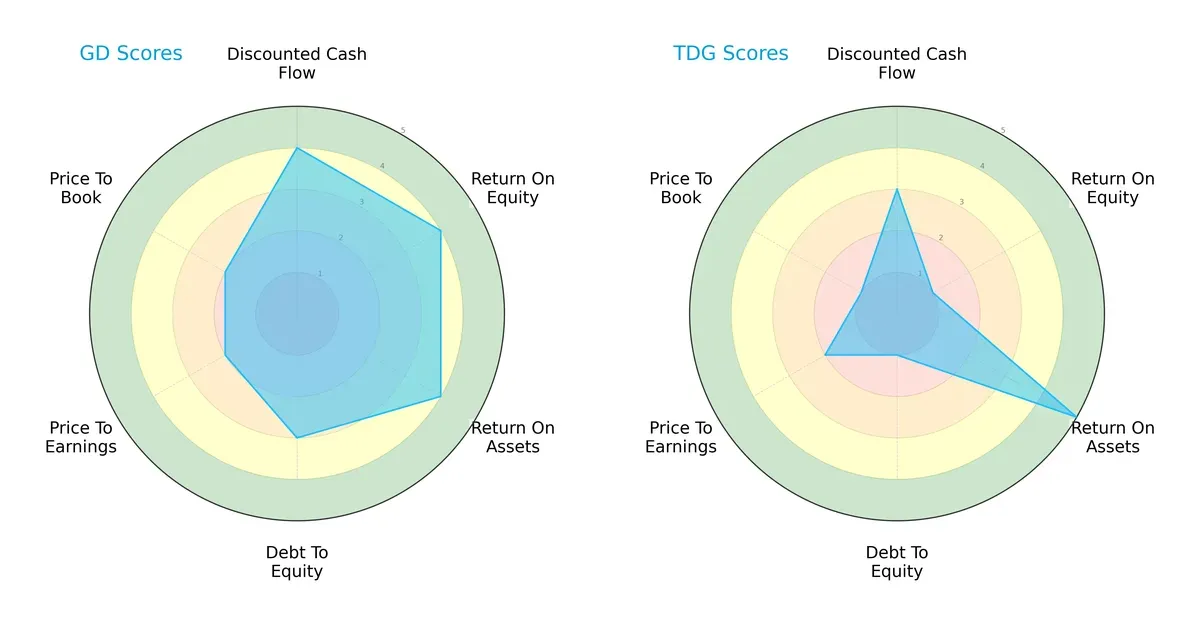
General Dynamics shows a balanced profile with favorable scores in DCF (4), ROE (4), and ROA (4), reflecting efficient capital use and profitability. TransDigm excels in ROA (5) but suffers from weak ROE (1) and debt-to-equity (1) scores, indicating financial leverage risks. GD’s moderate valuation scores (PE/PB at 2) contrast with TDG’s lower valuation appeal, signaling GD’s more stable investment foundation.
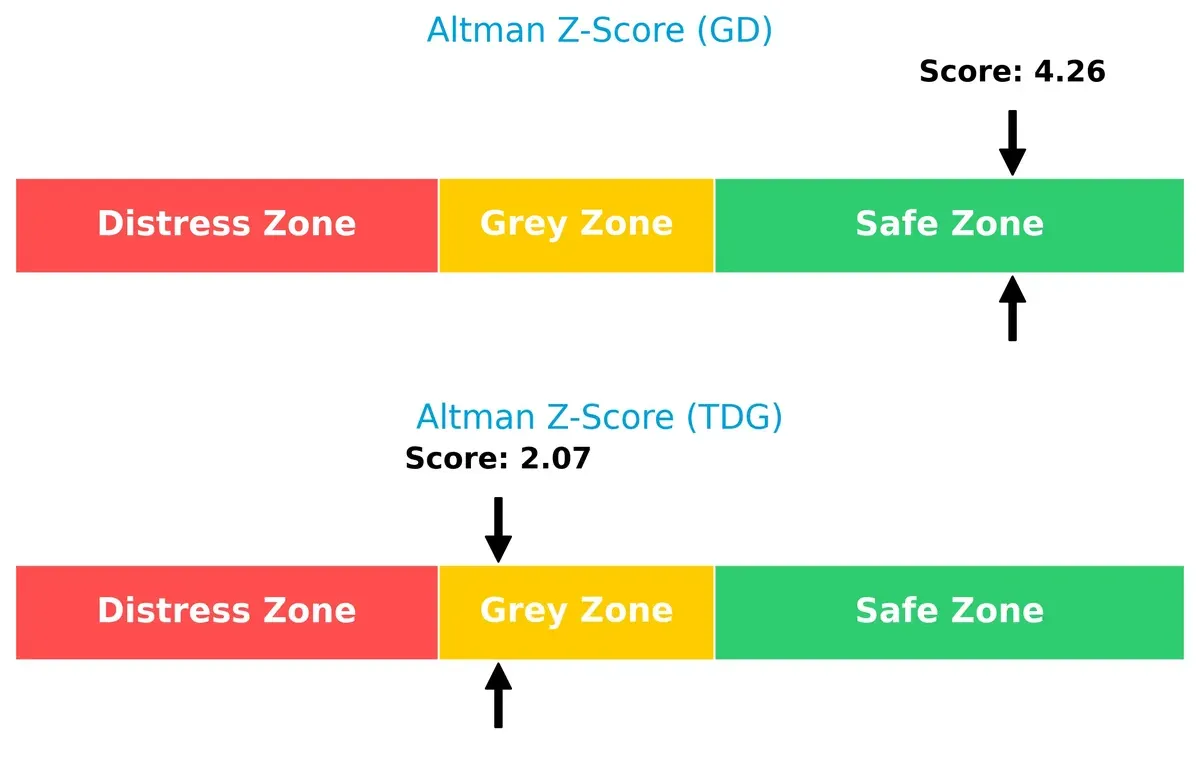
Bankruptcy Risk: Solvency Showdown
General Dynamics’ Altman Z-Score of 4.26 signals a robust financial position well within the safe zone. TransDigm’s score of 2.07 places it in the grey zone, implying moderate bankruptcy risk and caution for long-term investors:
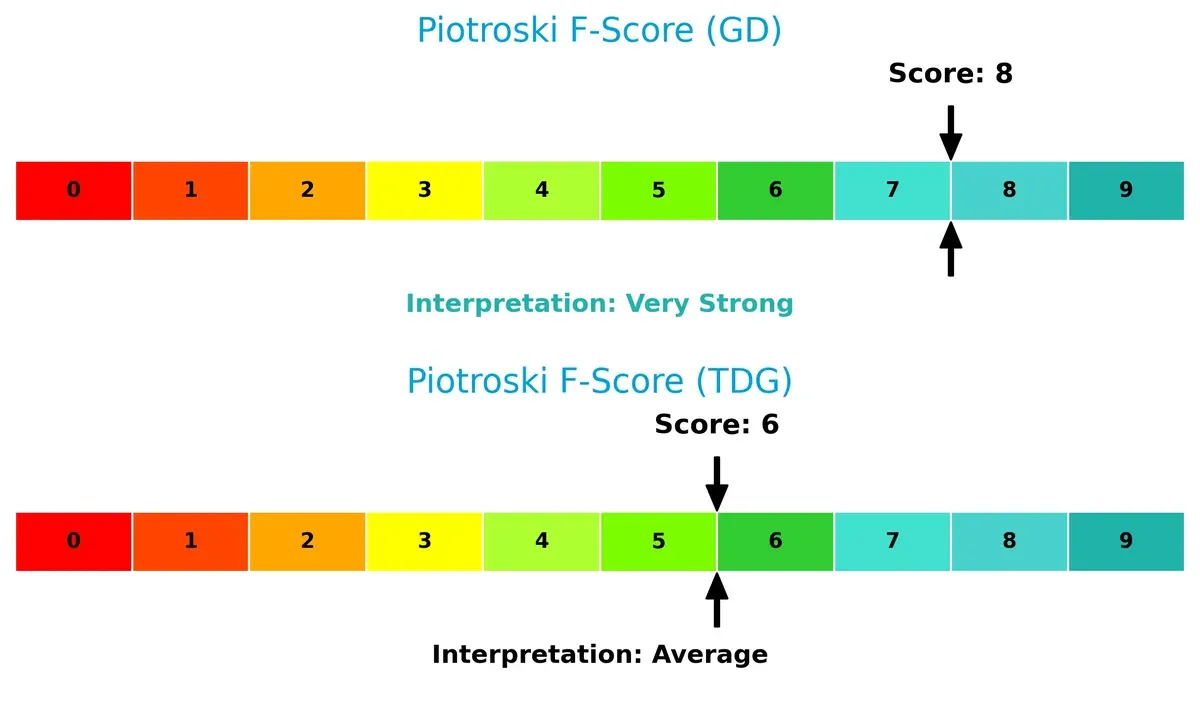
Financial Health: Quality of Operations
General Dynamics scores an 8 on the Piotroski F-Score, indicating very strong financial health with solid profitability and operational efficiency. TransDigm’s 6 suggests average health, with some internal metrics raising red flags compared to GD’s superior score:
How are the two companies positioned?
This section dissects the operational DNA of GD and TDG by comparing revenue distribution across segments and analyzing their internal strengths and weaknesses. The goal is to confront their economic moats and identify which business model offers the most resilient competitive advantage today.
Revenue Segmentation: The Strategic Mix
This visual comparison dissects how General Dynamics and TransDigm diversify their income streams and reveals where their primary sector bets lie:

General Dynamics displays a balanced portfolio with Marine Systems leading at $16.7B, closely followed by Technologies and Aerospace segments around $13B. TransDigm pivots heavily on Power and Control ($4.56B) and Airframe ($4.11B), showing less diversification and a reliance on aviation components. GD’s broader mix reduces concentration risk, while TDG’s focus signals strong ecosystem lock-in but potential vulnerability to aerospace cycle fluctuations.
Strengths and Weaknesses Comparison
This table compares the Strengths and Weaknesses of General Dynamics Corporation (GD) and TransDigm Group Incorporated (TDG):
GD Strengths
- Diversified revenue across Aerospace, Combat, Marine, and Technologies
- Favorable ROE 16.43% and ROIC 10.66% above WACC 5.55%
- Strong interest coverage at 17.25
- Global presence with significant North America and Europe sales
TDG Strengths
- High net margin at 23.49% and favorable ROIC 15.22%
- Strong quick ratio 2.25 indicating liquidity
- Favorable PB ratio despite unusual negative value
- Dividend yield at 12.55% supports income investors
GD Weaknesses
- Moderate net margin at 8.01% and neutral current ratio 1.44
- Unfavorable PB ratio at 3.55 suggests valuation premium
- Asset turnover neutral at 0.92 limits operational efficiency
TDG Weaknesses
- Negative ROE at -21.41% indicates profitability issues
- High debt to assets 131.08% signals leverage risk
- Low asset turnover 0.39 shows operational inefficiency
- Unfavorable PE ratio 36.99 may imply overvaluation
Both companies display slightly favorable overall financial ratios but diverge in operational efficiency and leverage. GD’s diversified business and strong coverage ratios support stability, while TDG’s high margins contrast with leverage and profitability challenges. These differences shape each company’s strategic priorities.
The Moat Duel: Analyzing Competitive Defensibility
A structural moat is the only true shield preserving long-term profits from relentless competitive erosion in aerospace and defense firms:
General Dynamics Corporation: Diversified Defense Moat
I see GD’s moat rooted in broad product diversification and government contracts. This manifests in stable ROIC above WACC at +5.1%, with gradual improvement. New tech in unmanned systems could deepen its moat in 2026.
TransDigm Group Incorporated: Niche Component Pricing Power
TDG’s moat stems from unique, high-margin aerospace components with strong pricing power. Its ROIC outpaces GD at +8.1% and grows faster. Expansion into adjacent markets may further strengthen its specialized moat.
Industrial Scale vs. Focused Pricing Power
TDG boasts a deeper, more rapidly growing moat than GD, fueled by superior margin expansion and ROIC growth. While GD’s diversified portfolio offers resilience, TDG is better equipped to defend and expand niche market share.
Which stock offers better returns?
The past year shows distinct bullish trends for both stocks, with General Dynamics accelerating steadily and TransDigm demonstrating stronger recent momentum.
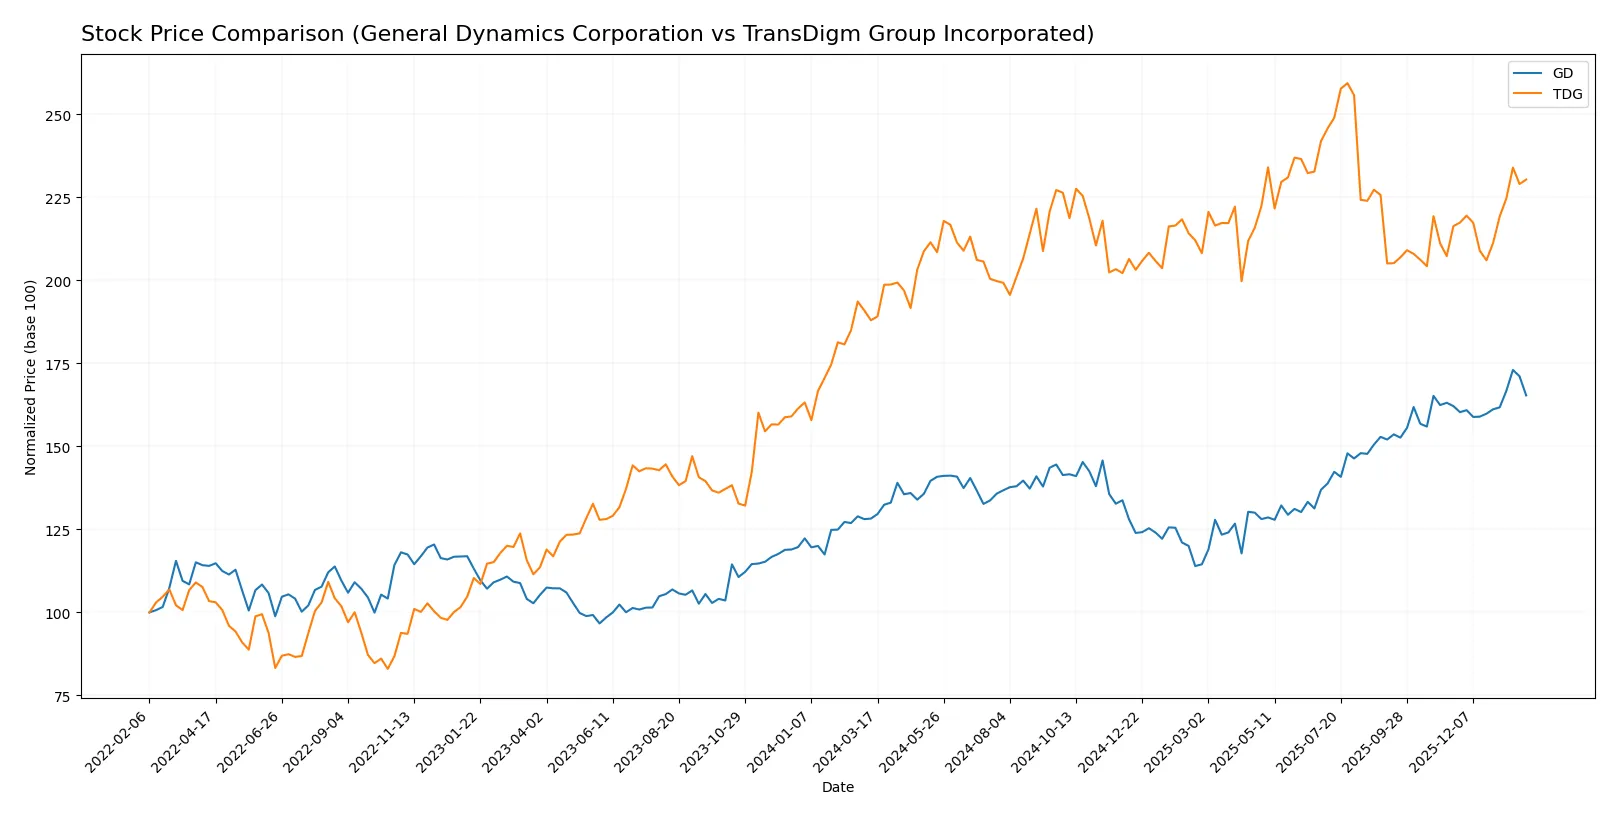
Trend Comparison
General Dynamics Corporation (GD) rose 28.93% over the past 12 months, marking a bullish trend with accelerating gains and a high price of 367.38. Volatility is moderate with a 28.77 standard deviation.
TransDigm Group Incorporated (TDG) gained 22.54% over the same period, also bullish with acceleration. It shows higher volatility, reflected in an 87.29 standard deviation and a peak at 1607.45.
GD’s overall return surpasses TDG’s by 6.39 percentage points, though TDG shows stronger recent price momentum. GD delivered the highest market performance this period.
Target Prices
Analysts set a bullish consensus for both General Dynamics and TransDigm Group, signaling upside potential.
| Company | Target Low | Target High | Consensus |
|---|---|---|---|
| General Dynamics Corporation | 385 | 444 | 404.22 |
| TransDigm Group Incorporated | 1370 | 1871 | 1601.5 |
General Dynamics trades at $351.09, well below its $404 consensus, indicating room for appreciation. TransDigm’s $1427.54 price also lags behind the $1601.5 consensus, suggesting positive analyst expectations.

Don’t Let Luck Decide Your Entry Point
Optimize your entry points with our advanced ProRealTime indicators. You’ll get efficient buy signals with precise price targets for maximum performance. Start outperforming now!
How do institutions grade them?
General Dynamics Corporation Grades
The table below summarizes recent grades from major grading companies for GD.
| Grading Company | Action | New Grade | Date |
|---|---|---|---|
| B of A Securities | maintain | Buy | 2026-01-30 |
| UBS | maintain | Neutral | 2026-01-15 |
| Citigroup | maintain | Neutral | 2026-01-13 |
| JP Morgan | maintain | Overweight | 2025-12-19 |
| Morgan Stanley | upgrade | Overweight | 2025-12-16 |
| JP Morgan | maintain | Overweight | 2025-10-28 |
| B of A Securities | maintain | Buy | 2025-10-28 |
| Bernstein | maintain | Market Perform | 2025-10-28 |
| JP Morgan | maintain | Overweight | 2025-10-27 |
| Susquehanna | maintain | Positive | 2025-10-27 |
TransDigm Group Incorporated Grades
Below is a summary of recent grades from recognized grading companies for TDG.
| Grading Company | Action | New Grade | Date |
|---|---|---|---|
| UBS | maintain | Buy | 2026-01-15 |
| JP Morgan | maintain | Neutral | 2025-11-14 |
| Morgan Stanley | maintain | Overweight | 2025-11-14 |
| RBC Capital | maintain | Sector Perform | 2025-11-13 |
| UBS | maintain | Buy | 2025-11-13 |
| BMO Capital | maintain | Outperform | 2025-11-13 |
| Stifel | maintain | Buy | 2025-11-13 |
| Truist Securities | maintain | Buy | 2025-10-15 |
| Morgan Stanley | maintain | Overweight | 2025-10-15 |
| Susquehanna | maintain | Neutral | 2025-10-09 |
Which company has the best grades?
General Dynamics receives more consistent overweight and buy ratings from top firms, reflecting moderate optimism. TransDigm shows a broader range including outperform and buy ratings but also neutral and sector perform grades, indicating mixed views. Investors may perceive GD as more uniformly favored, while TDG has varied institutional sentiment.
Risks specific to each company
The following categories identify critical pressure points and systemic threats facing General Dynamics Corporation and TransDigm Group Incorporated in the 2026 market environment:
1. Market & Competition
General Dynamics Corporation
- Diversified aerospace and defense segments reduce dependency on a single market.
TransDigm Group Incorporated
- Niche aircraft components focus limits market breadth but strengthens specialty positioning.
2. Capital Structure & Debt
General Dynamics Corporation
- Strong debt metrics with low debt-to-equity (0.31) and interest coverage (17.25) indicate financial stability.
TransDigm Group Incorporated
- High debt-to-assets (131%) and negative debt-to-equity ratios signal elevated leverage risk.
3. Stock Volatility
General Dynamics Corporation
- Low beta (0.41) suggests lower stock volatility and defensive characteristics.
TransDigm Group Incorporated
- Higher beta (0.92) implies greater sensitivity to market swings and risk.
4. Regulatory & Legal
General Dynamics Corporation
- Exposure to US defense contracts subjects it to stringent regulatory scrutiny and budget risks.
TransDigm Group Incorporated
- Dependence on government and third-party suppliers entails regulatory compliance and contract risk.
5. Supply Chain & Operations
General Dynamics Corporation
- Complex manufacturing of military platforms requires robust supply chain resilience.
TransDigm Group Incorporated
- Specialized components’ production vulnerable to supplier disruptions and concentration risks.
6. ESG & Climate Transition
General Dynamics Corporation
- Large-scale defense manufacturing faces increasing pressure to reduce carbon footprint.
TransDigm Group Incorporated
- Component manufacturing must adapt to sustainability demands amid rising ESG investor focus.
7. Geopolitical Exposure
General Dynamics Corporation
- Heavy reliance on US government contracts exposes it to geopolitical shifts and defense budget changes.
TransDigm Group Incorporated
- Global supplier and customer base increases exposure to international trade tensions and sanctions.
Which company shows a better risk-adjusted profile?
General Dynamics faces its biggest risk from geopolitical and regulatory dependencies but benefits from stable capital structure and lower stock volatility. TransDigm’s highest risk arises from excessive leverage and operational supply chain vulnerabilities. GD’s Altman Z-Score of 4.26 and strong Piotroski score reflect financial robustness, whereas TDG’s borderline Z-Score (2.07) and moderate Piotroski score highlight financial fragility. Overall, GD demonstrates a better risk-adjusted profile due to superior balance sheet strength and lower market volatility.
Final Verdict: Which stock to choose?
General Dynamics excels as a cash-generating powerhouse with a durable moat, evidenced by steadily growing returns on invested capital. Its strong balance sheet and operational efficiency stand out. The main point of vigilance remains its moderate valuation multiples, which could limit near-term upside. It suits portfolios focused on stable, long-term growth.
TransDigm commands a strategic moat through exceptional pricing power and high-margin aerospace components, driving superior profitability and revenue growth. However, its elevated leverage and volatile equity returns introduce financial risk. Compared to General Dynamics, it offers higher growth potential but less safety. It fits well with GARP portfolios seeking growth balanced by valuation awareness.
If you prioritize steady value creation and financial resilience, General Dynamics is the compelling choice due to its consistent profitability and conservative capital structure. However, if you seek aggressive growth backed by a strong moat and can tolerate higher leverage, TransDigm offers superior expansion potential despite heightened risk. Both present analytical scenarios suited to distinct investor profiles.
Disclaimer: Investment carries a risk of loss of initial capital. The past performance is not a reliable indicator of future results. Be sure to understand risks before making an investment decision.
Go Further
I encourage you to read the complete analyses of General Dynamics Corporation and TransDigm Group Incorporated to enhance your investment decisions: