Home > Comparison > Industrials > BA vs GD
The strategic rivalry between The Boeing Company and General Dynamics Corporation shapes the aerospace and defense sector’s future. Boeing operates as a diversified industrial giant, spanning commercial jetliners and space systems. General Dynamics focuses on specialized defense platforms and advanced technologies with a strong emphasis on naval and combat systems. This analysis evaluates which firm’s operational model and capital allocation strategy offer superior risk-adjusted returns for a diversified portfolio in 2026.
Table of contents
Companies Overview
The Boeing Company and General Dynamics Corporation stand as titans in aerospace and defense, shaping global security and innovation.
The Boeing Company: Aerospace & Defense Powerhouse
Boeing dominates as a leading aerospace and defense manufacturer, generating revenue from commercial jetliners, military aircraft, satellites, and space systems. Its 2026 strategy sharpens focus on expanding global services, including logistics, maintenance, and digital analytics, alongside maintaining strong commercial and defense production lines.
General Dynamics Corporation: Diversified Defense Innovator
General Dynamics commands a diverse defense portfolio spanning aerospace, marine systems, combat vehicles, and advanced technologies. Its revenue engine includes business jets, nuclear submarines, land combat vehicles, and IT solutions. In 2026, the company prioritizes modernization programs and cutting-edge tech like AI, cloud computing, and unmanned systems to bolster defense capabilities.
Strategic Collision: Similarities & Divergences
Boeing and General Dynamics share a commitment to defense innovation but differ in scope—Boeing leans on commercial aviation and integrated services, while General Dynamics emphasizes diversified military hardware and tech solutions. Their primary battleground is defense modernization and technological edge. Investors face contrasting profiles: Boeing’s scale and commercial exposure versus General Dynamics’ focused defense specialization.
Income Statement Comparison
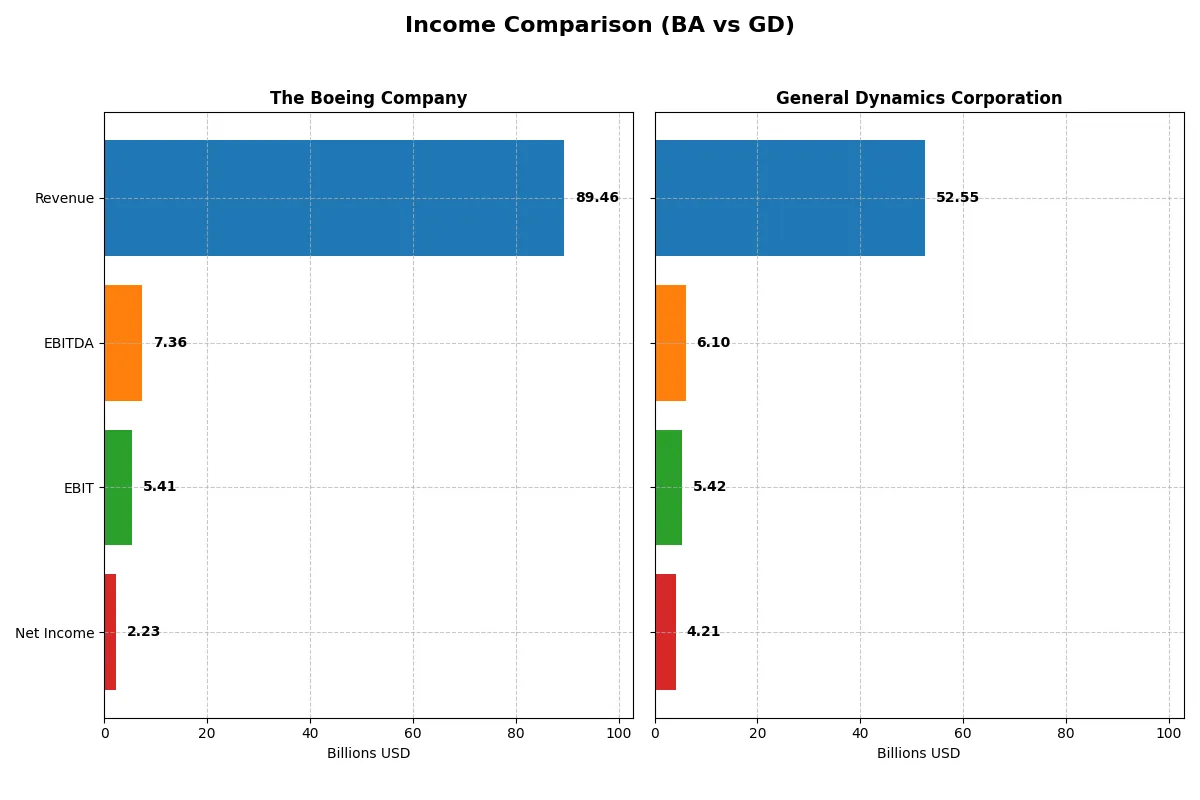
This data dissects the core profitability and scalability of both corporate engines to reveal who dominates the bottom line:
| Metric | The Boeing Company (BA) | General Dynamics Corporation (GD) |
|---|---|---|
| Revenue | 89.5B | 52.6B |
| Cost of Revenue | 85.2B | 44.6B |
| Operating Expenses | 9.7B | 2.6B |
| Gross Profit | 4.3B | 7.9B |
| EBITDA | 7.4B | 6.1B |
| EBIT | 5.4B | 5.4B |
| Interest Expense | 2.8B | 314M |
| Net Income | 2.2B | 4.2B |
| EPS | 2.49 | 15.64 |
| Fiscal Year | 2025 | 2025 |
Income Statement Analysis: The Bottom-Line Duel
This income statement comparison reveals which company runs a more efficient and profitable corporate engine in 2025.
The Boeing Company Analysis
Boeing’s revenue surged 34.5% in 2025 to 89.5B after a steep recovery from prior losses. Net income turned positive at 2.2B, reversing a 11.8B loss in 2024. Gross margin improved to a modest 4.8%, and net margin rose to 2.5%, signaling a cautious return to profitability with strong momentum.
General Dynamics Corporation Analysis
General Dynamics grew revenue steadily by 10.1% to 52.6B in 2025, maintaining consistent gross margins near 15.1%. Net income increased by 11.3% to 4.2B, delivering an 8.0% net margin. The company displays solid margin control and stable earnings growth, highlighting operational efficiency and resilience.
Margin Power vs. Recovery Momentum
General Dynamics leads with superior margins and reliable profit growth, delivering a 8.0% net margin versus Boeing’s 2.5%. However, Boeing shows a remarkable turnaround with a 34.5% revenue jump and positive net income after heavy losses. Investors favor General Dynamics for steady margin strength, while Boeing appeals for its high-growth recovery profile.
Financial Ratios Comparison
These vital ratios act as a diagnostic tool to expose the underlying fiscal health, valuation premiums, and capital efficiency of the companies compared below:
| Ratios | Boeing (BA) | General Dynamics (GD) |
|---|---|---|
| ROE | 41.0% | 16.4% |
| ROIC | -6.7% | 10.7% |
| P/E | 74.1 | 21.6 |
| P/B | 30.3 | 3.55 |
| Current Ratio | 1.27 | 1.44 |
| Quick Ratio | 0.49 | 0.89 |
| D/E (Debt-to-Equity) | 9.92 | 0.31 |
| Debt-to-Assets | 32.2% | 14.0% |
| Interest Coverage | -1.95 | 17.1 |
| Asset Turnover | 0.53 | 0.92 |
| Fixed Asset Turnover | 5.73 | 6.98 |
| Payout ratio | 14.8% | 37.8% |
| Dividend yield | 0.20% | 1.75% |
| Fiscal Year | 2025 | 2025 |
Efficiency & Valuation Duel: The Vital Signs
Financial ratios act as the company’s DNA, revealing hidden risks and operational excellence essential for informed investment decisions.
The Boeing Company
Boeing posts an impressive 41% ROE, signaling strong shareholder profitability despite a weak 2.5% net margin. However, its valuation stretches high with a P/E of 74 and P/B of 30, reflecting an expensive stock. Dividend yield is minimal at 0.2%, indicating limited direct shareholder returns and a focus on reinvestment in R&D and growth initiatives.
General Dynamics Corporation
General Dynamics delivers a solid 16% ROE and a healthier 8% net margin, showcasing operational efficiency. Its valuation is moderate, with a P/E of 21.6, suggesting a fairly priced stock. The company offers a 1.75% dividend yield, balancing shareholder returns with a stable capital allocation strategy and controlled leverage.
Premium Valuation vs. Operational Safety
General Dynamics offers a better balance of risk and reward with favorable profitability, solid free cash flow, and moderate valuation. Boeing’s high valuation and weak core returns increase risk. Investors seeking stability may prefer General Dynamics, while those betting on growth face greater uncertainty with Boeing.
Which one offers the Superior Shareholder Reward?
I see General Dynamics delivers a stronger shareholder reward than Boeing in 2026. GD pays a 1.75% dividend yield with a 38% payout ratio, well-covered by stable free cash flow of 15B+. Boeing yields just 0.2%, with a low 15% payout but negative free cash flow of -2.5B, signaling distribution risk. GD’s buyback program complements dividends robustly, enhancing total returns. Boeing’s negative FCF and high leverage raise red flags for sustainable returns. I conclude GD offers a superior total return profile, balancing steady income and capital return in a turbulent aerospace-defense cycle.
Comparative Score Analysis: The Strategic Profile
The radar chart reveals the fundamental DNA and trade-offs of The Boeing Company and General Dynamics Corporation:
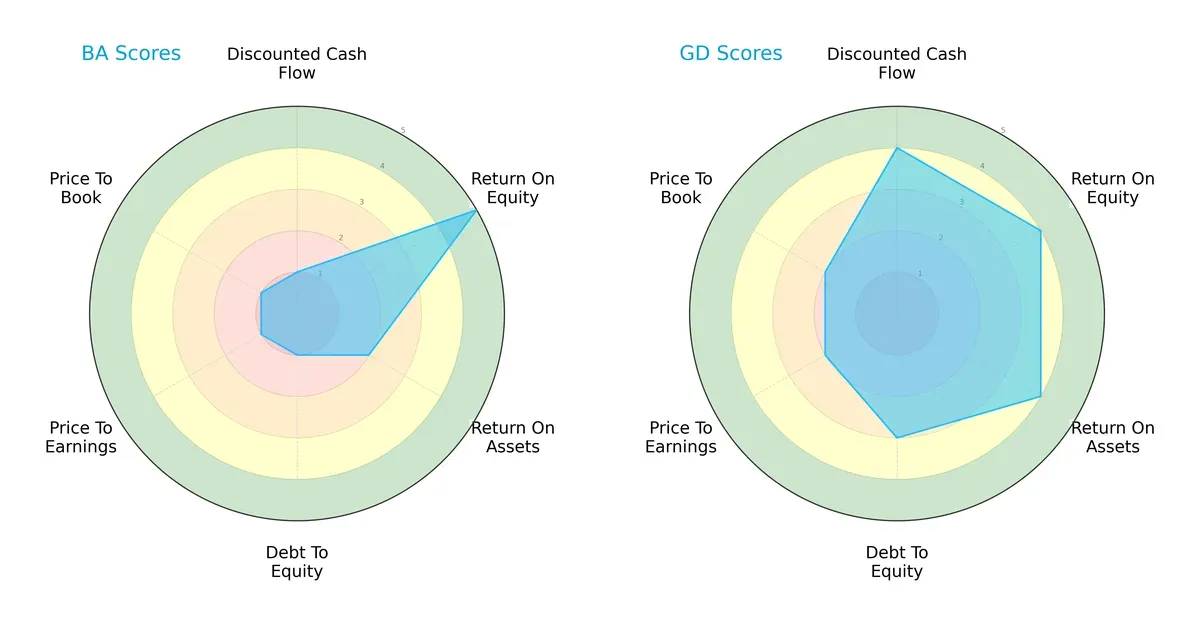
General Dynamics displays a more balanced profile with strong DCF (4) and solid ROA (4) plus ROE (4) scores. Boeing relies heavily on its ROE strength (5) but suffers from weak cash flow (1) and debt management (1). Valuation metrics favor neither, but Boeing’s low scores signal caution. Overall, General Dynamics executes a steadier capital allocation strategy.
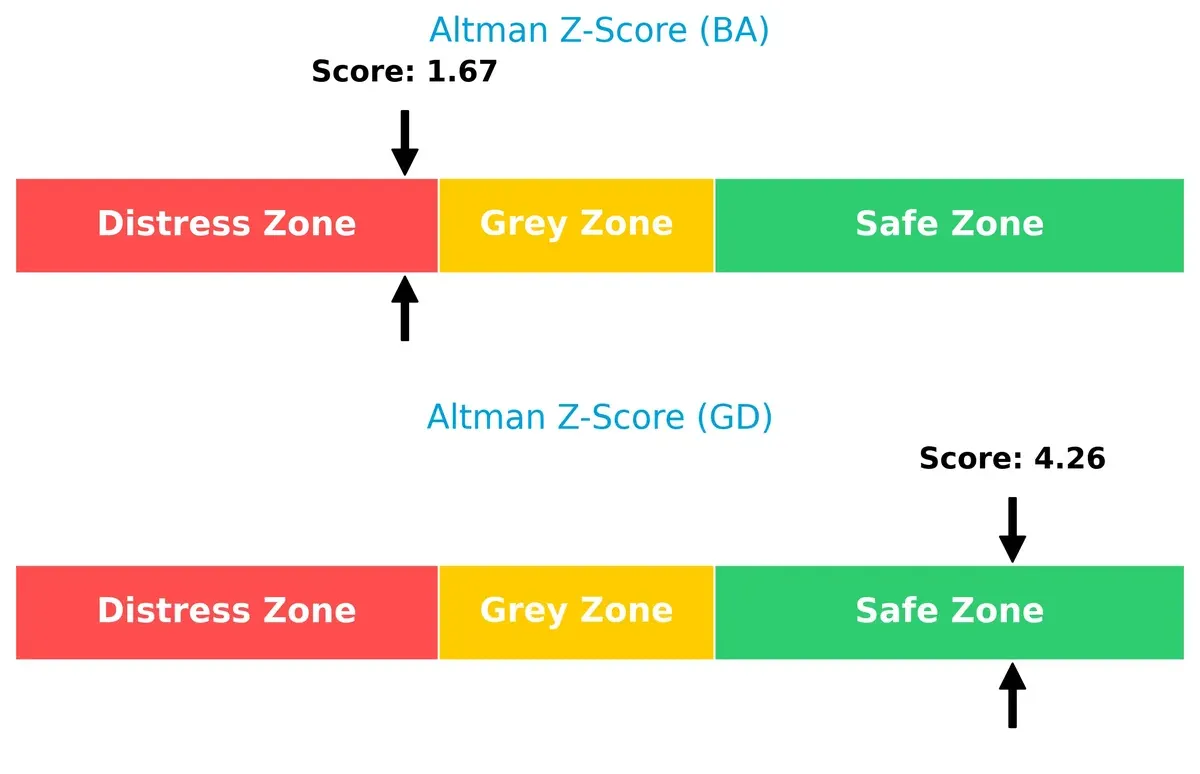
Bankruptcy Risk: Solvency Showdown
The Altman Z-Score gap signals divergent bankruptcy risks: Boeing’s 1.67 score places it in distress, risking long-term survival, while General Dynamics’ 4.26 signals strong financial safety and resilience:
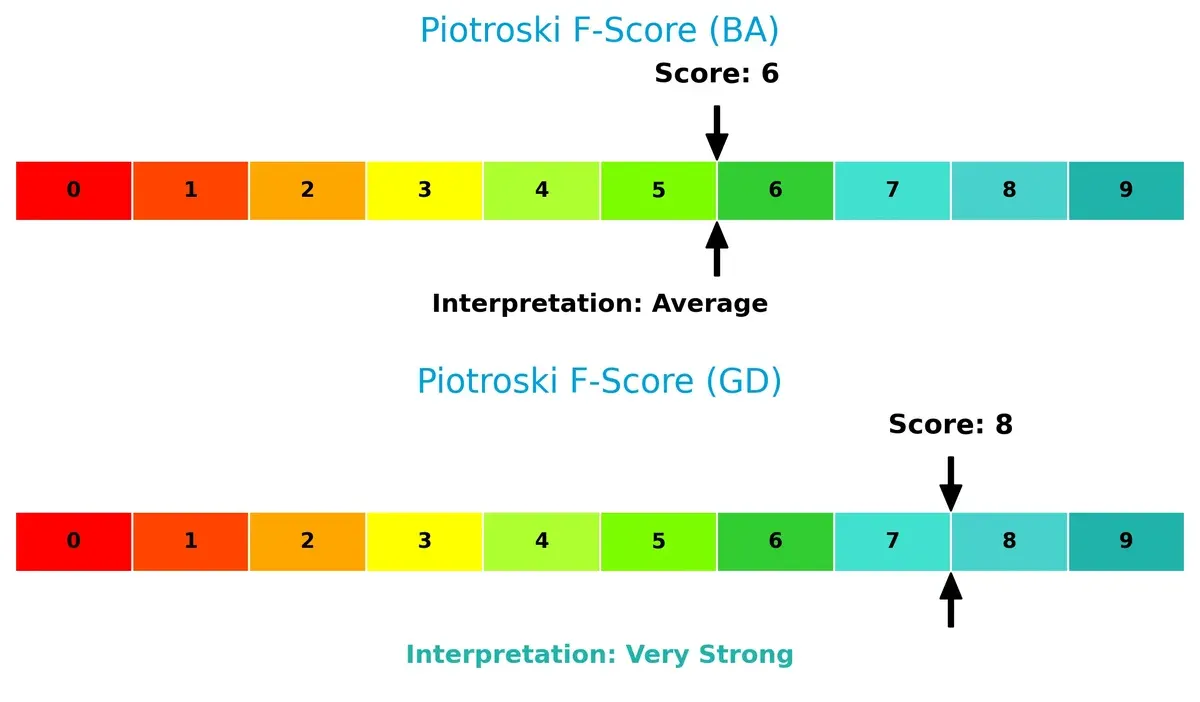
Financial Health: Quality of Operations
General Dynamics posts a very strong Piotroski F-Score of 8, reflecting robust profitability and operational efficiency. Boeing’s 6 score is average and may hide internal weaknesses relative to its peer:
How are the two companies positioned?
This section dissects BA and GD’s operational DNA by comparing revenue distribution and internal strengths and weaknesses. The goal is to confront their economic moats and identify which model offers the most resilient, sustainable competitive advantage today.
Revenue Segmentation: The Strategic Mix
This visual comparison dissects how The Boeing Company and General Dynamics diversify their income streams and where their primary sector bets lie:
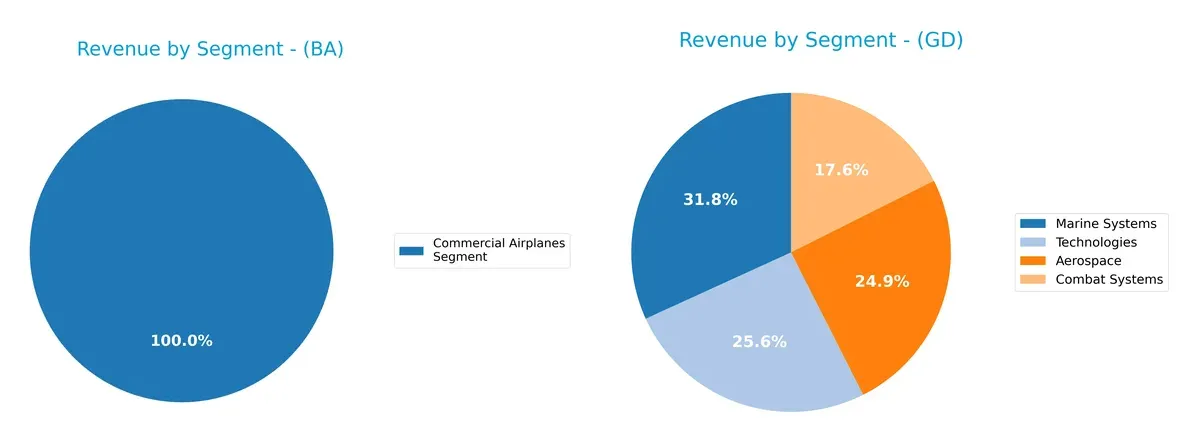
Boeing pivots around three major segments, with Commercial Airplanes at $41.5B, Defense at $23.9B, and Global Services near $20B, showing moderate diversification. General Dynamics displays a more balanced mix across Aerospace ($13.1B), Marine Systems ($16.7B), Technologies ($13.5B), and Combat Systems ($9.2B), reducing concentration risk. Boeing’s reliance on aerospace manufacturing dwarfs General Dynamics’ broader defense and technology ecosystem, signaling different strategic footholds and risk profiles.
Strengths and Weaknesses Comparison
This table compares the Strengths and Weaknesses of BA and GD:
BA Strengths
- Large U.S. and Non-U.S. revenue base with strong presence in Asia and Europe
- Diversified segments: Commercial Airplanes, Defense, and Global Services
- High ROE at 40.98% supported by efficient fixed asset turnover
GD Strengths
- Diversified segments across Aerospace, Combat Systems, Marine, and Technologies
- Strong profitability with favorable ROIC of 10.66% and WACC of 5.55%
- Solid financial health with low debt-to-equity and high interest coverage
BA Weaknesses
- Unfavorable net margin at 2.5% and negative ROIC at -6.71%
- Elevated valuation multiples (PE 74.05, PB 30.35) indicating potential overvaluation
- Weak liquidity ratios and high debt-to-equity at 9.92
GD Weaknesses
- PB ratio unfavorable at 3.55 despite solid fundamentals
- Net margin neutral at 8.01%, leaving room for improvement
- Moderate current and quick ratios signaling average short-term liquidity
BA’s scale and segment diversity contrast with GD’s stronger profitability and financial stability. However, BA’s valuation and returns metrics pose concerns, while GD’s valuation and margin levels suggest cautious optimism for operational efficiency.
The Moat Duel: Analyzing Competitive Defensibility
A structural moat is the only true shield protecting long-term profits from relentless competitive erosion. Let’s dissect two aerospace giants’ moats:
The Boeing Company: Intangible Assets and Scale Dominance
Boeing’s moat stems from massive scale, decades of government contracts, and proprietary aerospace technology. Despite a neutral margin profile, declining ROIC signals weakening capital efficiency. New commercial and defense projects in 2026 may strain or rebuild this advantage.
General Dynamics Corporation: Operational Excellence and Value Creation
General Dynamics leverages operational excellence and diversified defense segments to sustain a very favorable moat. Its ROIC outpaces WACC with a positive growth trend, reflecting efficient capital allocation. Expansion in advanced technologies and naval systems should deepen its competitive edge.
Moat Strength Showdown: Scale & Innovation vs. Operational Efficiency
General Dynamics holds the deeper moat, evidenced by consistent value creation and improving ROIC. Boeing’s declining profitability and capital inefficiency weaken its defenses. GD is better positioned to protect and grow market share amid evolving aerospace and defense demands.
Which stock offers better returns?
The past year shows distinct price dynamics: Boeing’s shares climbed steadily with accelerating gains, while General Dynamics posted stronger overall growth but slowed recently.
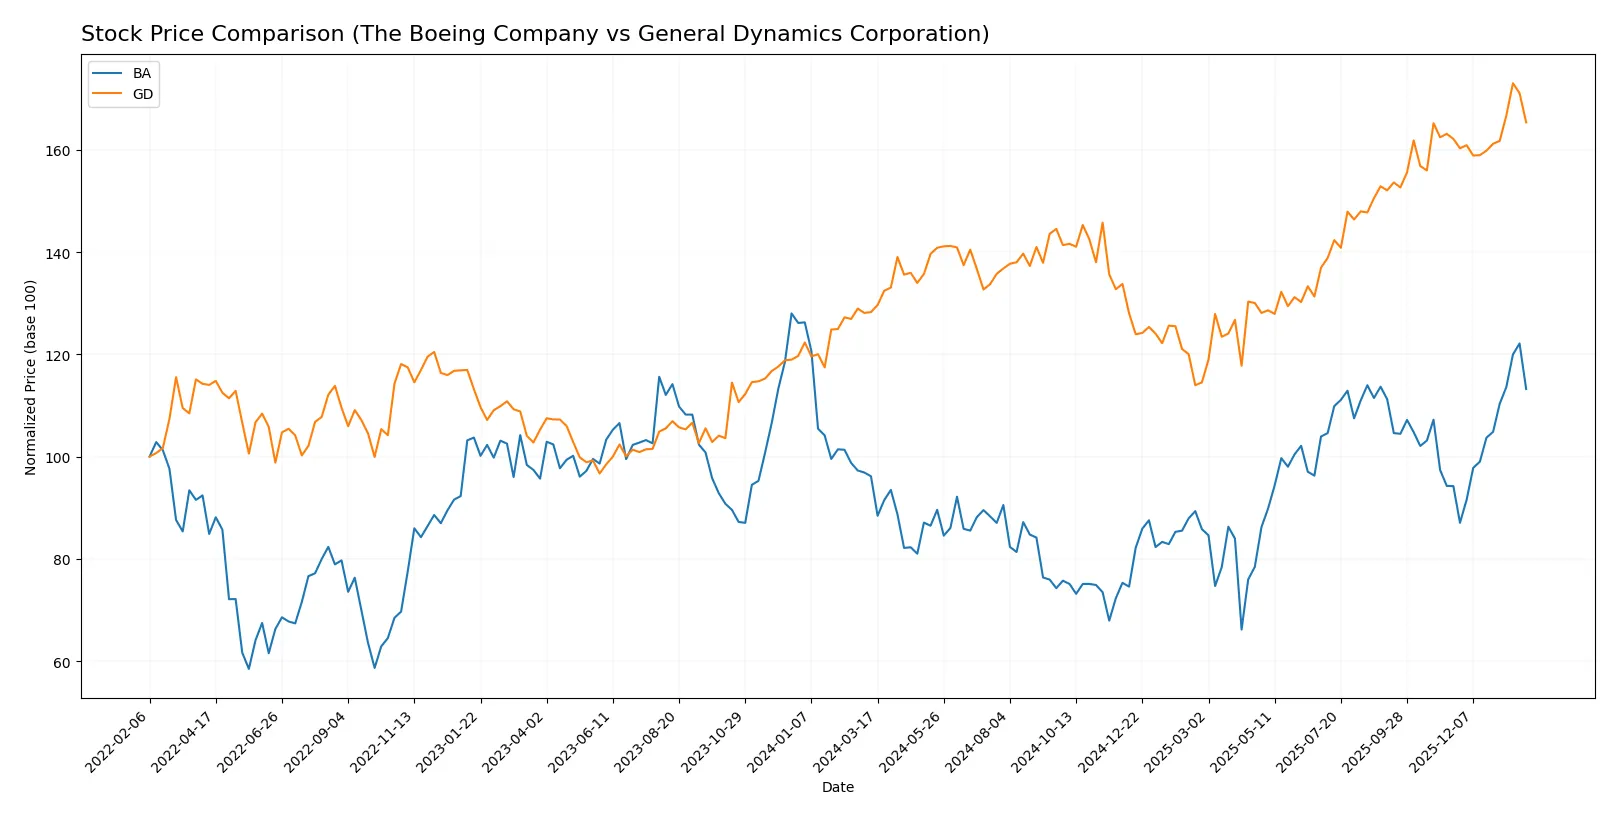
Trend Comparison
The Boeing Company’s stock rose 17.75% over the last 12 months, marking a bullish trend with accelerating momentum and a high volatility of 26.41. It ranged between 136.59 and 252.15.
General Dynamics Corporation’s shares gained 28.93% in the same period, also bullish with acceleration. Volatility was slightly higher at 28.77, with prices between 241.94 and 367.38. Recent gains slowed to 1.99%.
General Dynamics delivered higher total returns but with decelerating momentum, while Boeing showed strong recent acceleration, suggesting differing trend dynamics despite both being bullish.
Target Prices
Analysts present a clear consensus on target prices for The Boeing Company and General Dynamics Corporation.
| Company | Target Low | Target High | Consensus |
|---|---|---|---|
| The Boeing Company | 150 | 298 | 256.73 |
| General Dynamics Corporation | 390 | 444 | 406.63 |
The Boeing’s target consensus of 257 exceeds the current price of 234, signaling moderate upside potential. General Dynamics shows stronger upside, with consensus targets well above its 351 price.

Don’t Let Luck Decide Your Entry Point
Optimize your entry points with our advanced ProRealTime indicators. You’ll get efficient buy signals with precise price targets for maximum performance. Start outperforming now!
How do institutions grade them?
The following tables summarize recent institutional grades for The Boeing Company and General Dynamics Corporation:
The Boeing Company Grades
This table shows recent grade actions from major financial institutions for Boeing.
| Grading Company | Action | New Grade | Date |
|---|---|---|---|
| Citigroup | Maintain | Buy | 2026-01-28 |
| UBS | Maintain | Buy | 2026-01-28 |
| RBC Capital | Maintain | Outperform | 2026-01-28 |
| JP Morgan | Maintain | Overweight | 2026-01-28 |
| Bernstein | Maintain | Outperform | 2026-01-15 |
| Citigroup | Maintain | Buy | 2026-01-13 |
| JP Morgan | Maintain | Overweight | 2025-12-19 |
| Susquehanna | Maintain | Positive | 2025-11-12 |
| Freedom Capital Markets | Upgrade | Buy | 2025-11-03 |
| JP Morgan | Maintain | Overweight | 2025-10-30 |
General Dynamics Corporation Grades
This table presents recent institutional grades and rating changes for General Dynamics.
| Grading Company | Action | New Grade | Date |
|---|---|---|---|
| B of A Securities | Maintain | Buy | 2026-01-30 |
| UBS | Maintain | Neutral | 2026-01-15 |
| Citigroup | Maintain | Neutral | 2026-01-13 |
| JP Morgan | Maintain | Overweight | 2025-12-19 |
| Morgan Stanley | Upgrade | Overweight | 2025-12-16 |
| JP Morgan | Maintain | Overweight | 2025-10-28 |
| B of A Securities | Maintain | Buy | 2025-10-28 |
| Bernstein | Maintain | Market Perform | 2025-10-28 |
| UBS | Maintain | Neutral | 2025-10-27 |
| JP Morgan | Maintain | Overweight | 2025-10-27 |
Which company has the best grades?
Boeing consistently receives Buy or Outperform ratings, reflecting stronger institutional conviction. General Dynamics shows a mix of Buy, Overweight, and Neutral grades. Boeing’s higher grades may suggest greater analyst confidence, potentially influencing investor sentiment positively.
Risks specific to each company
The following risk categories identify critical pressure points and systemic threats facing both Boeing and General Dynamics in the 2026 market environment:
1. Market & Competition
The Boeing Company
- Faces intense competition in commercial and defense sectors; high valuation multiples reflect market skepticism.
General Dynamics Corporation
- Competes across diversified aerospace and defense segments; valuation metrics indicate more balanced market perception.
2. Capital Structure & Debt
The Boeing Company
- High debt-to-equity ratio (9.92) signals elevated financial risk and weaker balance sheet leverage.
General Dynamics Corporation
- Low debt-to-equity ratio (0.31) reflects conservative leverage and stronger financial stability.
3. Stock Volatility
The Boeing Company
- Beta of 1.163 indicates above-market volatility, raising risk for equity holders.
General Dynamics Corporation
- Beta of 0.414 suggests lower volatility, appealing to risk-averse investors.
4. Regulatory & Legal
The Boeing Company
- Subject to stringent aerospace regulations and historical scrutiny after past operational issues.
General Dynamics Corporation
- Faces defense contracting compliance risks but benefits from stable government relationships.
5. Supply Chain & Operations
The Boeing Company
- Complex global supply chain vulnerable to disruptions impacting production schedules.
General Dynamics Corporation
- Integrated manufacturing capabilities reduce dependency risks; steady defense contracts mitigate volatility.
6. ESG & Climate Transition
The Boeing Company
- Pressure to reduce emissions in commercial aviation; ESG initiatives critical for reputation.
General Dynamics Corporation
- Focus on defense tech innovation; ESG risks moderate but rising with scrutiny on military impacts.
7. Geopolitical Exposure
The Boeing Company
- Global aerospace sales expose it to international trade tensions and export controls.
General Dynamics Corporation
- Defense contracts primarily US-focused, limiting geopolitical risk but dependent on US government budgets.
Which company shows a better risk-adjusted profile?
General Dynamics exhibits a superior risk-adjusted profile. Boeing’s highest risk is its strained capital structure and operational complexity amid volatile market sentiment. General Dynamics manages leverage conservatively and maintains stable cash flows, backed by strong defense demand. Boeing’s Altman Z-score places it in the distress zone (1.67), signaling elevated bankruptcy risk, while General Dynamics sits comfortably in the safe zone (4.26). This stark contrast justifies caution toward Boeing despite its scale and market presence.
Final Verdict: Which stock to choose?
The Boeing Company’s superpower lies in its rapid revenue and earnings growth, signaling a strong operational rebound. However, its declining return on invested capital and high leverage remain points of vigilance. It fits portfolios geared toward aggressive growth willing to tolerate elevated financial risk.
General Dynamics Corporation boasts a durable competitive moat with consistent value creation and a solid return on invested capital exceeding its cost of capital. Its lower leverage and stronger financial stability make it a safer choice than Boeing. GD suits investors seeking growth at a reasonable price with better downside protection.
If you prioritize aggressive growth and can stomach financial volatility, Boeing’s rebound momentum offers compelling upside potential. However, if you seek steady value creation combined with financial resilience, General Dynamics outshines as the superior choice, commanding a premium for its stability and proven moat.
Disclaimer: Investment carries a risk of loss of initial capital. The past performance is not a reliable indicator of future results. Be sure to understand risks before making an investment decision.
Go Further
I encourage you to read the complete analyses of The Boeing Company and General Dynamics Corporation to enhance your investment decisions: