Home > Comparison > Industrials > GD vs TXT
The strategic rivalry between General Dynamics Corporation and Textron Inc. shapes the aerospace and defense sector’s competitive landscape. General Dynamics operates as a diversified industrial giant with strong marine and combat system segments. Textron, by contrast, blends aerospace manufacturing with specialized industrial and finance operations. This analysis explores their contrasting growth trajectories to identify which company delivers superior risk-adjusted returns for a diversified portfolio in today’s complex market environment.
Table of contents
Companies Overview
General Dynamics and Textron both shape the Aerospace & Defense landscape with significant market footprints and diverse portfolios.
General Dynamics Corporation: Aerospace & Defense Powerhouse
General Dynamics dominates as a leading aerospace and defense company with a 94.8B market cap. It generates revenue through four segments: Aerospace business jets, Marine Systems naval vessels, Combat Systems armored vehicles, and Technologies IT and mission support. Its strategic focus in 2026 emphasizes advanced defense technologies and lifecycle support services for military platforms.
Textron Inc.: Diversified Industrial & Defense Innovator
Textron stands out as a multi-industry player with a 15.5B market cap. It earns primarily from Textron Aviation jets, Bell helicopters, Textron Systems unmanned and armored vehicles, and Industrial products like fuel systems and utility vehicles. In 2026, Textron prioritizes innovation in unmanned systems and expanding commercial aviation maintenance services globally.
Strategic Collision: Similarities & Divergences
Both companies rely heavily on aerospace and defense but diverge in scope: General Dynamics pursues a full-spectrum military solutions approach while Textron blends defense with industrial manufacturing and financing. The core battleground lies in military aircraft and land systems. Investors face distinct profiles: General Dynamics offers deep defense specialization; Textron delivers diversified industrial exposure with aerospace growth potential.
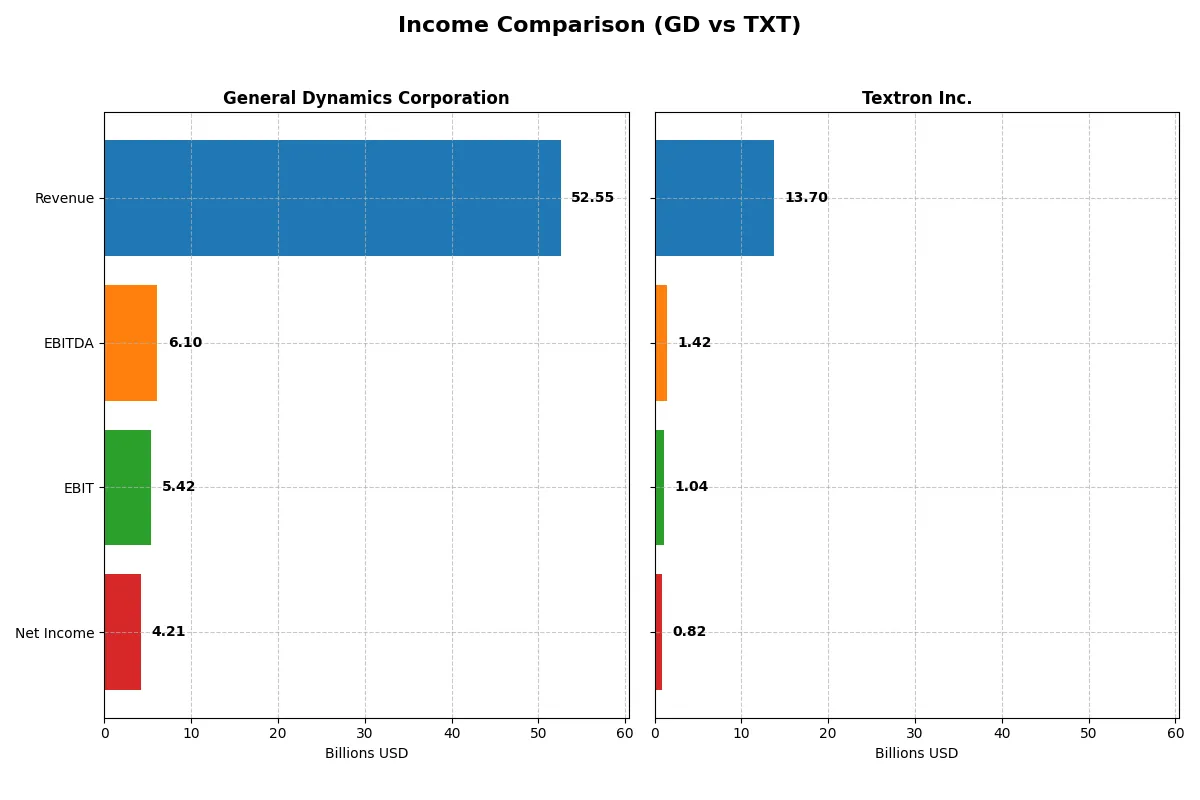
Income Statement Comparison
The following data dissects the core profitability and scalability of both corporate engines to reveal who dominates the bottom line:
| Metric | General Dynamics Corporation (GD) | Textron Inc. (TXT) |
|---|---|---|
| Revenue | 52.6B | 13.7B |
| Cost of Revenue | 44.6B | 11.2B |
| Operating Expenses | 2.6B | 1.6B |
| Gross Profit | 7.9B | 2.5B |
| EBITDA | 6.1B | 1.4B |
| EBIT | 5.4B | 1.0B |
| Interest Expense | 314M | 97M |
| Net Income | 4.2B | 824M |
| EPS | 15.64 | 5.11 |
| Fiscal Year | 2025 | 2025 |
Income Statement Analysis: The Bottom-Line Duel
This income statement comparison reveals which company runs a more efficient and profitable business engine, highlighting their financial momentum and margin dynamics.
General Dynamics Corporation Analysis
General Dynamics shows robust revenue growth, reaching $52.6B in 2025, up 10.1% year-over-year. Net income climbed to $4.21B, marking a 13.4% EPS growth. Gross margin holds steady at 15.1%, while net margin improves to 8.0%. The company demonstrates strong operational efficiency, with EBIT margin favorable at 10.3%, signaling disciplined cost control amid growth.
Textron Inc. Analysis
Textron’s revenue remained flat at $13.7B for 2025, reflecting a pause in top-line expansion. Net income stands at $824M, with EPS growth of 18.0%, supported by stable gross margin of 18.3% and a modest net margin of 6.0%. EBIT margin is neutral at 7.6%, indicating moderate profitability but limited momentum compared to peers.
Verdict: Growth Momentum vs. Margin Stability
General Dynamics outpaces Textron with stronger revenue and net income growth, driven by favorable EBIT and net margins. While Textron maintains higher gross margins, it struggles with stagnant revenue and slower operational gains. For investors prioritizing dynamic growth and efficiency, General Dynamics presents a more compelling income statement profile.
Financial Ratios Comparison
These vital ratios act as a diagnostic tool to expose the underlying fiscal health, valuation premiums, and capital efficiency of the companies compared here:
| Ratios | General Dynamics Corporation (GD) | Textron Inc. (TXT) |
|---|---|---|
| ROE | 16.4% | 10.5% |
| ROIC | 10.7% | 6.9% |
| P/E | 21.6 | 19.0 |
| P/B | 3.55 | 1.99 |
| Current Ratio | 1.44 | 5.94 |
| Quick Ratio | 0.89 | 2.33 |
| D/E | 0.31 | 0.45 |
| Debt-to-Assets | 14.0% | 19.5% |
| Interest Coverage | 17.1 | 8.8 |
| Asset Turnover | 0.92 | 0.76 |
| Fixed Asset Turnover | 6.98 | 5.29 |
| Payout ratio | 37.8% | 2.3% |
| Dividend yield | 1.75% | 0.12% |
| Fiscal Year | 2025 | 2025 |
Efficiency & Valuation Duel: The Vital Signs
Financial ratios serve as a company’s DNA, uncovering hidden risks and operational strengths that shape investor decisions.
General Dynamics Corporation
General Dynamics posts a strong 16.4% ROE and a solid 10.7% ROIC, indicating efficient capital use and profitability above its 5.6% WACC. The P/E at 21.6 is neutral, suggesting fair valuation, but a high P/B at 3.55 signals some premium pricing. It delivers a 1.75% dividend yield, balancing shareholder returns with disciplined capital allocation.
Textron Inc.
Textron shows moderate profitability with a 10.5% ROE and 6.9% ROIC, both neutral versus its 7.6% WACC, reflecting average capital efficiency. Its P/E stands at 19.0, fairly valued, while a low 0.12% dividend yield indicates limited income focus. The firm retains flexibility with a strong quick ratio but a stretched current ratio, hinting at working capital volatility.
Balanced Profitability vs. Valuation Discipline
General Dynamics offers superior profitability and a healthier dividend, albeit at a premium price, while Textron maintains neutral valuation with moderate returns. Investors prioritizing steady income and operational strength may favor General Dynamics. Those seeking valuation discipline with moderate growth could lean toward Textron’s profile.
Which one offers the Superior Shareholder Reward?
General Dynamics (GD) delivers a traditional dividend yield near 2.0% with a payout ratio around 40%, well covered by FCF at 77%. Its steady buyback program supports total returns. Textron (TXT) yields a negligible 0.12% dividend with a 2% payout ratio, prioritizing reinvestment and modest buybacks. GD’s yield and buyback balance offers a more sustainable, attractive shareholder reward in 2026.
Comparative Score Analysis: The Strategic Profile
The radar chart reveals the fundamental DNA and trade-offs of General Dynamics and Textron, highlighting their core financial strengths and vulnerabilities:
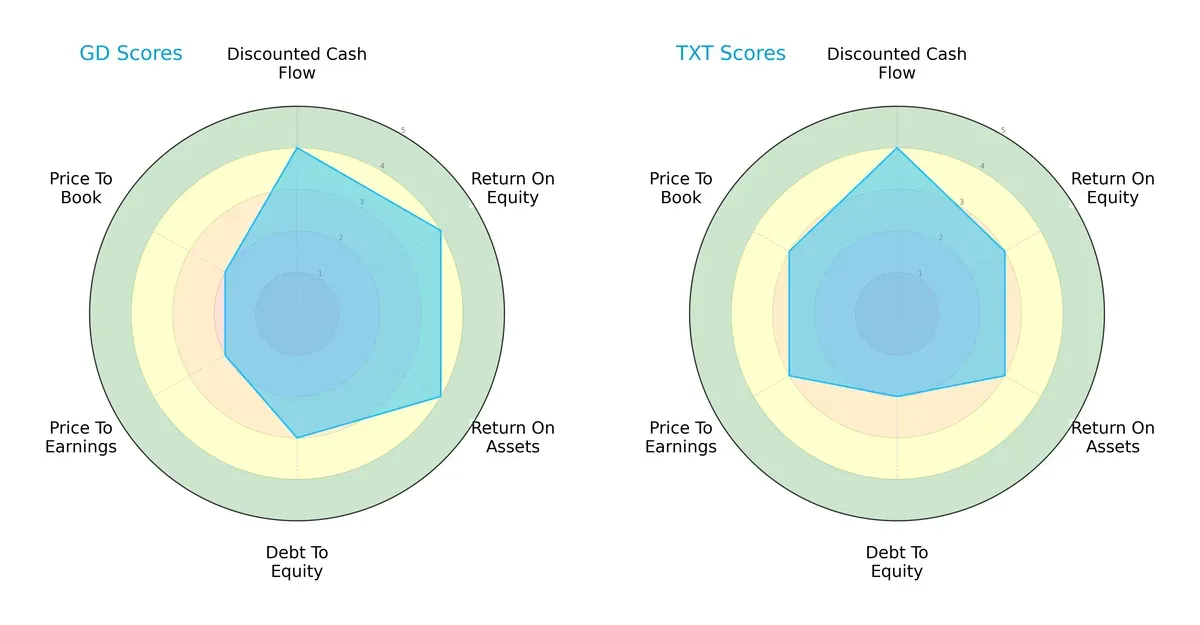
General Dynamics demonstrates stronger operational efficiency with higher ROE and ROA scores (4 vs. 3 each), signaling superior profit generation and asset utilization. It also carries a moderate debt burden (score 3) compared to Textron’s higher leverage risk (score 2). Both firms share favorable DCF scores (4), suggesting similar valuations based on future cash flows. However, Textron scores better on valuation metrics (P/E and P/B scores of 3 vs. 2), indicating relatively more attractive pricing. Overall, General Dynamics offers a more balanced financial profile, while Textron leans on valuation appeal amid slightly weaker profitability and leverage metrics.
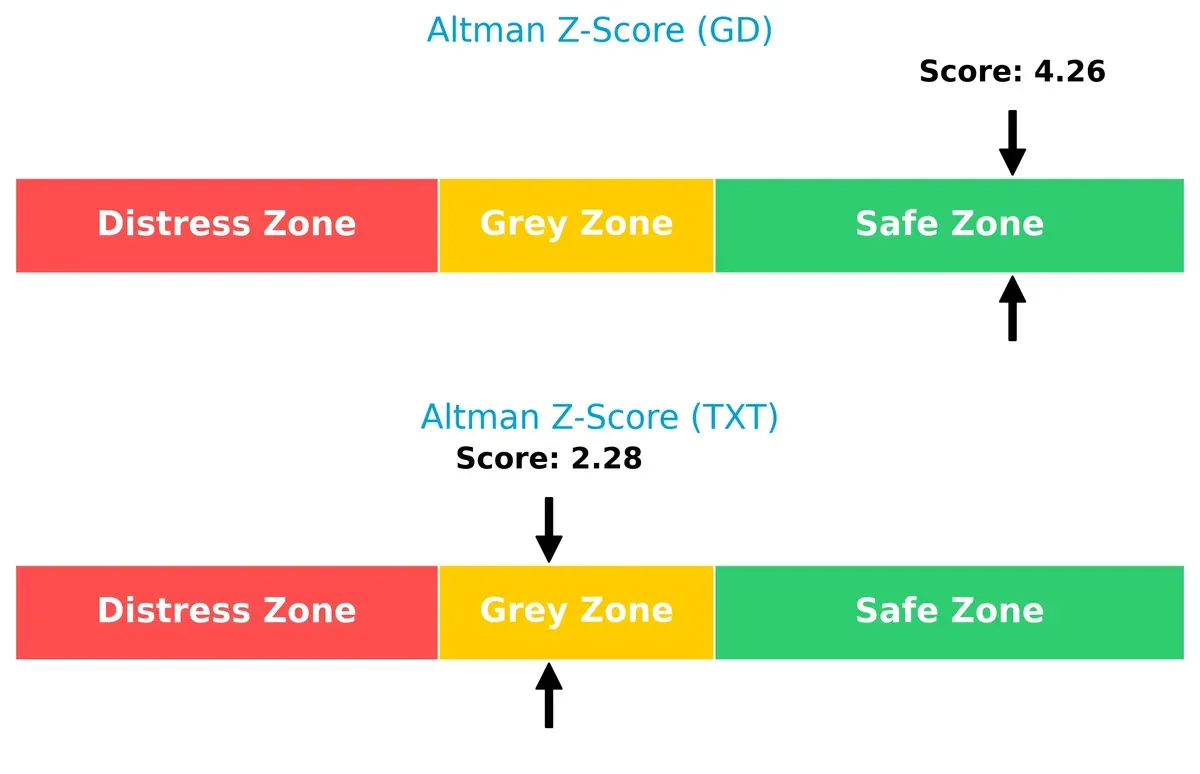
Bankruptcy Risk: Solvency Showdown
The Altman Z-Score difference shows General Dynamics (4.26) firmly in the safe zone, while Textron (2.28) languishes in the grey zone, signaling higher bankruptcy risk. This gap implies General Dynamics has greater resilience to economic shocks in this cycle:
Financial Health: Quality of Operations
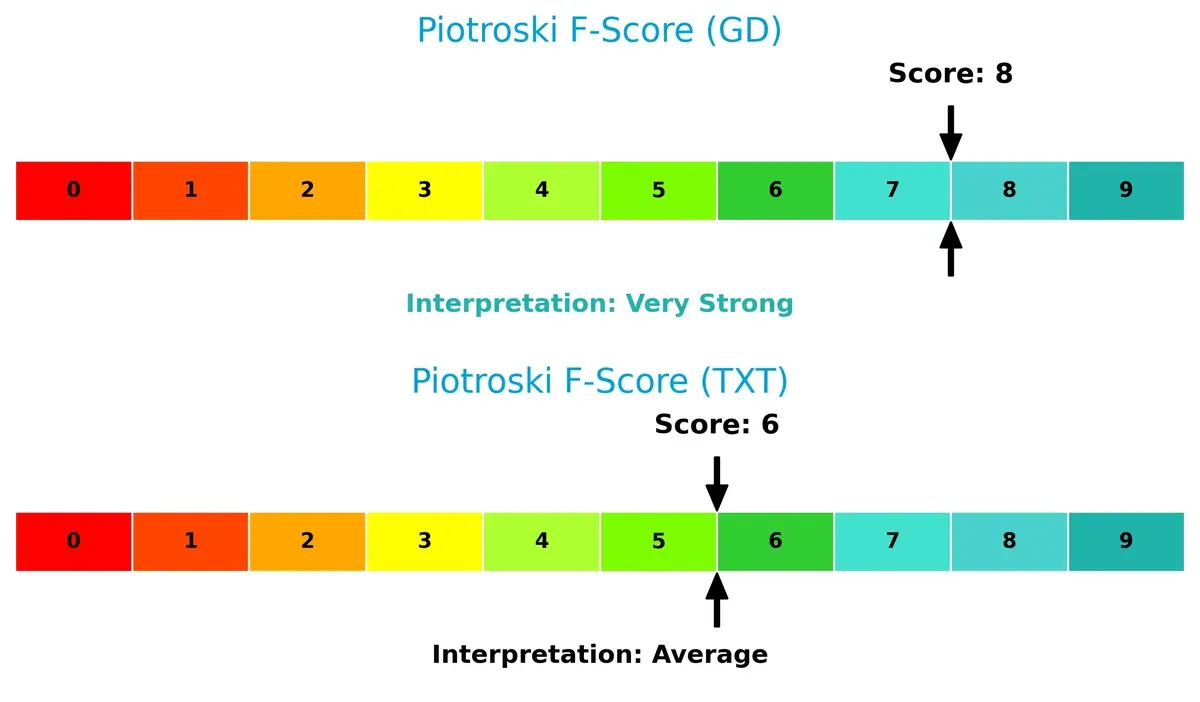
General Dynamics’ Piotroski F-Score of 8 places it in very strong financial health territory, while Textron’s 6 is merely average. This suggests General Dynamics maintains superior profitability, liquidity, and operational efficiency without red flags:
How are the two companies positioned?
This section dissects GD and TXT’s operational DNA by comparing their revenue distribution and internal dynamics, including strengths and weaknesses. The objective is to confront their economic moats to identify which model offers the most resilient and sustainable competitive advantage today.
Revenue Segmentation: The Strategic Mix
This visual comparison dissects how General Dynamics Corporation and Textron Inc. diversify their income streams and where their primary sector bets lie:
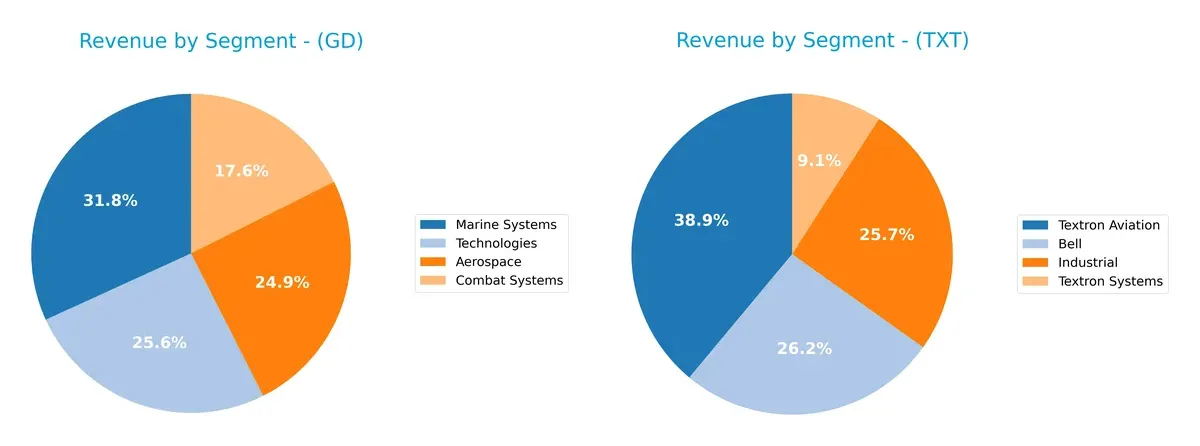
General Dynamics anchors its revenue in Marine Systems at $16.7B, closely followed by Technologies and Aerospace, each surpassing $13B. This mix reveals a balanced portfolio across aerospace, marine, and tech sectors, reducing concentration risk. Textron pivots heavily on Textron Aviation with $5.3B and Bell at $3.6B, showing a more concentrated bet on aviation and industrial segments. This focus may enhance ecosystem lock-in but exposes Textron to sector-specific volatility.
Strengths and Weaknesses Comparison
This table compares the strengths and weaknesses of General Dynamics Corporation and Textron Inc.:
GD Strengths
- Diversified segments including Aerospace, Marine, Combat Systems, and Technologies
- Favorable ROE and ROIC above 10%
- Low debt-to-assets ratio at 14%
- Strong interest coverage of 17.25
- High fixed asset turnover at 6.98
- Extensive North American and European market presence
TXT Strengths
- Diverse product lines in Bell, Industrial, Textron Aviation, and Textron Systems
- Favorable WACC and low debt-to-assets ratio at 19.49%
- Strong quick ratio at 2.33 supports liquidity
- Positive interest coverage at 10.72
- Favorable fixed asset turnover at 5.29
- Significant U.S. and growing international sales
GD Weaknesses
- Price-to-book ratio high at 3.55, considered unfavorable
- Neutral net margin at 8% lower than ROE suggests efficiency gap
- Quick ratio below 1 at 0.89 signals potential liquidity risk
- Concentrated revenue in North America (over 80%) limits geographic diversification
TXT Weaknesses
- Unfavorable current ratio at 5.94 may indicate inefficient asset use
- Lower ROE and ROIC around 10% and 7% respectively are neutral
- Dividend yield very low at 0.12%
- Smaller scale in international markets compared to GD
General Dynamics shows strong profitability and efficient capital use but faces valuation and liquidity challenges. Textron has solid liquidity and cost of capital metrics but lags slightly in profitability and geographic reach. Both companies exhibit slightly favorable overall financial profiles with distinct strategic focus areas.
The Moat Duel: Analyzing Competitive Defensibility
A structural moat is the only true shield protecting long-term profits from relentless competition erosion:
General Dynamics Corporation: Deep Industrial Moat via Defense Scale and Innovation
General Dynamics leverages high switching costs and government contracts, reflected in a robust 5.1% ROIC above WACC and stable margins. Its expanding tech portfolio in AI and undersea vehicles promises to deepen this moat through 2026.
Textron Inc.: Diverse Product Moat with Emerging Profitability Challenges
Textron’s moat hinges on diversified aerospace and defense segments, but it trails General Dynamics with a negative ROIC spread versus WACC, signaling value destruction despite rising profitability. Growth in unmanned systems could offer partial remedy.
Scale Dominance vs. Diversified Innovation: The Moat Verdict
General Dynamics commands a wider, deeper moat, creating clear value and defending market share through scale and government ties. Textron, while innovating, remains vulnerable without consistent value creation to protect its position.
Which stock offers better returns?
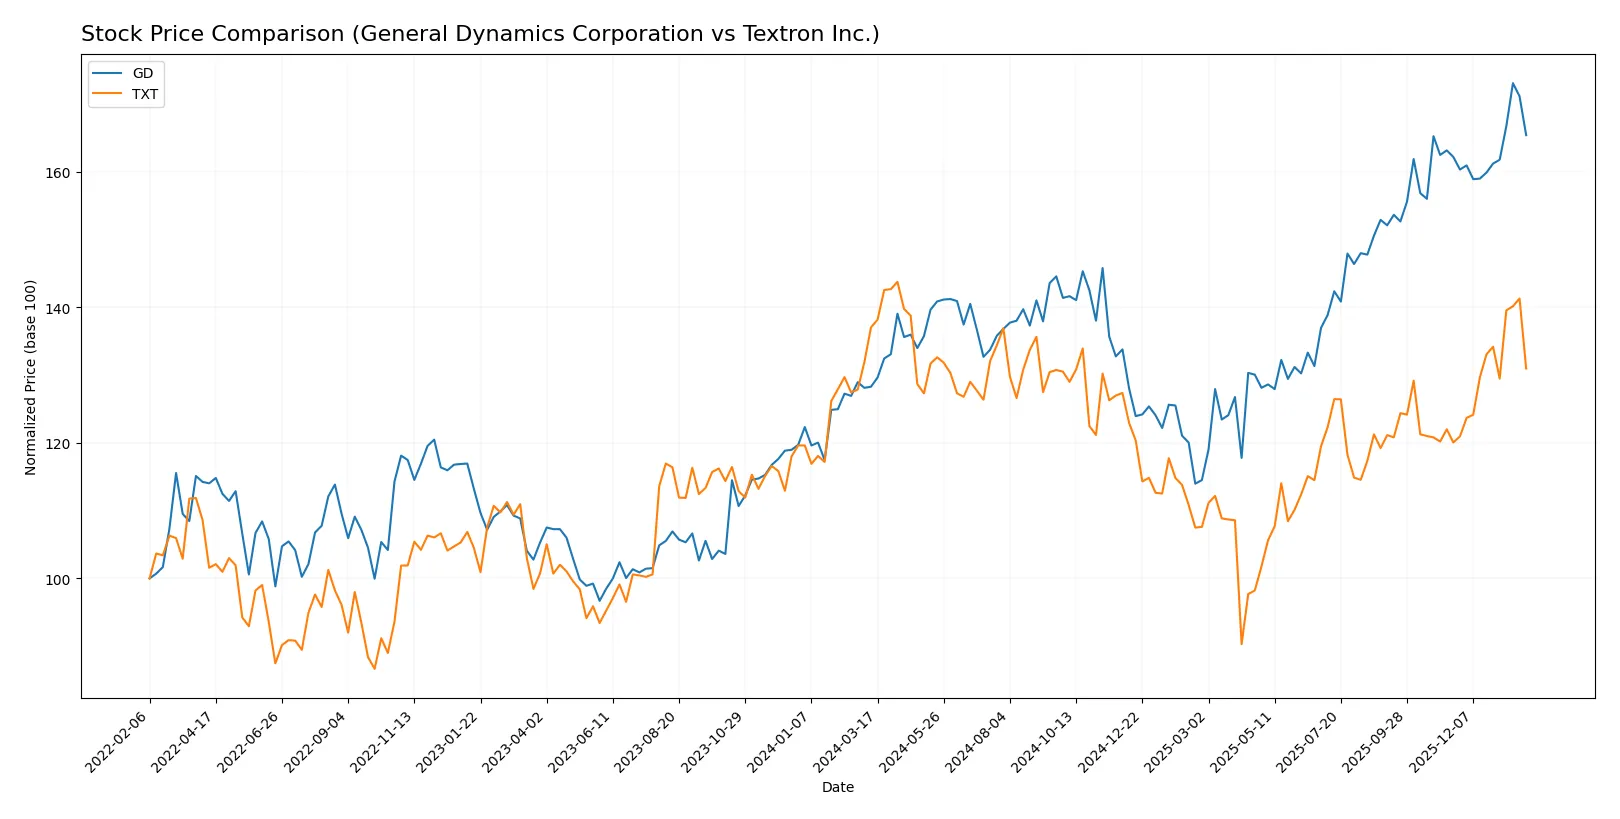
The past year shows contrasting dynamics: General Dynamics surged nearly 29% with accelerating momentum, while Textron declined 4.4% despite a recent recovery phase.
Trend Comparison
General Dynamics’ stock rose 28.93% over the past year, indicating a strong bullish trend with accelerating price gains and a high volatility of 28.77. The stock hit a high of 367.38 and a low of 241.94.
Textron’s stock declined 4.42% over the same period, showing a bearish trend despite acceleration. Volatility measured 7.24, with prices ranging between 60.72 and 96.65.
Comparing these trends, General Dynamics delivered the highest market performance with a clear bullish trajectory, while Textron’s overall returns remain negative despite recent upward movement.
Target Prices
Analysts present a confident consensus on target prices for General Dynamics Corporation and Textron Inc.
| Company | Target Low | Target High | Consensus |
|---|---|---|---|
| General Dynamics Corporation | 385 | 444 | 404.22 |
| Textron Inc. | 92 | 110 | 101 |
The consensus target prices exceed current stock prices, signaling expected growth. General Dynamics trades at 351.09, below its 404.22 consensus, while Textron at 88.06 lags its 101 target.

Don’t Let Luck Decide Your Entry Point
Optimize your entry points with our advanced ProRealTime indicators. You’ll get efficient buy signals with precise price targets for maximum performance. Start outperforming now!
How do institutions grade them?
General Dynamics Corporation Grades
The following table shows recent institutional grades for General Dynamics Corporation.
| Grading Company | Action | New Grade | Date |
|---|---|---|---|
| B of A Securities | Maintain | Buy | 2026-01-30 |
| UBS | Maintain | Neutral | 2026-01-15 |
| Citigroup | Maintain | Neutral | 2026-01-13 |
| JP Morgan | Maintain | Overweight | 2025-12-19 |
| Morgan Stanley | Upgrade | Overweight | 2025-12-16 |
| JP Morgan | Maintain | Overweight | 2025-10-28 |
| B of A Securities | Maintain | Buy | 2025-10-28 |
| Bernstein | Maintain | Market Perform | 2025-10-28 |
| JP Morgan | Maintain | Overweight | 2025-10-27 |
| Susquehanna | Maintain | Positive | 2025-10-27 |
Textron Inc. Grades
The following table shows recent institutional grades for Textron Inc.
| Grading Company | Action | New Grade | Date |
|---|---|---|---|
| Citigroup | Maintain | Neutral | 2026-01-29 |
| JP Morgan | Maintain | Neutral | 2026-01-29 |
| UBS | Maintain | Neutral | 2026-01-15 |
| Citigroup | Maintain | Neutral | 2026-01-13 |
| JP Morgan | Maintain | Neutral | 2025-10-27 |
| UBS | Maintain | Neutral | 2025-10-24 |
| TD Cowen | Maintain | Hold | 2025-10-24 |
| Barclays | Maintain | Overweight | 2025-07-29 |
| UBS | Upgrade | Neutral | 2025-07-28 |
| Susquehanna | Maintain | Positive | 2025-07-25 |
Which company has the best grades?
General Dynamics consistently receives stronger ratings, including multiple Buy and Overweight grades. Textron mostly holds Neutral or Hold grades. Investors may view General Dynamics as having more optimistic institutional sentiment.
Risks specific to each company
The following categories identify the critical pressure points and systemic threats facing both firms in the 2026 market environment:
1. Market & Competition
General Dynamics Corporation
- Operates in a competitive aerospace & defense sector with diversified segments, benefiting from strong government contracts.
Textron Inc.
- Faces intense competition across aviation, defense, and industrial markets, with less diversification than GD.
2. Capital Structure & Debt
General Dynamics Corporation
- Maintains a conservative debt-to-equity ratio (0.31) and strong interest coverage (17.25), indicating solid financial stability.
Textron Inc.
- Higher debt-to-equity ratio (0.45) with lower interest coverage (10.72), suggesting increased leverage risk.
3. Stock Volatility
General Dynamics Corporation
- Low beta (0.414) reflects lower stock volatility and defensive characteristics versus the market.
Textron Inc.
- Beta near 1.0 implies market-level volatility, exposing investors to higher price swings.
4. Regulatory & Legal
General Dynamics Corporation
- Subject to extensive U.S. defense regulations and export controls; risks tied to government budget changes.
Textron Inc.
- Faces similar regulatory pressures, but also exposed to cross-industry compliance in industrial and finance segments.
5. Supply Chain & Operations
General Dynamics Corporation
- Complex supply chain for naval and combat systems, sensitive to geopolitical and raw material risks.
Textron Inc.
- Diverse operations across aviation, defense, and industrial products increase supply chain complexity and operational risk.
6. ESG & Climate Transition
General Dynamics Corporation
- Increasing pressure to align with climate goals, particularly in manufacturing and marine systems segments.
Textron Inc.
- Faces ESG challenges in plastics and fuel systems production, with rising focus on sustainable industrial practices.
7. Geopolitical Exposure
General Dynamics Corporation
- High exposure to U.S. defense spending and geopolitical tensions impacting international contracts.
Textron Inc.
- Also dependent on U.S. defense but broader global footprint increases risk from international market volatility.
Which company shows a better risk-adjusted profile?
General Dynamics shows a better risk-adjusted profile. Its lower stock volatility, stronger balance sheet, and safer Altman Z-Score (4.26 vs. 2.28) reduce financial distress risk. Textron’s elevated debt and higher beta expose it to more market and operational risk. GD’s robust interest coverage and very strong Piotroski score further reinforce its financial resilience in 2026.
Final Verdict: Which stock to choose?
General Dynamics Corporation’s superpower lies in its durable competitive advantage and disciplined capital allocation that delivers consistent value creation. Its robust ROIC well above WACC signals strong economic moat. The point of vigilance is its relatively high price-to-book ratio, which may imply premium valuation. It fits well in portfolios targeting steady, long-term growth with moderate risk tolerance.
Textron Inc. leverages a strategic moat built on diversified industrial operations and a solid balance sheet with strong liquidity. Although its ROIC trails WACC, the company shows improving profitability and a more conservative valuation profile than General Dynamics. This stock suits investors favoring growth at a reasonable price with an appetite for moderate volatility.
If you prioritize durable value creation and are comfortable with a premium for stability, General Dynamics outshines with its proven moat and consistent cash generation. However, if you seek a more value-oriented growth play with better liquidity and a less stretched valuation, Textron offers better stability and upside potential in a cyclical environment. Both stocks demand careful monitoring of macroeconomic shifts and defense spending trends.
Disclaimer: Investment carries a risk of loss of initial capital. The past performance is not a reliable indicator of future results. Be sure to understand risks before making an investment decision.
Go Further
I encourage you to read the complete analyses of General Dynamics Corporation and Textron Inc. to enhance your investment decisions: