Home > Comparison > Industrials > RTX vs GD
The strategic rivalry between RTX Corporation and General Dynamics Corporation shapes the aerospace and defense sector’s evolution. RTX operates as a diversified industrial powerhouse with segments spanning aerospace systems, engines, and defense electronics. In contrast, General Dynamics focuses on integrated defense solutions including marine systems, combat vehicles, and advanced technologies. This analysis aims to uncover which business model delivers superior risk-adjusted returns, guiding investors toward the optimal portfolio allocation amidst sector complexity.

Table of contents
Companies Overview
RTX Corporation and General Dynamics Corporation stand as pivotal players in the aerospace and defense sector with substantial market influence.
RTX Corporation: Aerospace & Defense Powerhouse
RTX Corporation dominates aerospace and defense by delivering systems and services to commercial, military, and government clients worldwide. Its revenue hinges on three segments: Collins Aerospace, Pratt & Whitney, and Raytheon, focusing on aircraft systems, engines, and defense technologies. In 2026, RTX sharpens its strategic edge by blending advanced aerospace solutions with integrated defense capabilities, reinforcing its global leadership.
General Dynamics Corporation: Comprehensive Defense Innovator
General Dynamics excels as a diversified aerospace and defense firm with four key segments: Aerospace, Marine Systems, Combat Systems, and Technologies. It drives revenue through business jets, naval ships, land combat vehicles, and IT mission support. In 2026, the company prioritizes modernization and cutting-edge technology deployment, emphasizing lifecycle support and AI-enhanced defense systems as core growth avenues.
Strategic Collision: Similarities & Divergences
Both companies pursue integrated defense solutions but diverge in approach: RTX leverages a multi-segment aerospace and defense synergy, while General Dynamics emphasizes a broad platform mix spanning air, sea, and land. Their primary battleground lies in advanced military technology and government contracts. RTX offers a more diversified aerospace portfolio; General Dynamics presents a focused defense modernization profile, attracting distinct investor appetites.
Income Statement Comparison
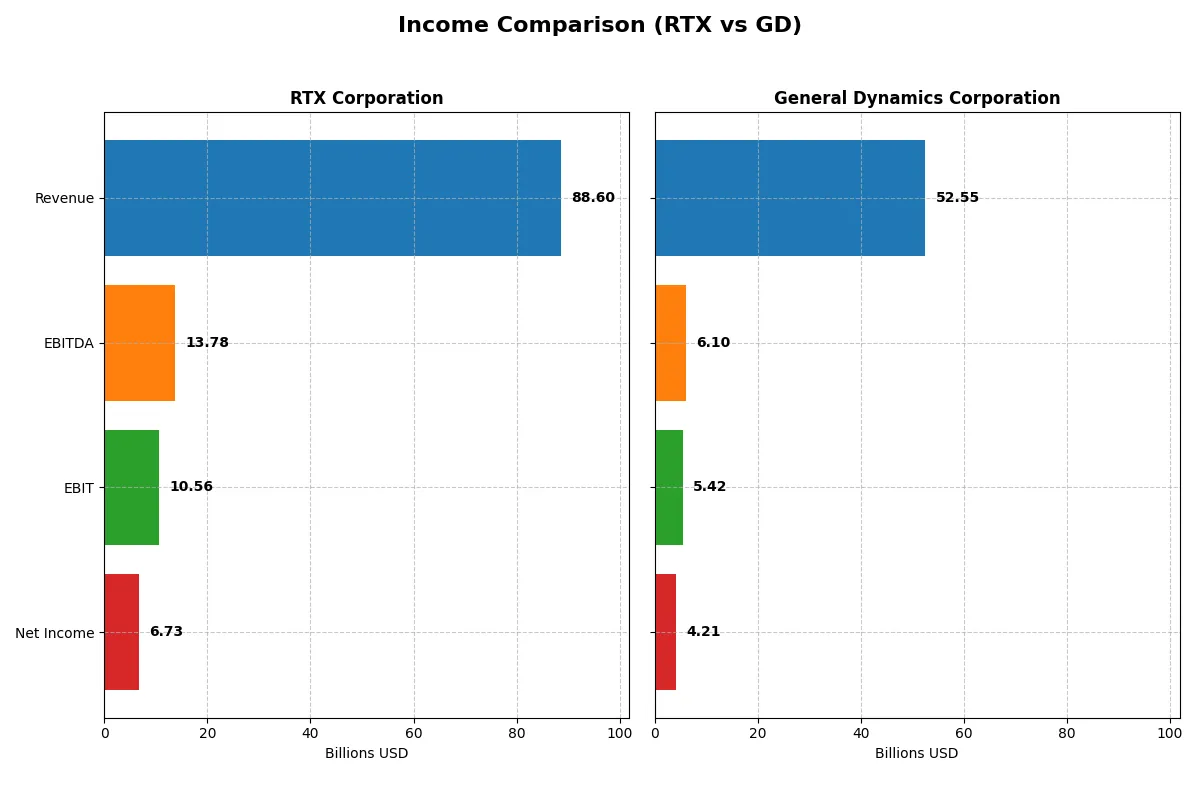
This data dissects the core profitability and scalability of both corporate engines to reveal who dominates the bottom line:
| Metric | RTX Corporation (RTX) | General Dynamics Corporation (GD) |
|---|---|---|
| Revenue | 88.6B | 52.6B |
| Cost of Revenue | 70.8B | 44.6B |
| Operating Expenses | 8.9B | 2.6B |
| Gross Profit | 17.8B | 7.9B |
| EBITDA | 13.8B | 6.1B |
| EBIT | 10.6B | 5.4B |
| Interest Expense | 1.8B | 314M |
| Net Income | 6.7B | 4.2B |
| EPS | 5.03 | 15.64 |
| Fiscal Year | 2025 | 2025 |
Income Statement Analysis: The Bottom-Line Duel
The upcoming income statement comparison reveals which company drives superior efficiency and profitability through its core operations.
RTX Corporation Analysis
RTX Corporation posts a robust revenue climb from 64.4B in 2021 to 88.6B in 2025. Net income nearly doubles to 6.7B in 2025, reflecting strong earnings momentum. Its gross margin holds firm around 20%, while net margin improves to 7.6%, signaling disciplined cost control and expanding profitability. The 2025 figures demonstrate accelerating EBIT growth, underpinned by focused operating expense management.
General Dynamics Corporation Analysis
General Dynamics grows revenue from 38.5B in 2021 to 52.6B in 2025, with net income rising more modestly to 4.2B. Gross margin remains lower at 15.1%, yet net margin of 8.0% leads in bottom-line efficiency. EBIT margin at 10.3% confirms consistent operating performance. The 2025 results show steady revenue and earnings growth, though margin expansion lags behind RTX’s pace.
Margin Expansion vs. Earnings Scale
RTX delivers stronger margin expansion and faster net income growth, nearly doubling profits over five years. General Dynamics maintains higher net margin but with slower earnings growth. RTX’s profile suits investors prioritizing accelerating profitability and operational leverage, while General Dynamics appeals to those valuing stable margin efficiency.
Financial Ratios Comparison
These vital ratios act as a diagnostic tool to expose the underlying fiscal health, valuation premiums, and capital efficiency of the companies compared below:
| Ratios | RTX Corporation (RTX) | General Dynamics Corporation (GD) |
|---|---|---|
| ROE | 7.9% (2024) | 16.4% (2025) |
| ROIC | 4.7% (2024) | 10.7% (2025) |
| P/E | 32.3 (2024) | 21.6 (2025) |
| P/B | 2.56 (2024) | 3.55 (2025) |
| Current Ratio | 0.99 (2024) | 1.44 (2025) |
| Quick Ratio | 0.74 (2024) | 0.89 (2025) |
| D/E | 0.71 (2024) | 0.31 (2025) |
| Debt-to-Assets | 26.3% (2024) | 14.0% (2025) |
| Interest Coverage | 3.39 (2024) | 17.06 (2025) |
| Asset Turnover | 0.50 (2024) | 0.92 (2025) |
| Fixed Asset Turnover | 4.50 (2024) | 6.98 (2025) |
| Payout ratio | 67.4% (2024) | 37.8% (2025) |
| Dividend yield | 2.09% (2024) | 1.75% (2025) |
| Fiscal Year | 2024 | 2025 |
Efficiency & Valuation Duel: The Vital Signs
Financial ratios act as a company’s DNA, unveiling hidden risks and operational strengths critical for investment decisions.
RTX Corporation
RTX shows a modest net margin of 7.6% but reports zero ROE and ROIC, signaling weak profitability. Its P/E ratio at 36.64 suggests the stock is stretched relative to earnings. Dividend yield stands at 1.45%, reflecting modest shareholder returns amid reinvestment in R&D at 3.6% of revenue.
General Dynamics Corporation
General Dynamics delivers stronger profitability with a 16.4% ROE and 10.7% ROIC, indicating efficient capital use. Its P/E ratio of 21.58 is more reasonable, implying fair valuation. The company yields 1.75% in dividends, balancing shareholder returns with stable margins near 8%.
Valuation Discipline vs. Profitability Efficiency
General Dynamics offers a better balance of operational efficiency and valuation discipline than RTX, which appears overvalued with weak returns. Investors seeking stable profitability and moderate risk may prefer General Dynamics, while those tolerant of stretched valuation might consider RTX’s growth focus.
Which one offers the Superior Shareholder Reward?
I compare RTX Corporation and General Dynamics Corporation’s shareholder reward strategies by examining dividend yields, payout ratios, and share buybacks. RTX yields 1.45% with a 53% payout ratio, indicating moderate income but higher payout stress. GD offers a 1.75% yield at a 38% payout ratio, showing more conservative income distribution and stronger free cash flow coverage (77%). RTX’s buyback intensity appears lower, limiting capital return, while GD’s robust free cash flow per share of 14.7B supports aggressive buybacks and dividends. I observe GD’s lower valuation multiples (P/E ~21 vs. RTX ~33) and higher sustainable payout suggest superior total return potential. For 2026, I favor General Dynamics for durable, balanced shareholder rewards combining dividends and buybacks.
Comparative Score Analysis: The Strategic Profile
The radar chart reveals the fundamental DNA and trade-offs of RTX Corporation and General Dynamics Corporation:
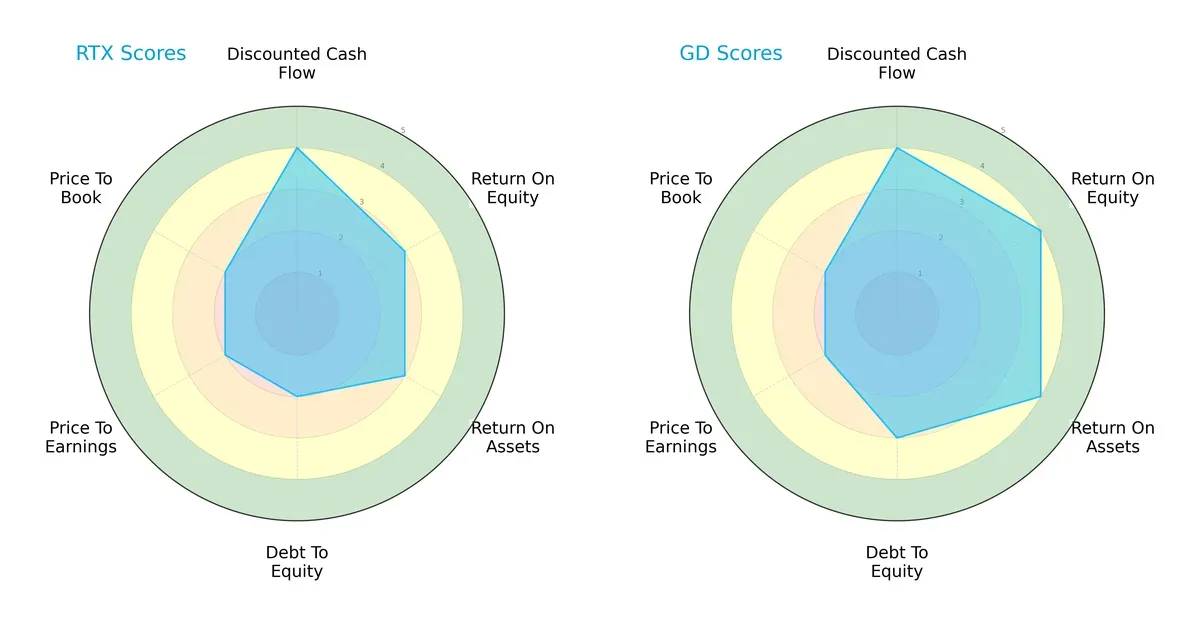
General Dynamics shows a more balanced financial profile with stronger profitability metrics, scoring 4 in ROE and ROA versus RTX’s 3. Both share a favorable DCF score of 4, signaling solid cash flow prospects. However, RTX has a slightly weaker debt position (score 2) compared to GD’s moderate 3. Valuation metrics (PE and PB) are equally moderate for both, indicating similar market pricing discipline. Overall, GD leverages operational efficiency while RTX relies more on cautious leverage management.
Bankruptcy Risk: Solvency Showdown
General Dynamics’ Altman Z-Score of 4.26 places it securely in the safe zone, while RTX’s 2.75 signals moderate risk in the grey zone:
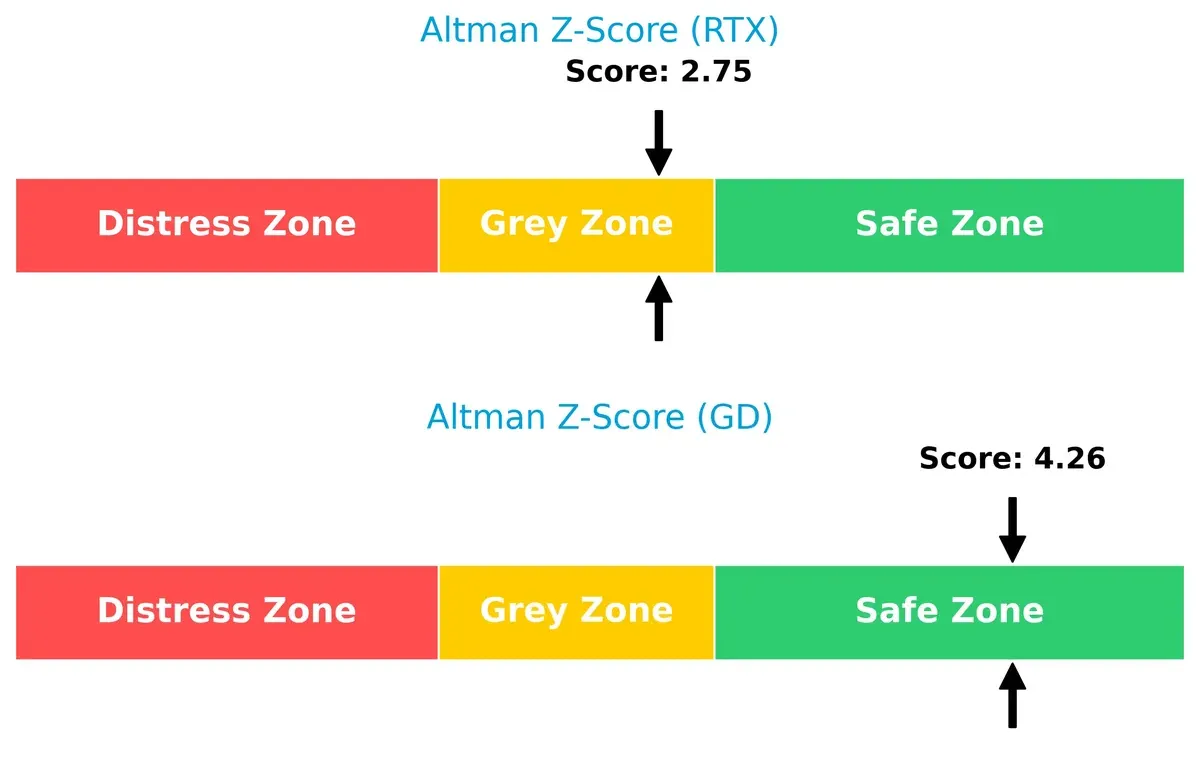
GD’s superior solvency score suggests better resilience against economic downturns. RTX’s score warns investors to watch its financial stability closely as market cycles tighten.
Financial Health: Quality of Operations
General Dynamics leads with a Piotroski F-Score of 8, reflecting very strong internal financial health, compared to RTX’s solid 7:
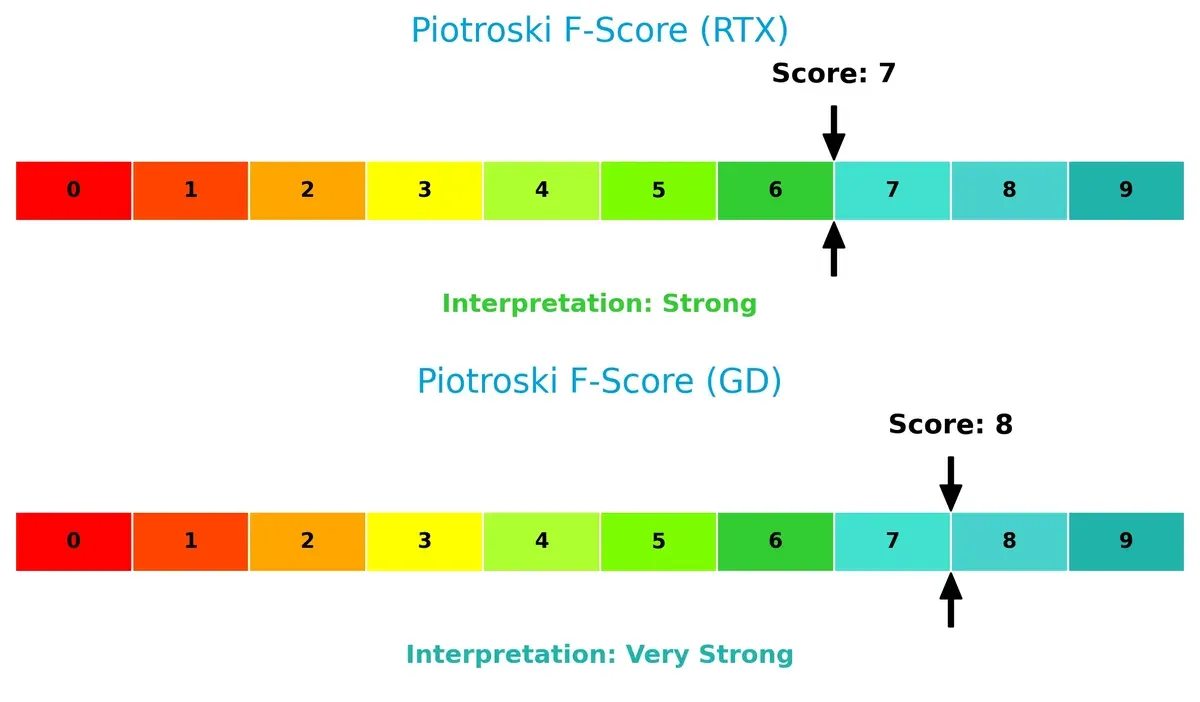
GD’s higher score indicates stronger profitability, liquidity, and operational efficiency. RTX’s slight lag suggests a few red flags in internal metrics, warranting cautious monitoring.
How are the two companies positioned?
This section dissects the operational DNA of RTX and GD by comparing their revenue distribution and internal dynamics—strengths and weaknesses. The goal is to confront their economic moats and identify which model offers the most resilient, sustainable advantage today.
Revenue Segmentation: The Strategic Mix
This visual comparison dissects how RTX Corporation and General Dynamics Corporation diversify their income streams and where their primary sector bets lie:
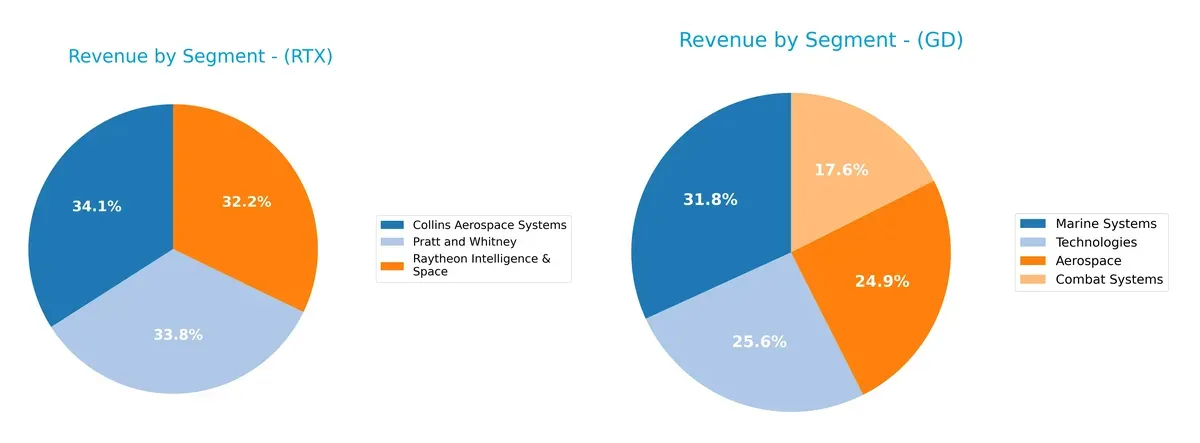
RTX anchors its revenue in three nearly equal pillars: Collins Aerospace Systems at $28.3B, Pratt and Whitney at $28.1B, and Raytheon Intelligence & Space at $26.7B. This balance underpins a diversified aerospace and defense ecosystem, reducing concentration risk. Conversely, General Dynamics leans on Marine Systems at $16.7B and Technologies at $13.5B, with less parity across segments. Its reliance on Marine Systems suggests infrastructure dominance but also exposes it to sector-specific cyclical risks.
Strengths and Weaknesses Comparison
This table compares the Strengths and Weaknesses of RTX Corporation and General Dynamics Corporation:
RTX Strengths
- Diverse aerospace segments with Collins Aerospace, Pratt & Whitney, and Raytheon Intelligence & Space generating over 28B each
- Strong US revenue dominance with 46B in 2024
- Favorable WACC and debt metrics indicate efficient capital structure
- Interest coverage ratio of 5.77 shows solid ability to service debt
GD Strengths
- Balanced segment revenue across Marine Systems (16.7B), Technologies (13.5B), Aerospace (13.1B), and Combat Systems (9.2B)
- Strong profitability with ROE of 16.4% and ROIC of 10.7%
- Favorable WACC and interest coverage ratio of 17.3 indicate robust financial health
- Growing US revenue base of 43.3B in 2025 with expanding global presence
RTX Weaknesses
- Unfavorable ROE and ROIC at 0%, indicating poor capital returns
- Low valuation metrics with PE at 36.6 considered high
- Weak liquidity ratios (current and quick ratio at 0) raise short-term risk concerns
- Asset turnover and fixed asset turnover unfavorable, suggesting inefficient asset use
GD Weaknesses
- PB ratio at 3.55 is unfavorable, implying overvaluation relative to book value
- Neutral liquidity ratios with quick ratio below 1 could signal cash flow constraints
- Slightly lower net margin than peers at 8.0%
- Geographic revenue concentration in North America may limit diversification
Both companies show strong capital structures and diversified aerospace operations. RTX’s weaknesses in profitability and liquidity contrast with GD’s better returns but higher valuation and moderate liquidity risks. These differences shape distinct strategic priorities in efficiency and market positioning.
The Moat Duel: Analyzing Competitive Defensibility
A structural moat alone shields long-term profits from relentless competition erosion. Let’s dissect each firm’s moat foundation:
RTX Corporation: Intangible Assets and Scale Moat
RTX leans on its diversified aerospace and defense segments with strong brand recognition and government contracts. Yet, its declining ROIC signals weakening capital efficiency, threatening future moat strength despite 2026 product innovations.
General Dynamics Corporation: Operational Excellence and Value Creation
GD’s moat stems from a growing ROIC above WACC, reflecting efficient capital use and value creation. Its integrated defense platforms and expanding tech services deepen competitive barriers, positioning it well for 2026 market disruption.
ROIC Resilience vs. Scale Complexity
GD outperforms RTX with a deeper, expanding moat supported by rising ROIC and capital discipline. RTX’s shrinking profitability undermines its scale advantage, leaving GD better equipped to defend and grow market share amid intensifying competition.
Which stock offers better returns?
Over the past year, both RTX Corporation and General Dynamics Corporation showed strong price growth with distinct acceleration patterns and differing volume trends.
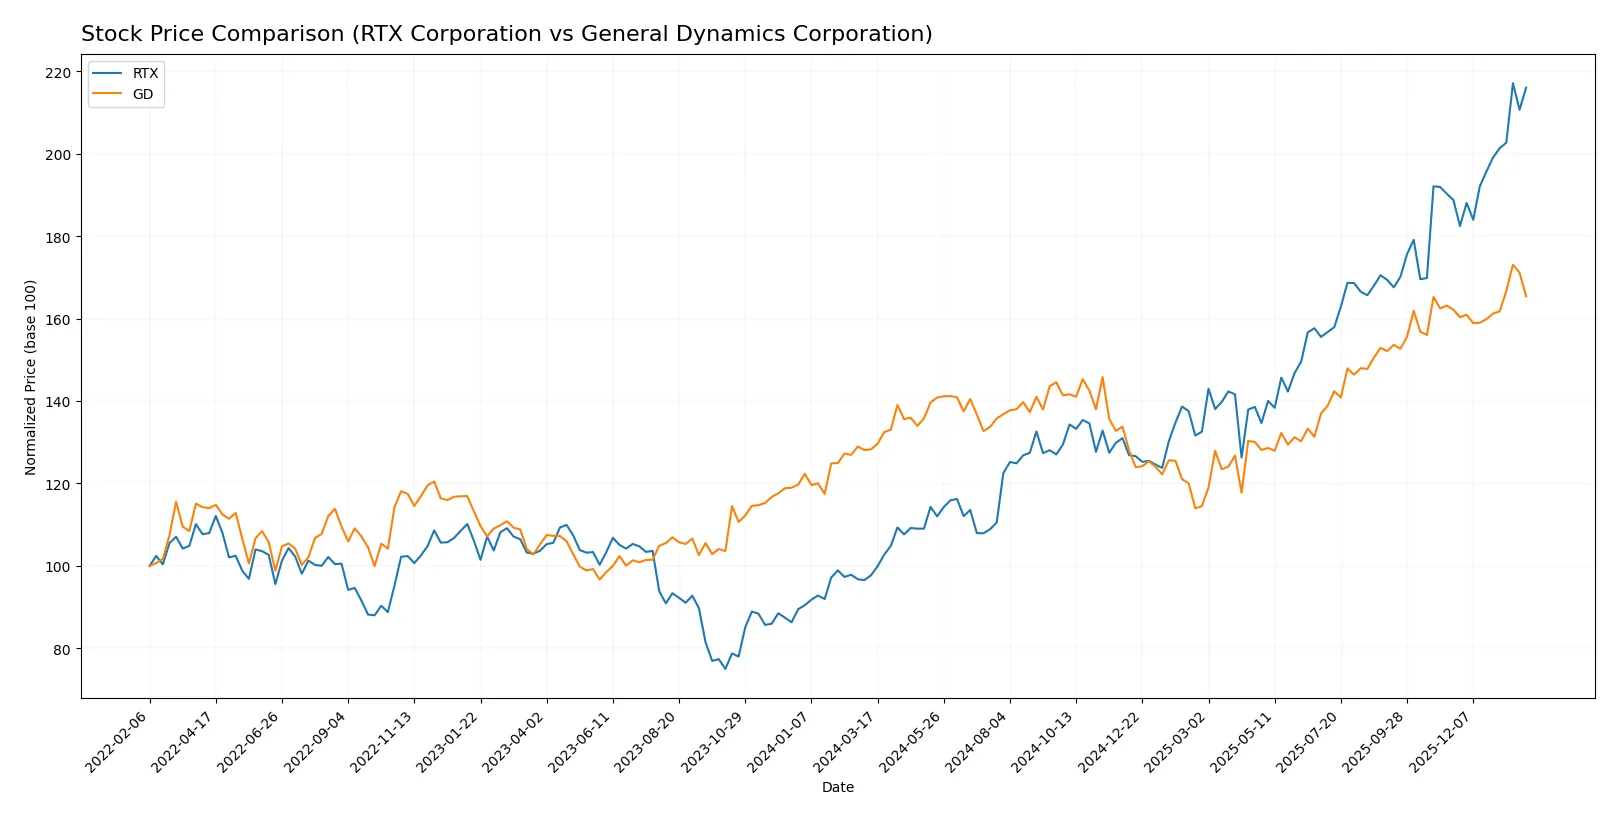
Trend Comparison
RTX Corporation’s stock surged 121.09% over the last 12 months, showing a clear bullish trend with accelerating momentum and a high volatility of 27.27%. The price ranged from 90.88 to 201.92.
General Dynamics Corporation posted a 28.93% gain over the same period, also bullish with acceleration. Volatility was similar at 28.77%, with prices fluctuating between 241.94 and 367.38.
RTX outperformed General Dynamics significantly in total price appreciation, delivering the highest market return among the two over the past year.
Target Prices
Analysts provide a bullish consensus for both RTX Corporation and General Dynamics Corporation.
| Company | Target Low | Target High | Consensus |
|---|---|---|---|
| RTX Corporation | 168 | 235 | 214.7 |
| General Dynamics Corporation | 385 | 444 | 404.22 |
The target consensus for RTX exceeds its current price of 201, suggesting upside potential. General Dynamics’ consensus target also sits above its 351 share price, reflecting positive analyst sentiment.

Don’t Let Luck Decide Your Entry Point
Optimize your entry points with our advanced ProRealTime indicators. You’ll get efficient buy signals with precise price targets for maximum performance. Start outperforming now!
How do institutions grade them?
RTX Corporation Grades
The following table summarizes recent grades from major institutions for RTX Corporation:
| Grading Company | Action | New Grade | Date |
|---|---|---|---|
| UBS | Maintain | Neutral | 2026-01-28 |
| JP Morgan | Maintain | Overweight | 2026-01-28 |
| RBC Capital | Maintain | Outperform | 2026-01-28 |
| Citigroup | Maintain | Buy | 2026-01-13 |
General Dynamics Corporation Grades
Here are the latest institutional grades for General Dynamics Corporation:
| Grading Company | Action | New Grade | Date |
|---|---|---|---|
| B of A Securities | Maintain | Buy | 2026-01-30 |
| UBS | Maintain | Neutral | 2026-01-15 |
| Citigroup | Maintain | Neutral | 2026-01-13 |
| JP Morgan | Maintain | Overweight | 2025-12-19 |
Which company has the best grades?
RTX Corporation generally receives higher grades such as Outperform and Buy, compared to General Dynamics’ mix of Buy and Neutral. This suggests RTX enjoys stronger institutional confidence, potentially influencing investor sentiment positively.
Risks specific to each company
The following categories identify the critical pressure points and systemic threats facing both firms in the 2026 market environment:
1. Market & Competition
RTX Corporation
- Faces intense competition in aerospace engines and defense systems; high P/E signals growth expectations that heighten market sensitivity.
General Dynamics Corporation
- Diversified segments including marine and combat systems provide resilience; more moderate valuation suggests steadier competitive positioning.
2. Capital Structure & Debt
RTX Corporation
- Favorable debt-to-equity and interest coverage ratios indicate manageable leverage, but weak liquidity ratios raise concerns.
General Dynamics Corporation
- Strong capital structure with low debt-to-assets and excellent interest coverage supports financial stability in volatile markets.
3. Stock Volatility
RTX Corporation
- Beta of 0.438 indicates lower volatility than the market but may limit upside in bull phases.
General Dynamics Corporation
- Slightly lower beta at 0.414 suggests stable stock behavior, appealing for risk-averse investors.
4. Regulatory & Legal
RTX Corporation
- As a major defense contractor, RTX is exposed to government contract risks and regulatory scrutiny, especially in international sales.
General Dynamics Corporation
- Similarly faces government regulation; diversified portfolios in combat and technologies segments help mitigate isolated regulatory shocks.
5. Supply Chain & Operations
RTX Corporation
- Complex global aerospace supply chains vulnerable to geopolitical disruptions and inflationary pressures.
General Dynamics Corporation
- Marine and combat systems face long production cycles; however, integrated lifecycle support offers operational resilience.
6. ESG & Climate Transition
RTX Corporation
- ESG initiatives critical as aerospace faces pressure to reduce emissions; transition costs may weigh on margins.
General Dynamics Corporation
- Increasing focus on sustainable naval technologies; ESG compliance is a growing factor in securing government contracts.
7. Geopolitical Exposure
RTX Corporation
- Significant international presence exposes RTX to geopolitical risks and export restrictions.
General Dynamics Corporation
- Heavy reliance on U.S. Navy contracts reduces direct geopolitical exposure but limits global market diversification.
Which company shows a better risk-adjusted profile?
General Dynamics exhibits a stronger risk-adjusted profile. Its superior ROE (16.4% vs. 0%), ROIC (10.7% vs. 0%), and Altman Z-Score in the safe zone highlight robust profitability and financial health. RTX’s liquidity weaknesses and lower profitability present heightened risk despite favorable leverage. The marked difference in interest coverage (17.25x for GD vs. 5.77x for RTX) reinforces GD’s resilience amid rising rates.
Final Verdict: Which stock to choose?
RTX Corporation’s superpower lies in its robust top-line and earnings momentum, propelled by consistent innovation and operational growth. However, its declining return on invested capital signals a point of vigilance for value creation. RTX might suit aggressive growth portfolios willing to embrace cyclicality and execution risks.
General Dynamics commands a durable competitive moat, demonstrated by steadily growing ROIC above its cost of capital. Its conservative balance sheet and superior profitability offer a safer profile than RTX. GD fits well within GARP portfolios seeking stable growth with reasonable valuation multiples.
If you prioritize dynamic growth and can tolerate margin pressure, RTX presents an appealing scenario with accelerating earnings but fading capital efficiency. However, if you seek durability and capital discipline, General Dynamics outshines by delivering better stability and a proven value-creating model, albeit at a premium. Both merit consideration depending on your risk tolerance and investment horizon.
Disclaimer: Investment carries a risk of loss of initial capital. The past performance is not a reliable indicator of future results. Be sure to understand risks before making an investment decision.
Go Further
I encourage you to read the complete analyses of RTX Corporation and General Dynamics Corporation to enhance your investment decisions: