Home > Comparison > Industrials > GD vs NOC
The strategic rivalry between General Dynamics Corporation and Northrop Grumman Corporation shapes the aerospace and defense sector’s direction. General Dynamics operates as a diversified industrial powerhouse with integrated marine, combat, and technology segments. In contrast, Northrop Grumman focuses on advanced aerospace systems and cyber-enabled defense solutions. This analysis evaluates which company’s operational model delivers superior risk-adjusted returns for diversified portfolios navigating the Industrials sector’s evolving landscape.
Table of contents
Companies Overview
General Dynamics and Northrop Grumman dominate the aerospace and defense sector with diversified, high-tech portfolios.
General Dynamics Corporation: Integrated Defense Innovator
General Dynamics commands the aerospace and defense space through diverse segments: Aerospace, Marine Systems, Combat Systems, and Technologies. It generates revenue by manufacturing business jets, naval ships, combat vehicles, and delivering IT and mission support services. In 2026, the company sharpens its focus on advanced technologies like AI, cloud computing, and unmanned systems to sustain competitive advantage.
Northrop Grumman Corporation: Aerospace & Systems Powerhouse
Northrop Grumman excels by designing and manufacturing aeronautics, defense, mission, and space systems. Its revenue stems from aircraft systems, weapons, cyber solutions, and missile defense products. The company prioritizes innovation in hypersonic propulsion, cyber systems, and satellite technologies for 2026, reinforcing its strategic edge in integrated defense solutions.
Strategic Collision: Similarities & Divergences
Both firms emphasize advanced defense technologies but diverge in focus: General Dynamics blends manufacturing with IT services, while Northrop Grumman leads in aerospace and space systems. Their primary battleground lies in military aerospace and mission-critical systems. Investors face contrasting profiles: General Dynamics offers a broad industrial base, whereas Northrop Grumman presents a more concentrated play on aerospace innovation.
Income Statement Comparison
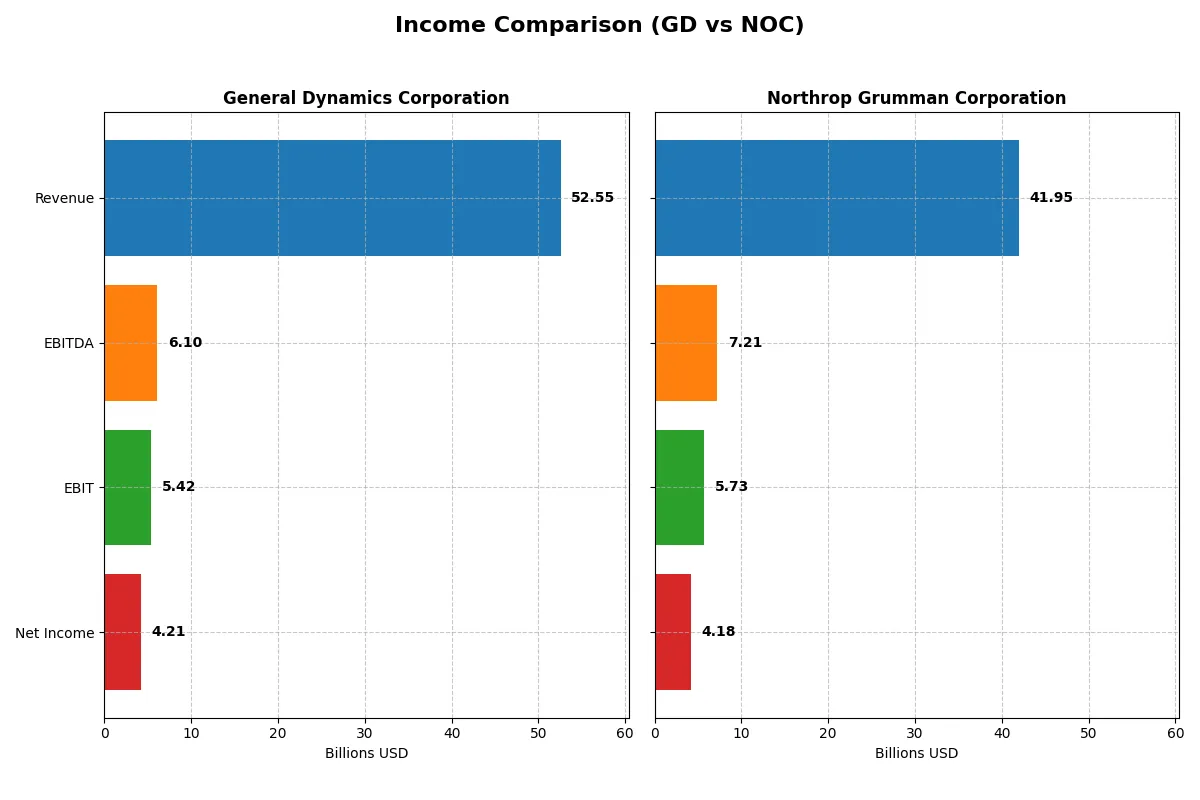
The following data dissects the core profitability and scalability of both corporate engines to reveal who dominates the bottom line:
| Metric | General Dynamics Corporation (GD) | Northrop Grumman Corporation (NOC) |
|---|---|---|
| Revenue | 52.6B | 41.9B |
| Cost of Revenue | 44.6B | 33.6B |
| Operating Expenses | 2.6B | 4.0B |
| Gross Profit | 7.9B | 8.3B |
| EBITDA | 6.1B | 7.2B |
| EBIT | 5.4B | 5.7B |
| Interest Expense | 314M | 665M |
| Net Income | 4.2B | 4.2B |
| EPS | 15.64 | 29.14 |
| Fiscal Year | 2025 | 2025 |
Income Statement Analysis: The Bottom-Line Duel
This income statement comparison will reveal which company demonstrates superior operational efficiency and profitability in the defense sector.
General Dynamics Corporation Analysis
General Dynamics steadily grew revenue from 38.5B in 2021 to 52.6B in 2025, boosting net income from 3.3B to 4.2B. Its gross margin remains stable near 15%, while net margin improves to 8%, signaling efficient cost control. The 2025 year shows strong momentum with a 10% revenue gain and 13% EPS growth, underscoring solid operational leverage.
Northrop Grumman Corporation Analysis
Northrop Grumman’s revenue rose from 35.7B in 2021 to 41.9B in 2025, but net income fell sharply from 7.0B to 4.2B. Gross margin exceeds 19%, and net margin nears 10%, reflecting higher profitability per dollar earned. However, recent revenue growth slowed to 2%, and net income declines suggest challenges sustaining earnings despite strong margins.
Margin Stability vs. Earnings Growth
General Dynamics outpaces Northrop Grumman in revenue and net income growth over five years, with expanding margins and improved EPS. Northrop Grumman boasts higher profitability ratios but suffers from declining net income and slower top-line growth. For investors prioritizing consistent growth and operational efficiency, General Dynamics presents a more compelling income trajectory.
Financial Ratios Comparison
These vital ratios act as a diagnostic tool to expose the underlying fiscal health, valuation premiums, and capital efficiency of the companies compared below:
| Ratios | General Dynamics Corporation (GD) | Northrop Grumman Corporation (NOC) |
|---|---|---|
| ROE | 16.4% | 25.1% |
| ROIC | 10.7% | 9.9% |
| P/E | 21.6 | 19.6 |
| P/B | 3.55 | 4.91 |
| Current Ratio | 1.44 | 1.10 |
| Quick Ratio | 0.89 | 1.10 |
| D/E | 0.31 | 0.11 |
| Debt-to-Assets | 14.0% | 3.6% |
| Interest Coverage | 17.1 | -6.8 |
| Asset Turnover | 0.92 | 0.82 |
| Fixed Asset Turnover | 6.98 | 3.27 |
| Payout ratio | 37.8% | 30.9% |
| Dividend yield | 1.75% | 1.58% |
| Fiscal Year | 2025 | 2025 |
Efficiency & Valuation Duel: The Vital Signs
Financial ratios serve as a company’s DNA, exposing hidden risks and operational strengths critical for sound investment decisions.
General Dynamics Corporation
General Dynamics posts a solid 16.43% ROE and favorable 10.66% ROIC well above its 5.55% WACC, signaling efficient capital use. Its P/E of 21.58 appears fair, though a high 3.55 PB ratio suggests valuation stretch. The 1.75% dividend yield reflects steady shareholder returns over reinvestment in R&D.
Northrop Grumman Corporation
Northrop Grumman delivers a robust 25.08% ROE but a slightly weaker 9.93% ROIC versus WACC at 4.47%, indicating moderate capital efficiency. The P/E ratio is reasonable at 19.57, though a 4.91 PB ratio points to valuation premium. Its 1.58% dividend yield complements a balanced payout and growth strategy.
Premium Valuation vs. Operational Efficiency
Both firms show slightly favorable ratio profiles with balanced risk and reward. General Dynamics offers stronger capital returns relative to cost of capital, while Northrop Grumman commands a premium valuation on higher ROE. Investors seeking operational efficiency may prefer General Dynamics; those valuing growth and yield might lean toward Northrop Grumman.
Which one offers the Superior Shareholder Reward?
I compare General Dynamics (GD) and Northrop Grumman (NOC) by examining their dividend yields, payout ratios, and share buyback intensity. GD yields 1.75% with a 38% payout ratio, showing solid free cash flow coverage and a steady buyback program. NOC yields 1.58% with a lower 31% payout ratio but boasts a more aggressive buyback and reinvestment in growth. GD’s model balances income with capital return sustainably. NOC targets growth with higher cash flow reinvestment but at a slightly riskier leverage level. For 2026, I favor GD for a superior total return profile due to its disciplined capital allocation and consistent shareholder rewards.
Comparative Score Analysis: The Strategic Profile
The radar chart reveals the fundamental DNA and trade-offs of both firms, highlighting their core financial strengths and valuation strategies:
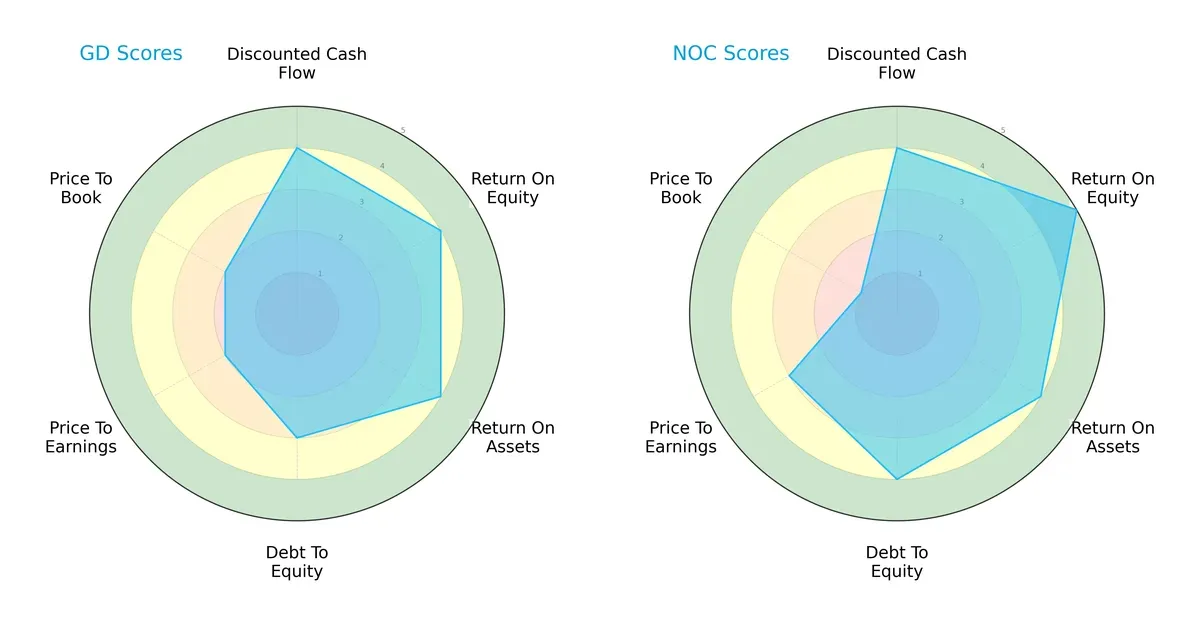
General Dynamics shows a balanced profile with solid scores in DCF, ROE, ROA, and moderate debt management but weaker valuation metrics. Northrop Grumman excels in profitability and financial stability, with a top ROE and better debt control, yet faces valuation pressure with a very unfavorable price-to-book score. Northrop Grumman holds a more distinct competitive edge, while General Dynamics offers steadier overall balance.
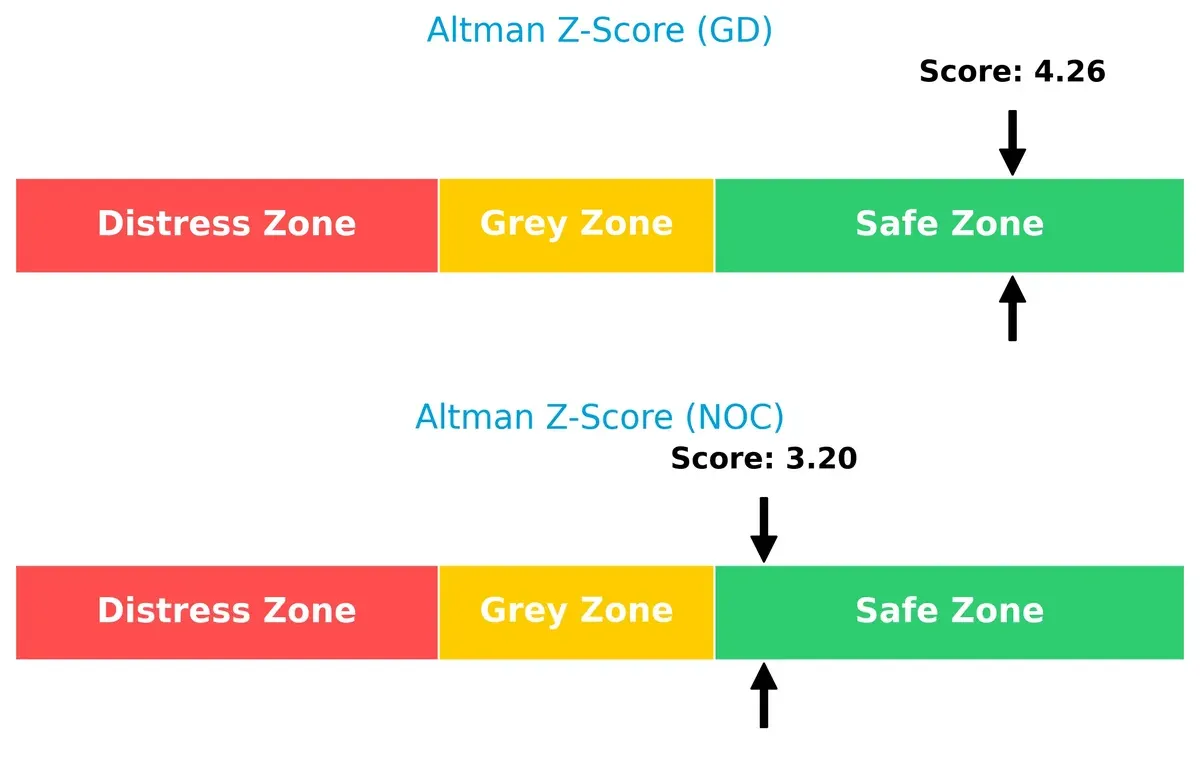
Bankruptcy Risk: Solvency Showdown
Both firms sit comfortably in the safe zone, with General Dynamics at 4.26 and Northrop Grumman at 3.20. This implies robust solvency and low bankruptcy risk in the current market cycle:
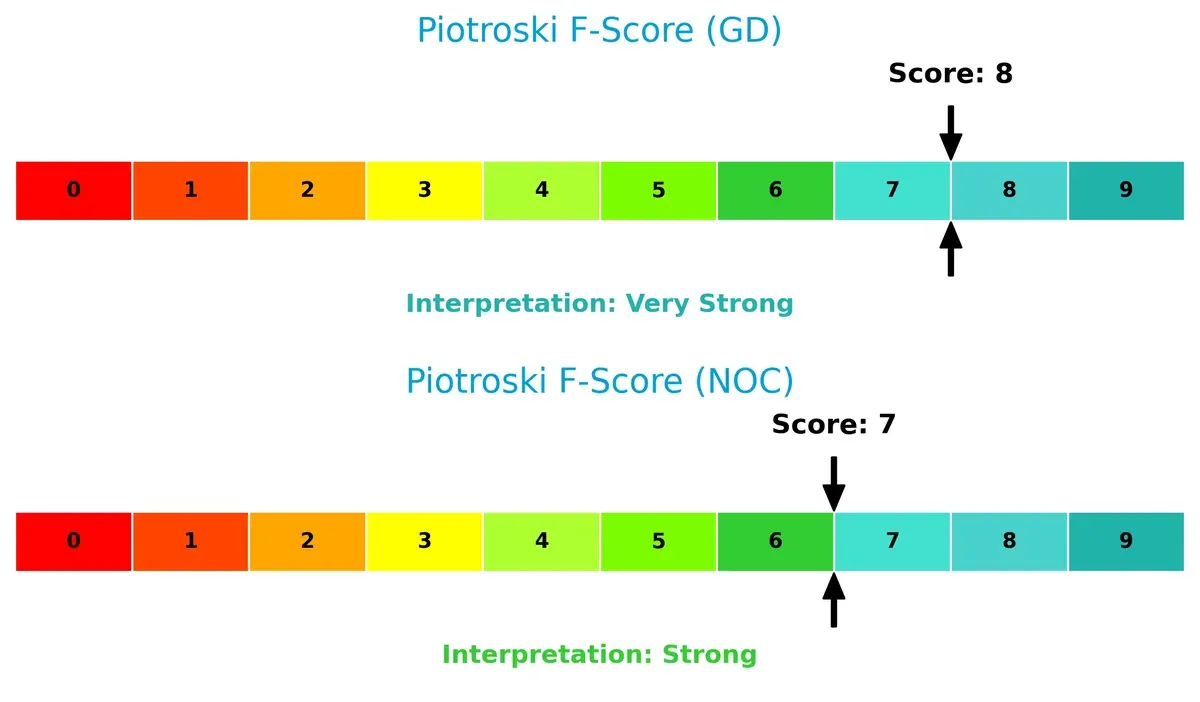
Financial Health: Quality of Operations
General Dynamics scores an 8, marking very strong financial health, while Northrop Grumman’s 7 indicates strong but slightly less robust internal metrics. Neither shows red flags, but General Dynamics edges ahead in operational quality:
How are the two companies positioned?
This section dissects GD and NOC’s operational DNA by comparing their revenue distribution and internal strengths and weaknesses. The goal is to confront their economic moats to identify which model offers the most resilient, sustainable competitive advantage today.
Revenue Segmentation: The Strategic Mix
This visual comparison dissects how General Dynamics and Northrop Grumman diversify their income streams and where their primary sector bets lie:
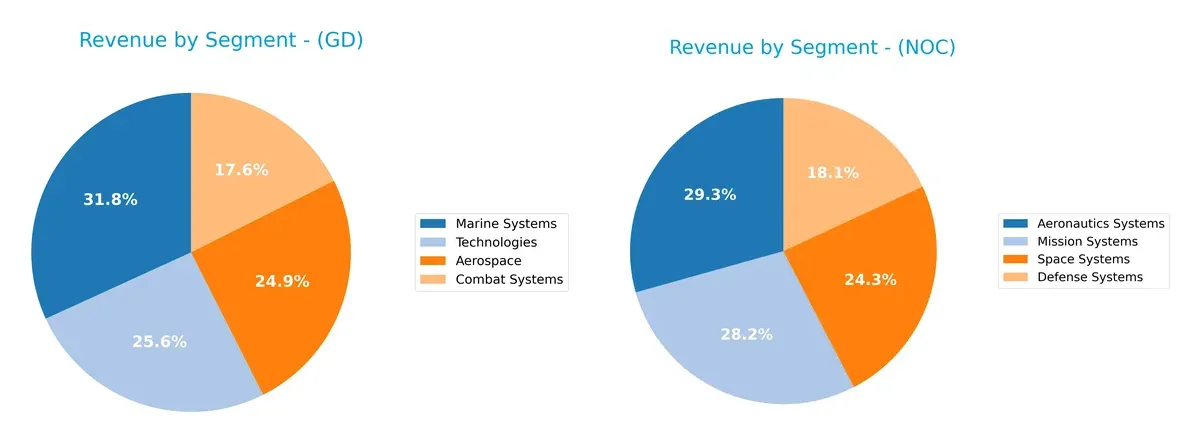
General Dynamics anchors revenue in Marine Systems at $16.7B, with Aerospace and Technologies close behind, reflecting a balanced portfolio. Northrop Grumman pivots around Aeronautics Systems ($13B) and Mission Systems ($12.5B), but also counts on Space Systems ($10.8B). GD’s mix mitigates concentration risk with four strong pillars. NOC leans on aerospace and mission-critical systems, exposing it to sector-specific cycles despite diversification across defense domains.
Strengths and Weaknesses Comparison
This table compares the Strengths and Weaknesses of General Dynamics Corporation and Northrop Grumman Corporation:
General Dynamics Corporation Strengths
- Diverse revenue streams across Aerospace, Combat, Marine, and Technologies
- Strong ROE at 16.43% and ROIC at 10.66%, exceeding WACC of 5.55%
- Favorable debt metrics with D/E of 0.31 and 14% debt to assets
- High fixed asset turnover at 6.98 indicating efficient asset use
Northrop Grumman Corporation Strengths
- Balanced segment revenues including Aeronautics, Mission, Defense, and Space Systems
- Higher ROE at 25.08% with favorable WACC of 4.47%, though ROIC at 9.93% is neutral
- Strong liquidity ratios including quick ratio of 1.1
- Low leverage with D/E of 0.11 and 3.61% debt to assets
- Solid fixed asset turnover at 3.27
General Dynamics Corporation Weaknesses
- Price-to-book ratio at 3.55 is unfavorable, indicating potential overvaluation
- Neutral net margin at 8.01% and asset turnover of 0.92 could limit profitability expansion
- Quick ratio below 1 at 0.89 signals moderate liquidity constraints
Northrop Grumman Corporation Weaknesses
- Price-to-book ratio at 4.91 is unfavorable, suggesting valuation concerns
- Interest coverage at 8.62, though favorable, is lower than GD’s 17.25
- Asset turnover at 0.82 is neutral and lower than GD’s, indicating less efficient asset use
Both companies demonstrate slightly favorable financial profiles with solid profitability and manageable debt. However, valuation metrics and asset efficiency highlight areas requiring strategic focus to maintain competitive positioning.
The Moat Duel: Analyzing Competitive Defensibility
A structural moat is the only true shield protecting long-term profits from relentless competition erosion. Let’s dissect the moats of two aerospace giants:
General Dynamics Corporation: Diversified Defense Moat
General Dynamics leverages intangible assets and integrated defense platforms, reflected in a very favorable ROIC 5.1% above WACC and growing profitability. Expansion into AI and undersea vehicles could deepen this moat in 2026.
Northrop Grumman Corporation: Specialized Aerospace Moat
Northrop Grumman relies on advanced aerospace technology and strategic defense contracts, showing value creation with ROIC 5.5% above WACC but a concerning declining ROIC trend. Market disruptions and hypersonics offer growth, though margin pressure looms.
Integrated Platforms vs. Technology Leadership: The Moat Face-Off
General Dynamics boasts a wider, durable moat with expanding returns and diversification. Northrop Grumman creates value but faces shrinking profitability. GD stands better poised to defend and grow its market share through 2026.
Which stock offers better returns?
The past year shows strong upward momentum for both stocks, with Northrop Grumman accelerating sharply and General Dynamics maintaining steady gains.
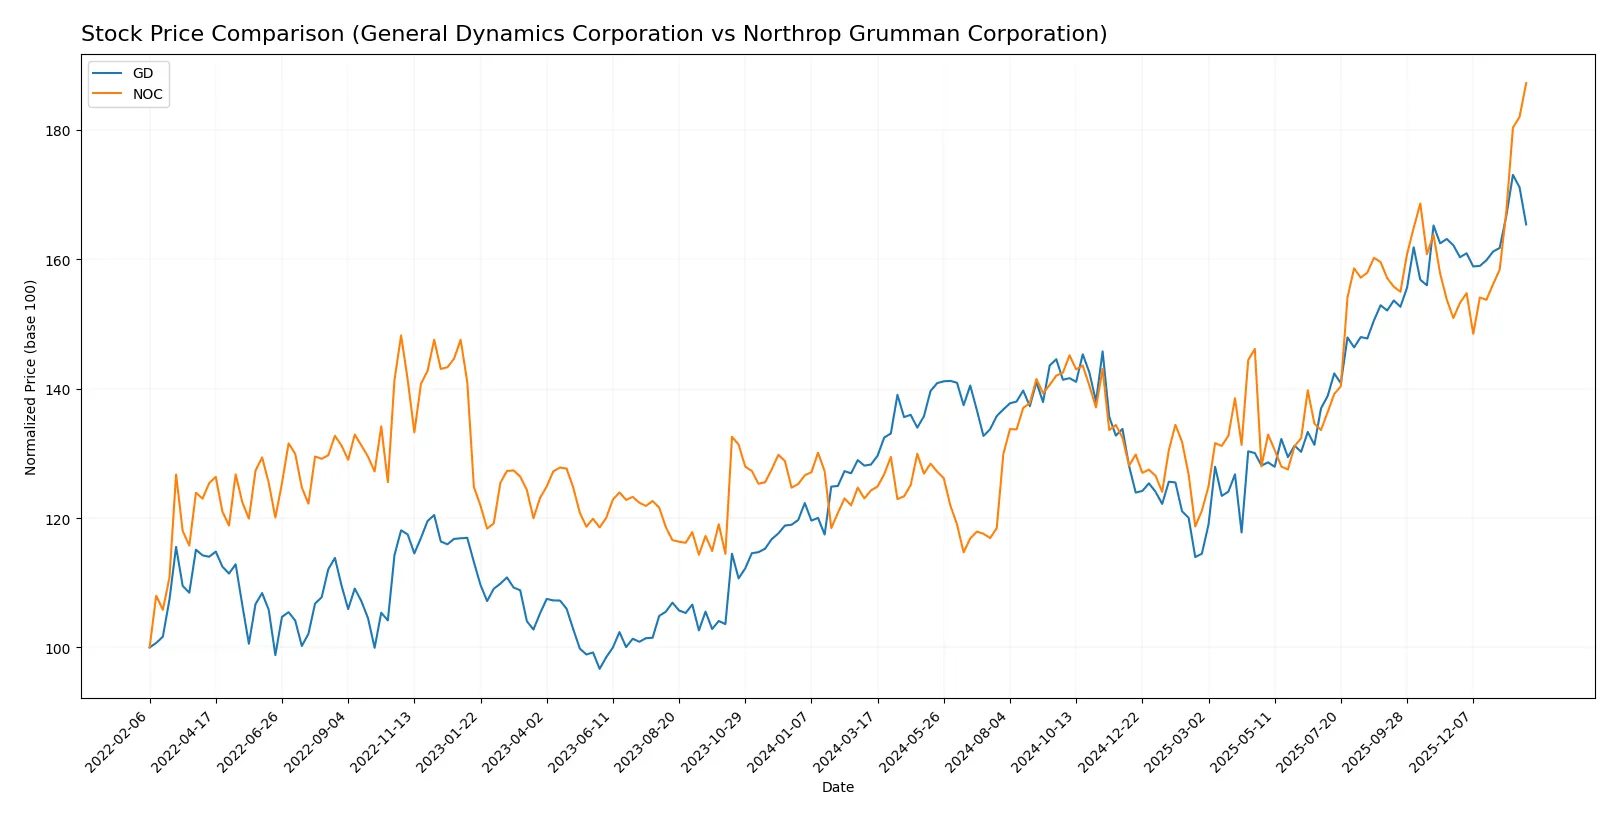
Trend Comparison
General Dynamics posted a 28.93% price increase over 12 months, reflecting a bullish trend with acceleration and a high of 367.38. Recent movement is neutral with a 1.99% gain.
Northrop Grumman surged 50.66% over the same period, also bullish with acceleration, hitting a 692.26 peak. Recent gains accelerated further by 24.06%, signaling strong momentum.
Northrop Grumman outperformed General Dynamics by a wide margin in the past year, delivering the highest market returns and stronger recent price acceleration.
Target Prices
Analysts present a bullish consensus for both General Dynamics Corporation and Northrop Grumman Corporation.
| Company | Target Low | Target High | Consensus |
|---|---|---|---|
| General Dynamics Corporation | 385 | 444 | 404.22 |
| Northrop Grumman Corporation | 623 | 815 | 732.25 |
The target consensus for GD at 404.22 suggests upside from the current price of 351.09. NOC’s consensus of 732.25 implies a moderate premium over the current 692.26, reflecting confidence in growth potential.

Don’t Let Luck Decide Your Entry Point
Optimize your entry points with our advanced ProRealTime indicators. You’ll get efficient buy signals with precise price targets for maximum performance. Start outperforming now!
How do institutions grade them?
General Dynamics Corporation Grades
Here are the recent grades assigned to General Dynamics Corporation by major grading companies:
| Grading Company | Action | New Grade | Date |
|---|---|---|---|
| B of A Securities | Maintain | Buy | 2026-01-30 |
| UBS | Maintain | Neutral | 2026-01-15 |
| Citigroup | Maintain | Neutral | 2026-01-13 |
| JP Morgan | Maintain | Overweight | 2025-12-19 |
| Morgan Stanley | Upgrade | Overweight | 2025-12-16 |
| JP Morgan | Maintain | Overweight | 2025-10-28 |
| B of A Securities | Maintain | Buy | 2025-10-28 |
| Bernstein | Maintain | Market Perform | 2025-10-28 |
| JP Morgan | Maintain | Overweight | 2025-10-27 |
| Susquehanna | Maintain | Positive | 2025-10-27 |
Northrop Grumman Corporation Grades
Below are the recent grades assigned to Northrop Grumman Corporation by major grading companies:
| Grading Company | Action | New Grade | Date |
|---|---|---|---|
| B of A Securities | Maintain | Buy | 2026-01-28 |
| BTIG | Maintain | Buy | 2026-01-28 |
| UBS | Maintain | Buy | 2026-01-28 |
| RBC Capital | Maintain | Outperform | 2026-01-28 |
| Citigroup | Maintain | Buy | 2026-01-28 |
| UBS | Maintain | Buy | 2026-01-15 |
| Citigroup | Maintain | Buy | 2026-01-13 |
| Truist Securities | Downgrade | Hold | 2026-01-09 |
| Morgan Stanley | Maintain | Overweight | 2025-12-16 |
| Alembic Global | Upgrade | Overweight | 2025-12-15 |
Which company has the best grades?
Northrop Grumman consistently receives stronger buy and outperform ratings compared to General Dynamics, which shows more mixed neutral and overweight grades. This may signal higher institutional confidence in Northrop Grumman’s outlook, potentially attracting more investor interest.
Risks specific to each company
The following categories identify the critical pressure points and systemic threats facing both firms in the 2026 market environment:
1. Market & Competition
General Dynamics Corporation
- Faces intense competition in diversified aerospace and defense segments, relying heavily on U.S. Navy contracts.
Northrop Grumman Corporation
- Strong presence in advanced aerospace and defense, but competition in emerging tech and space systems is fierce.
2. Capital Structure & Debt
General Dynamics Corporation
- Maintains moderate leverage with debt-to-assets at 14%, and strong interest coverage of 17.25x.
Northrop Grumman Corporation
- Exhibits lower leverage at 3.6% debt-to-assets, but interest coverage is half that of GD at 8.62x, signaling tighter debt service capacity.
3. Stock Volatility
General Dynamics Corporation
- Beta of 0.41 suggests low volatility relative to the market, offering defensive qualities.
Northrop Grumman Corporation
- Extremely low beta of 0.05 indicates minimal sensitivity to market swings, appealing to risk-averse investors.
4. Regulatory & Legal
General Dynamics Corporation
- Subject to stringent U.S. defense regulations and export controls; litigation risk is moderate.
Northrop Grumman Corporation
- Faces comparable regulatory scrutiny with added exposure in missile defense and space sectors, increasing compliance complexity.
5. Supply Chain & Operations
General Dynamics Corporation
- Complex global supply chains for naval and combat systems could face disruptions amid geopolitical tensions.
Northrop Grumman Corporation
- Relies on sophisticated components for aerospace and space systems; supply chain resilience is critical but challenging.
6. ESG & Climate Transition
General Dynamics Corporation
- ESG initiatives progressing but defense manufacturing’s carbon footprint remains a challenge.
Northrop Grumman Corporation
- Accelerating investments in sustainable technologies, yet climate transition risks persist in aerospace propulsion.
7. Geopolitical Exposure
General Dynamics Corporation
- Heavy dependence on U.S. defense budgets; geopolitical shifts could impact contract renewals.
Northrop Grumman Corporation
- Similar U.S. reliance, with additional exposure to international space collaboration and missile defense programs.
Which company shows a better risk-adjusted profile?
General Dynamics’ main risk is supply chain complexity in naval and combat systems amid geopolitical instability. Northrop Grumman faces greater regulatory and operational risks tied to advanced aerospace and space technologies. Despite both scoring well on financial health, Northrop’s superior ROE and debt profile give it a slightly better risk-adjusted profile. Its very low beta and strong Altman Z-score confirm robust stability. However, Northrop’s very unfavorable price-to-book ratio signals valuation risk that investors must heed.
Final Verdict: Which stock to choose?
General Dynamics Corporation’s superpower lies in its durable competitive advantage, demonstrated by steadily growing returns on invested capital. Its disciplined capital allocation and efficient asset use position it as a reliable value creator. A point of vigilance is its moderate price-to-book ratio, which may temper upside. It suits investors seeking steady, long-term growth with manageable risk.
Northrop Grumman Corporation commands a strategic moat through its strong return on equity and recurring revenue safety, underpinned by solid cash flow generation and conservative leverage. Compared to General Dynamics, it offers greater financial stability but faces headwinds from declining ROIC trends. This stock fits investors who favor growth at a reasonable price with a defensive bent.
If you prioritize consistent value creation with improving profitability, General Dynamics outshines due to its expanding moat and robust cash conversion. However, if you seek a blend of growth and stability anchored by strong equity returns, Northrop Grumman offers better stability despite a less favorable ROIC trend. Both carry risks, so matching your portfolio strategy to these profiles is key.
Disclaimer: Investment carries a risk of loss of initial capital. The past performance is not a reliable indicator of future results. Be sure to understand risks before making an investment decision.
Go Further
I encourage you to read the complete analyses of General Dynamics Corporation and Northrop Grumman Corporation to enhance your investment decisions: