Home > Comparison > Industrials > LMT vs GD
The strategic rivalry between Lockheed Martin Corporation and General Dynamics Corporation shapes the aerospace and defense sector’s future. Lockheed Martin operates as an integrated aerospace giant with a focus on advanced technology systems and space solutions. General Dynamics balances aerospace manufacturing with a strong marine and combat systems presence. This analysis will assess which business model offers superior risk-adjusted returns for a diversified portfolio amid evolving defense priorities.

Table of contents
Companies Overview
Lockheed Martin and General Dynamics dominate the aerospace and defense sector with complementary strengths and strategic focus.
Lockheed Martin Corporation: Aerospace & Defense Powerhouse
Lockheed Martin leads as a global aerospace and defense giant. Its core revenue derives from aircraft, missile systems, and space technologies. In 2026, it focuses on integrating advanced space and cyber solutions, enhancing its position in national security and defense innovation.
General Dynamics Corporation: Diversified Defense Innovator
General Dynamics stands out as a diverse aerospace and defense manufacturer. Revenue flows from business jets, naval ships, combat vehicles, and high-tech mission systems. Its 2026 strategy emphasizes modernization services and advanced IT solutions, including AI and cloud computing for military and federal clients.
Strategic Collision: Similarities & Divergences
Lockheed Martin favors a technology integration and space-centric approach, while General Dynamics pursues a broader platform mix from jets to submarines. They compete primarily in defense contracts and modernization programs. Lockheed Martin offers a tech-heavy investment profile; General Dynamics presents a diversified industrial defense play.
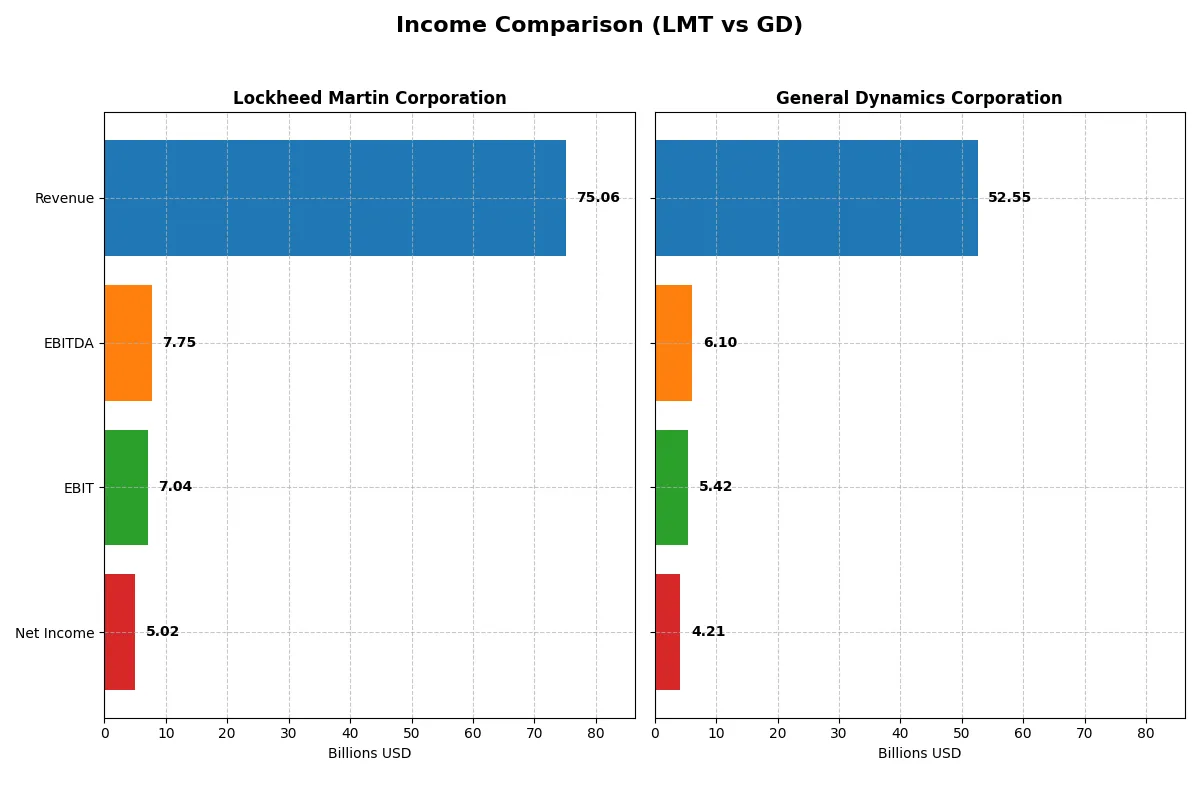
Income Statement Comparison
The following data dissects the core profitability and scalability of both corporate engines to reveal who dominates the bottom line:
| Metric | Lockheed Martin (LMT) | General Dynamics (GD) |
|---|---|---|
| Revenue | 75B | 53B |
| Cost of Revenue | 67B | 45B |
| Operating Expenses | -103M | 2.6B |
| Gross Profit | 7.6B | 7.9B |
| EBITDA | 7.8B | 6.1B |
| EBIT | 7.0B | 5.4B |
| Interest Expense | 1.1B | 314M |
| Net Income | 5.0B | 4.2B |
| EPS | 21.56 | 15.64 |
| Fiscal Year | 2025 | 2025 |
Income Statement Analysis: The Bottom-Line Duel
This income statement comparison reveals which company converts revenue into profit most efficiently, highlighting true operational strength.
Lockheed Martin Corporation Analysis
Lockheed Martin’s revenue rose steadily to $75B in 2025, but net income declined to $5B, reflecting pressure on margins. Gross margin weakened to 10.15%, and net margin fell to 6.68%. The latest year shows slowing EBIT and EPS growth, signaling challenges in sustaining profitability despite stable top-line momentum.
General Dynamics Corporation Analysis
General Dynamics increased revenue sharply to $52.5B in 2025, with net income climbing to $4.2B. Gross margin held firm at 15.13%, while net margin improved to 8.01%. EBIT and EPS both advanced strongly, underpinning an efficient cost structure and robust profit expansion that highlights operational momentum.
Margin Efficiency vs. Growth Momentum
General Dynamics outperforms Lockheed Martin in margin quality and income growth, posting superior net margin and healthier EBIT progression. Lockheed Martin’s revenue scale is larger but its declining profitability poses a risk. General Dynamics’ profile suits investors seeking growth with margin discipline, while Lockheed Martin faces a tougher margin environment.
Financial Ratios Comparison
These vital ratios act as a diagnostic tool to expose the underlying fiscal health, valuation premiums, and capital efficiency of each company:
| Ratios | Lockheed Martin (LMT) | General Dynamics (GD) |
|---|---|---|
| ROE | 74.65% | 16.43% |
| ROIC | 17.39% | 10.66% |
| P/E | 22.26 | 21.58 |
| P/B | 16.62 | 3.55 |
| Current Ratio | 1.09 | 1.44 |
| Quick Ratio | 0.94 | 0.89 |
| D/E | 0.17 | 0.31 |
| Debt-to-Assets | 1.95% | 14.00% |
| Interest Coverage | 6.92 | 17.06 |
| Asset Turnover | 1.25 | 0.92 |
| Fixed Asset Turnover | 8.46 | 6.98 |
| Payout Ratio | 62.41% | 37.84% |
| Dividend Yield | 2.80% | 1.75% |
| Fiscal Year | 2025 | 2025 |
Efficiency & Valuation Duel: The Vital Signs
Ratios act as a company’s DNA, revealing hidden risks and operational excellence critical for investors’ decision-making.
Lockheed Martin Corporation
Lockheed Martin demonstrates strong profitability with a 74.65% ROE and efficient capital use at 17.39% ROIC, well above its 4.87% WACC. Its P/E of 22.26 is fairly valued, but a high P/B of 16.62 signals a stretched equity valuation. The 2.8% dividend yield rewards shareholders steadily.
General Dynamics Corporation
General Dynamics posts a moderate 16.43% ROE and a 10.66% ROIC, both favorable but notably below Lockheed Martin’s metrics. The P/E of 21.58 remains neutral, and a lower P/B of 3.55 suggests more reasonable valuation. Dividend yield at 1.75% offers modest income with a focus on stable operational cash flow.
Premium Profitability vs. Valuation Discipline
Lockheed Martin offers superior profitability and robust shareholder returns but trades at a more stretched valuation. General Dynamics balances moderate returns with a more conservative valuation. Investors favoring growth and high returns may prefer Lockheed Martin, while those prioritizing valuation safety might lean toward General Dynamics.
Which one offers the Superior Shareholder Reward?
I observe Lockheed Martin (LMT) offers a 2.8% dividend yield with a high payout ratio near 62%, supported by strong free cash flow coverage at 81%. Its buybacks remain significant, enhancing shareholder returns. General Dynamics (GD) yields 1.75%, with a lower payout of 38%, retaining more cash for reinvestment. GD’s buyback program is steady but less aggressive. Historically, LMT’s model balances dividends and buybacks sustainably, while GD emphasizes growth retention. For 2026, I favor Lockheed Martin’s total return profile due to its superior cash return and disciplined capital allocation.
Comparative Score Analysis: The Strategic Profile
The radar chart reveals the fundamental DNA and trade-offs of Lockheed Martin Corporation and General Dynamics Corporation:
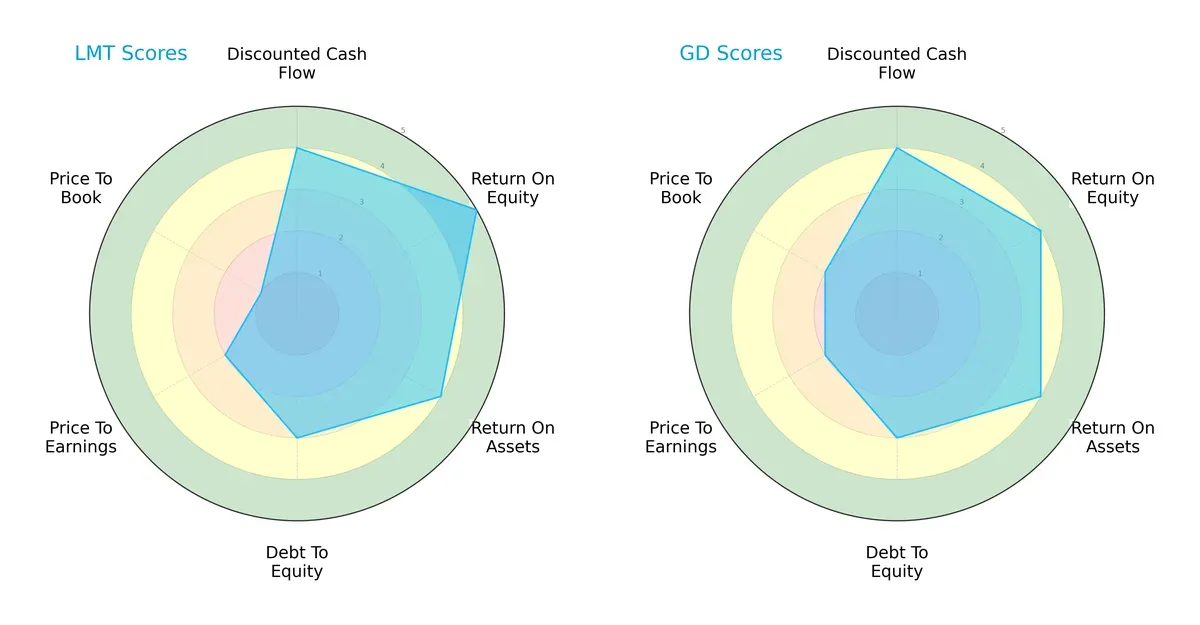
Lockheed Martin shows superior efficiency with a higher ROE (5 vs. 4) and slightly better ROA (4 vs. 4), signaling strong profit generation. Both firms share equal DCF and debt-to-equity scores (4 and 3), indicating similar valuation and leverage risks. General Dynamics holds a slight edge in price-to-book valuation (2 vs. 1), suggesting a more balanced valuation profile. Overall, Lockheed Martin relies on operational strength, while General Dynamics offers a steadier valuation mix.
Bankruptcy Risk: Solvency Showdown
The Altman Z-Score gap favors General Dynamics (4.26) over Lockheed Martin (3.69), both safely above 3, signaling solid long-term solvency. This cushion is vital in the current volatile defense sector cycle:

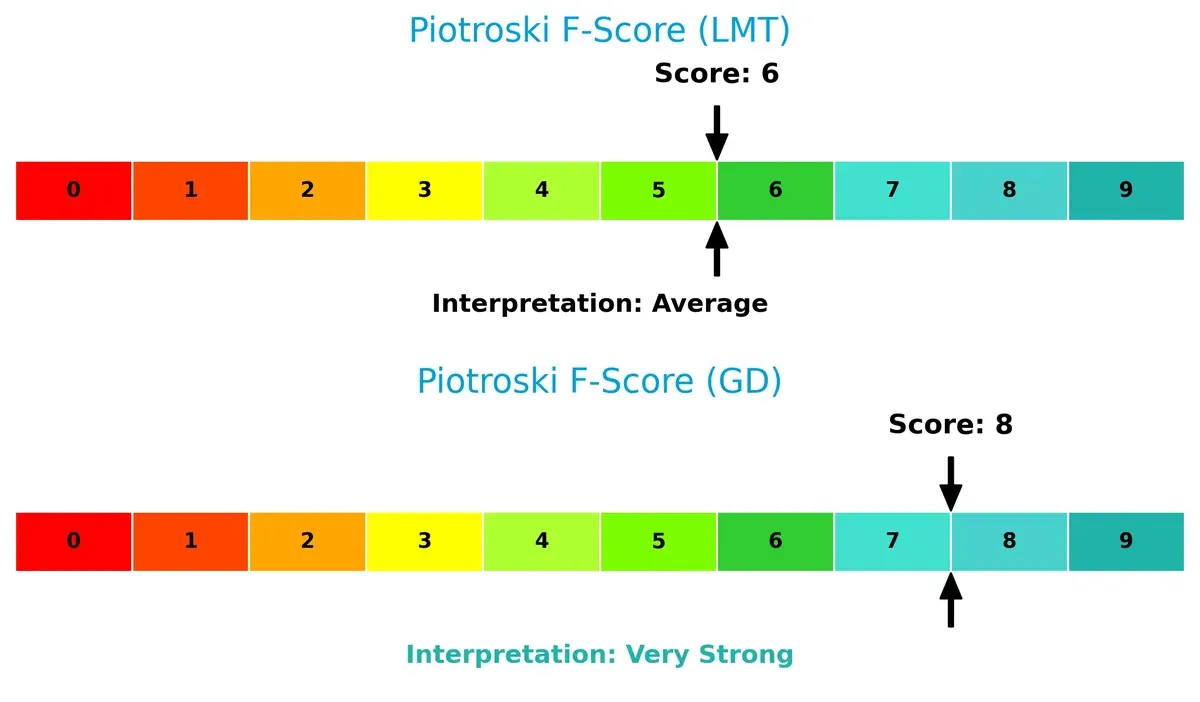
Financial Health: Quality of Operations
General Dynamics leads with a Piotroski F-Score of 8, indicating very strong financial health. Lockheed Martin scores 6, which is average, revealing potential red flags in operational efficiency and balance sheet quality:
How are the two companies positioned?
This section dissects the operational DNA of Lockheed Martin and General Dynamics by comparing their revenue distribution and internal dynamics. The goal is to confront their economic moats to identify which model offers the most resilient, sustainable competitive advantage today.
Revenue Segmentation: The Strategic Mix
This visual comparison dissects how Lockheed Martin and General Dynamics diversify their income streams and where their primary sector bets lie:
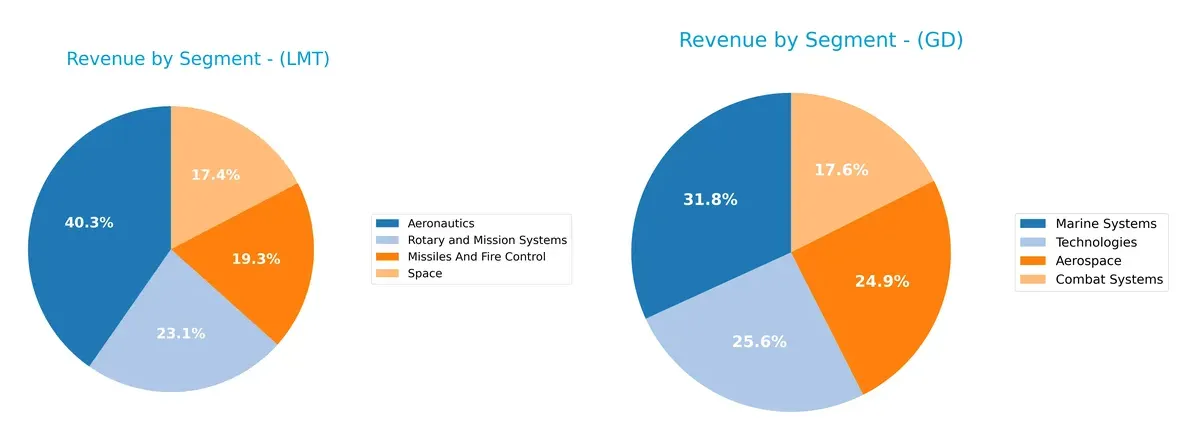
Lockheed Martin anchors its revenue in Aeronautics with $30.3B, followed by Rotary and Mission Systems at $17.3B. General Dynamics shows a more balanced mix, with Marine Systems leading at $16.7B and Technologies close behind at $13.5B. Lockheed Martin’s concentrated bets suggest strong ecosystem lock-in in aerospace, while General Dynamics’ spread reduces concentration risk but demands broader operational focus.
Strengths and Weaknesses Comparison
This table compares the Strengths and Weaknesses of Lockheed Martin Corporation and General Dynamics Corporation:
Lockheed Martin Strengths
- Diverse revenue from Aeronautics, Missiles, Rotary, and Space segments
- High ROE (74.65%) and ROIC (17.39%) indicating strong profitability
- Favorable cost of capital (WACC 4.87%) and low debt-to-assets (1.95%)
- Robust asset turnover (1.25) and fixed asset turnover (8.46)
- Significant global presence with strong US and Europe sales
General Dynamics Strengths
- Balanced revenue from Aerospace, Combat, Marine, and Technologies segments
- Favorable ROE (16.43%) and ROIC (10.66%) showing solid profitability
- Strong interest coverage (17.25) and manageable debt levels
- Broad geographic sales with dominant North America presence
- Stable P/E ratio (21.58) reflecting market valuation consistency
Lockheed Martin Weaknesses
- High price-to-book ratio (16.62) signals potential overvaluation risk
- Neutral net margin (6.68%) lags behind peers
- Moderate current (1.09) and quick ratios (0.94) indicate liquidity is adequate but not strong
- Dividend yield (2.8%) favorable but lower than historical highs
General Dynamics Weaknesses
- Lower dividend yield (1.75%) may indicate less income focus
- Neutral asset turnover (0.92) suggests less efficient use of assets
- Slightly higher debt-to-equity (0.31) versus LMT
- Net margin (8.01%) neutral and not outperforming sector leaders
Lockheed Martin shows exceptional profitability metrics and asset efficiency, supporting its leadership in capital allocation. General Dynamics offers revenue diversification with solid profitability and strong interest coverage, though with less efficiency in asset utilization. Both face valuation and margin challenges that require strategic attention.
The Moat Duel: Analyzing Competitive Defensibility
A structural moat remains the sole protector of long-term profits against relentless competitive pressures. Let’s dissect how Lockheed Martin and General Dynamics defend their turf:
Lockheed Martin Corporation: Intangible Assets & Integration Powerhouse
Lockheed Martin’s moat stems from its unmatched integration of advanced aerospace and defense systems. This delivers consistent ROIC above WACC, yet a declining trend signals caution in sustaining profitability. New space and missile defense contracts could deepen its moat or test it in 2026.
General Dynamics Corporation: Diversified Manufacturing & Innovation Edge
General Dynamics relies on diversified platforms spanning submarines to combat vehicles, driving growing ROIC and expanding margins. Unlike Lockheed, it shows rising profitability and operational leverage. Expansion into AI-enabled defense tech offers strong runway for market disruption in 2026.
Moat Strength Showdown: Integrated Systems vs. Diversified Manufacturing
General Dynamics holds the deeper moat with rising ROIC and margin growth, reflecting durable competitive advantage. Lockheed Martin creates value but faces pressure from declining returns. GD is better positioned to defend and grow market share in 2026.
Which stock offers better returns?
The past year shows strong price growth for both stocks, with Lockheed Martin accelerating sharply while General Dynamics gains more modestly.
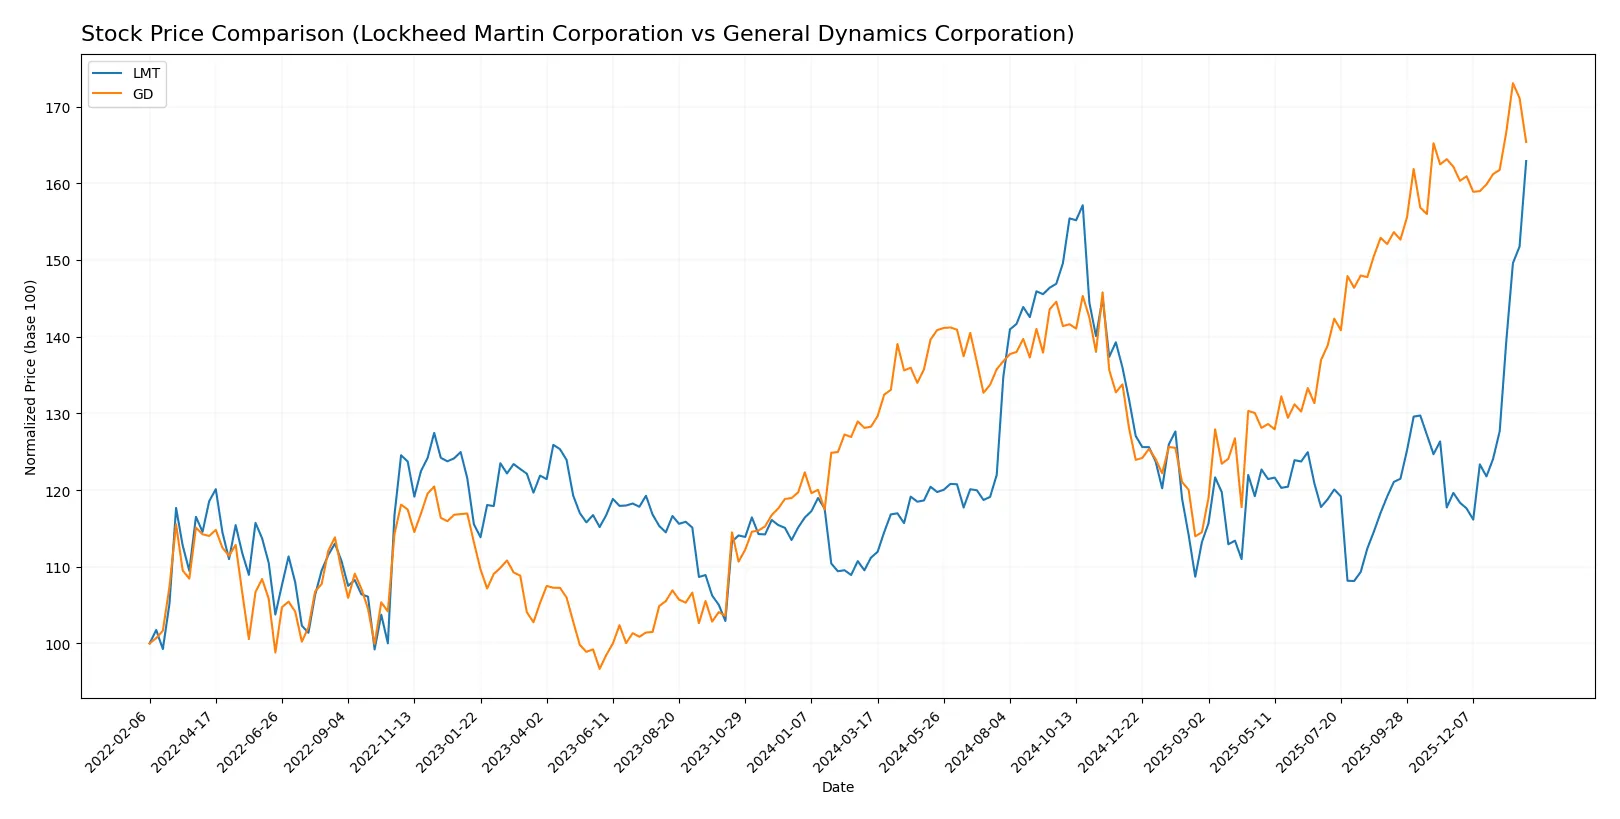
Trend Comparison
Lockheed Martin’s stock rose 46.5% over the past 12 months, showing a bullish trend with accelerating momentum and a high peak at 634.22.
General Dynamics gained 28.93% over the same period, also bullish with acceleration but at a lower volatility and a peak price of 367.38.
Lockheed Martin outperformed General Dynamics, delivering higher returns and stronger price acceleration throughout the year.
Target Prices
Analysts present a bullish consensus on Lockheed Martin and General Dynamics, reflecting confidence in aerospace and defense growth.
| Company | Target Low | Target High | Consensus |
|---|---|---|---|
| Lockheed Martin Corporation | 519 | 695 | 607.7 |
| General Dynamics Corporation | 385 | 444 | 404.22 |
Lockheed Martin’s consensus target of 607.7 slightly undervalues its current price of 634.22, signaling modest upside risk. General Dynamics’ target at 404.22 suggests significant upside from its 351.09 price, reflecting stronger growth expectations.

Don’t Let Luck Decide Your Entry Point
Optimize your entry points with our advanced ProRealTime indicators. You’ll get efficient buy signals with precise price targets for maximum performance. Start outperforming now!
How do institutions grade them?
The following tables summarize recent institutional grades for Lockheed Martin Corporation and General Dynamics Corporation:
Lockheed Martin Corporation Grades
Here are the latest grades assigned by reputable grading companies for Lockheed Martin:
| Grading Company | Action | New Grade | Date |
|---|---|---|---|
| RBC Capital | Maintain | Sector Perform | 2026-01-30 |
| TD Cowen | Maintain | Hold | 2026-01-30 |
| UBS | Maintain | Neutral | 2026-01-15 |
| Citigroup | Maintain | Neutral | 2026-01-13 |
| Jefferies | Maintain | Hold | 2026-01-12 |
| Truist Securities | Upgrade | Buy | 2026-01-09 |
| JP Morgan | Downgrade | Neutral | 2025-12-19 |
| Morgan Stanley | Downgrade | Equal Weight | 2025-12-16 |
| UBS | Maintain | Neutral | 2025-10-22 |
| Bernstein | Maintain | Market Perform | 2025-10-20 |
General Dynamics Corporation Grades
Below are recent grades from recognized grading firms for General Dynamics:
| Grading Company | Action | New Grade | Date |
|---|---|---|---|
| B of A Securities | Maintain | Buy | 2026-01-30 |
| UBS | Maintain | Neutral | 2026-01-15 |
| Citigroup | Maintain | Neutral | 2026-01-13 |
| JP Morgan | Maintain | Overweight | 2025-12-19 |
| Morgan Stanley | Upgrade | Overweight | 2025-12-16 |
| JP Morgan | Maintain | Overweight | 2025-10-28 |
| B of A Securities | Maintain | Buy | 2025-10-28 |
| Bernstein | Maintain | Market Perform | 2025-10-28 |
| JP Morgan | Maintain | Overweight | 2025-10-27 |
| Susquehanna | Maintain | Positive | 2025-10-27 |
Which company has the best grades?
General Dynamics consistently receives stronger grades, notably multiple Buy and Overweight ratings. Lockheed Martin’s grades cluster around Neutral and Hold, with fewer upgrades. This divergence may influence investor sentiment and portfolio positioning.
Risks specific to each company
The following categories identify the critical pressure points and systemic threats facing both firms in the 2026 market environment:
1. Market & Competition
Lockheed Martin Corporation
- Dominates key defense segments with strong U.S. government reliance but faces intense aerospace innovation pressures.
General Dynamics Corporation
- Competes in diverse defense and aerospace niches, challenged by Marine Systems complexity and business jet market volatility.
2. Capital Structure & Debt
Lockheed Martin Corporation
- Maintains low debt-to-equity (0.17) and strong interest coverage (6.3), signaling prudent leverage.
General Dynamics Corporation
- Higher debt-to-equity (0.31) but superior interest coverage (17.25) indicates manageable but elevated financial risk.
3. Stock Volatility
Lockheed Martin Corporation
- Low beta (0.245) reflects defensive stock behavior, reducing market risk exposure.
General Dynamics Corporation
- Moderately higher beta (0.414) suggests more sensitivity to market swings.
4. Regulatory & Legal
Lockheed Martin Corporation
- Faces stringent U.S. defense export controls and compliance demands; stable but with geopolitical scrutiny.
General Dynamics Corporation
- Confronts complex regulatory oversight in naval shipbuilding and federal contracts, increasing legal compliance risk.
5. Supply Chain & Operations
Lockheed Martin Corporation
- Complex, global supply chains for aerospace and missile systems vulnerable to disruption but mitigated by scale.
General Dynamics Corporation
- Diverse operations from submarines to IT systems increase operational complexity and supply chain risk.
6. ESG & Climate Transition
Lockheed Martin Corporation
- Increasing pressure to reduce emissions in aerospace manufacturing; active ESG initiatives underway.
General Dynamics Corporation
- Faces challenges in decarbonizing marine and combat systems; ESG progress essential for long-term licensing.
7. Geopolitical Exposure
Lockheed Martin Corporation
- Heavy reliance on U.S. government and allied foreign military sales exposes it to geopolitical policy shifts.
General Dynamics Corporation
- Exposure to geopolitical tensions through naval contracts and international defense sales adds volatility.
Which company shows a better risk-adjusted profile?
Lockheed Martin’s dominant market position and conservative leverage offer a more stable risk-adjusted profile. General Dynamics’ higher operational complexity and debt elevate its risk, despite strong interest coverage and a very strong Piotroski score. Lockheed’s low beta and favorable capital structure mitigate volatility more effectively. Recent financials highlight Lockheed’s superior return on equity (74.65% vs. 16.43%), underscoring its efficient capital allocation as a key risk buffer.
Final Verdict: Which stock to choose?
Lockheed Martin’s superpower lies in its robust capital efficiency and strong return on equity, reflecting a cash-generative business with a solid economic moat. However, its declining profitability trend and stretched valuation on book value warrant caution. It suits portfolios targeting aggressive growth with a tolerance for cyclical swings.
General Dynamics boasts a durable competitive advantage with steadily improving ROIC and a safer balance sheet profile. Its strategic moat centers on operational stability and consistent free cash flow growth, offering relatively lower volatility than Lockheed Martin. It fits well in GARP (Growth at a Reasonable Price) portfolios seeking balanced risk and reward.
If you prioritize strong capital returns and can handle some profitability headwinds, Lockheed Martin outshines as the compelling choice due to its superior ROE and cash flow yield. However, if you seek better stability with a growing moat and steadier income growth, General Dynamics offers better safety and a more favorable earnings trajectory. Both scenarios require careful consideration of market cycles and individual risk tolerance.
Disclaimer: Investment carries a risk of loss of initial capital. The past performance is not a reliable indicator of future results. Be sure to understand risks before making an investment decision.
Go Further
I encourage you to read the complete analyses of Lockheed Martin Corporation and General Dynamics Corporation to enhance your investment decisions: