Home > Comparison > Industrials > GD vs LHX
The strategic rivalry between General Dynamics Corporation and L3Harris Technologies defines the current trajectory of the Aerospace & Defense sector. General Dynamics operates as a capital-intensive industrial giant with diversified segments including aerospace, marine, and combat systems. In contrast, L3Harris focuses on high-tech mission-critical solutions with emphasis on integrated systems and advanced communications. This head-to-head highlights a battle between broad manufacturing scale and specialized innovation. This analysis will identify which corporate path offers superior risk-adjusted returns for diversified portfolios.
Table of contents
Companies Overview
General Dynamics Corporation and L3Harris Technologies, Inc. stand as pivotal players in the aerospace and defense landscape in 2026.
General Dynamics Corporation: Aerospace & Defense Powerhouse
General Dynamics dominates as a diversified aerospace and defense company with four core segments: Aerospace, Marine Systems, Combat Systems, and Technologies. It generates revenue by manufacturing business jets, naval ships, combat vehicles, and advanced IT solutions. In 2026, its strategic focus remains on integrating cloud computing, AI, and unmanned systems to enhance military capabilities globally.
L3Harris Technologies, Inc.: Advanced Defense Technology Leader
L3Harris Technologies excels as a provider of mission-critical aerospace and defense technology. Its revenue stems from integrated mission systems, space and airborne systems, communication, and aviation solutions. The company prioritizes innovation in ISR, cyber defense, tactical communications, and autonomous maritime platforms, aiming to strengthen government and commercial client operations this year.
Strategic Collision: Similarities & Divergences
Both companies operate within aerospace and defense but differ in approach: General Dynamics embraces broad manufacturing and lifecycle support, while L3Harris focuses on advanced technology and electronic warfare solutions. The primary battleground is military modernization and digital transformation of defense systems. Their investment profiles diverge—General Dynamics offers diversification and scale, L3Harris emphasizes tech-driven growth and specialized innovation.
Income Statement Comparison
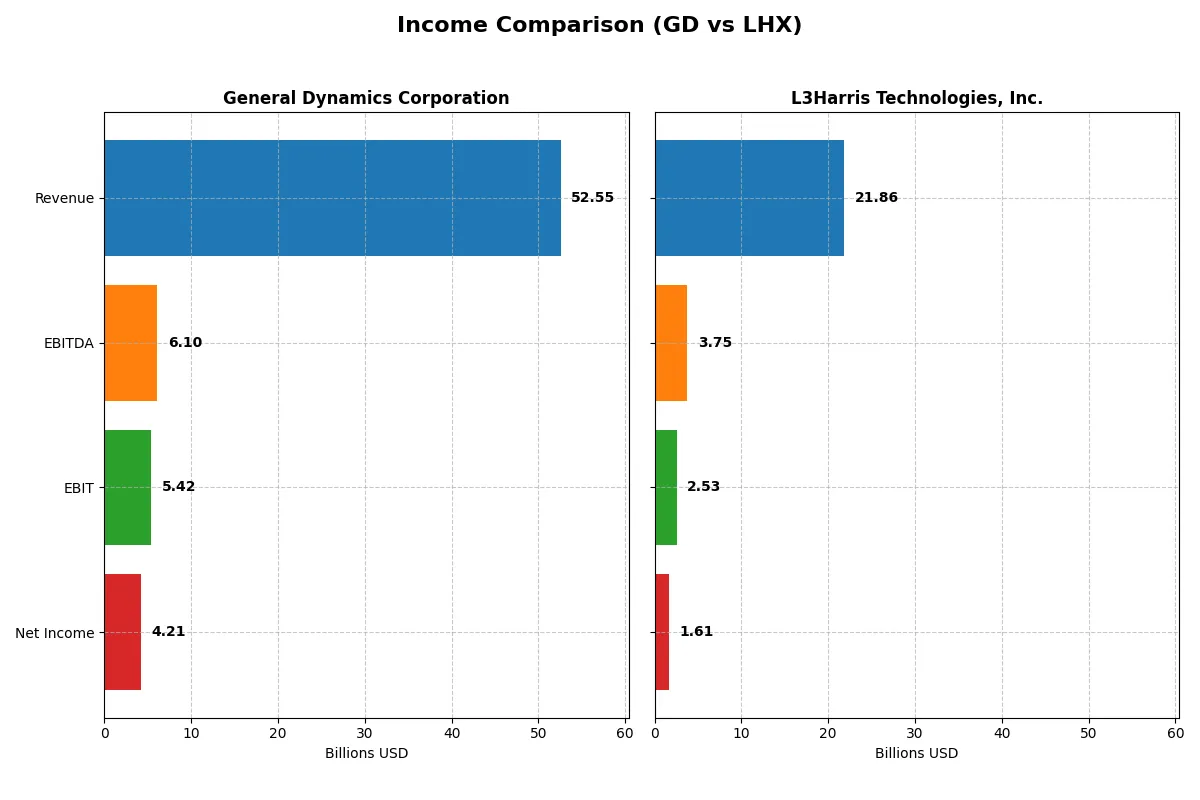
The following data dissects the core profitability and scalability of both corporate engines to reveal who dominates the bottom line:
| Metric | General Dynamics Corporation (GD) | L3Harris Technologies, Inc. (LHX) |
|---|---|---|
| Revenue | 52.6B | 21.9B |
| Cost of Revenue | 44.6B | 16.2B |
| Operating Expenses | 2.6B | 3.4B |
| Gross Profit | 7.95B | 5.63B |
| EBITDA | 6.1B | 3.75B |
| EBIT | 5.4B | 2.53B |
| Interest Expense | 314M | 597M |
| Net Income | 4.21B | 0 |
| EPS | 15.64 | 8.57 |
| Fiscal Year | 2025 | 2025 |
Income Statement Analysis: The Bottom-Line Duel
This income statement comparison reveals the true operational efficiency and growth momentum of two major defense contractors.
General Dynamics Corporation Analysis
General Dynamics steadily grows revenue from $38.5B in 2021 to $52.6B in 2025, with net income rising from $3.3B to $4.2B. The company sustains solid gross margins near 15% and improves net margin to 8%, signaling disciplined cost control. In 2025, strong EBIT growth of nearly 10% confirms robust profitability momentum and operational efficiency.
L3Harris Technologies, Inc. Analysis
L3Harris posts revenue growth from $17.8B in 2021 to $21.9B in 2025 but struggles with net income volatility, peaking at $1.8B in 2021 and falling to $0 in 2025 due to deductions. Its gross margin exceeds 25%, outperforming General Dynamics, and EBIT margin improves to 11.6%. Yet, net margin dips below 7.5%, reflecting margin pressure despite revenue gains.
Margin Strength vs. Growth Consistency
General Dynamics delivers consistent revenue and net income growth with stable margins, marking it a fundamentally sound performer. L3Harris boasts superior gross and EBIT margins but suffers from declining net income and margin compression. For investors prioritizing steady profit expansion, General Dynamics offers a more attractive profile grounded in operational resilience.
Financial Ratios Comparison
These vital ratios act as a diagnostic tool to expose the underlying fiscal health, valuation premiums, and capital efficiency of the companies compared below:
| Ratios | General Dynamics Corporation (GD) | L3Harris Technologies, Inc. (LHX) |
|---|---|---|
| ROE | 16.4% | 8.2% |
| ROIC | 10.7% | 5.4% |
| P/E | 21.6 | 34.3 |
| P/B | 3.55 | 2.80 |
| Current Ratio | 1.44 | 1.19 |
| Quick Ratio | 0.89 | 1.02 |
| D/E | 0.31 | 0.53 |
| Debt-to-Assets | 14.0% | 25.4% |
| Interest Coverage | 17.1 | 3.7 |
| Asset Turnover | 0.92 | 0.53 |
| Fixed Asset Turnover | 6.98 | 8.20 |
| Payout ratio | 37.8% | 56.2% |
| Dividend yield | 1.75% | 1.64% |
| Fiscal Year | 2025 | 2025 |
Efficiency & Valuation Duel: The Vital Signs
Financial ratios act as a company’s DNA, uncovering hidden operational strengths and risks behind headline figures. They decode profitability, valuation, and financial health in a distilled form.
General Dynamics Corporation
General Dynamics delivers a robust 16.4% ROE and favorable 10.7% ROIC, showing efficient capital use surpassing its 5.6% WACC. Its P/E of 21.6 is neutral, but a stretched P/B of 3.55 signals premium pricing. The 1.75% dividend yield reflects steady shareholder returns amid disciplined leverage and solid asset turnover.
L3Harris Technologies, Inc.
L3Harris posts a weaker 8.2% ROE and a neutral 5.4% ROIC against a higher 6.7% WACC, indicating tighter profitability. The stock trades expensive at a P/E of 34.3, with a moderate P/B of 2.8. Shareholder yield is modest at 1.64%, supported by a stronger quick ratio and cautious debt levels, but operational efficiency lags behind peers.
Operational Efficiency vs. Valuation Premium
General Dynamics offers a better balance of risk and reward, combining higher returns on capital with reasonable valuation metrics. L3Harris’s premium price demands stronger profitability to justify its multiple. Investors prioritizing steady capital efficiency may prefer General Dynamics, while those seeking growth at a premium might look toward L3Harris.
Which one offers the Superior Shareholder Reward?
I see General Dynamics (GD) offers a 1.75% dividend yield with a sustainable 38% payout ratio, supported by 77% FCF coverage. Its buybacks are moderate but steady, enhancing shareholder value. L3Harris (LHX) yields slightly less at 1.64% but pays out 56% of earnings and exhibits stronger buyback intensity. However, LHX’s higher payout ratio and lower free cash flow coverage signal more risk. GD’s balanced dividend and buyback strategy, backed by robust cash flow, suggests a more sustainable total return. I judge GD as the superior choice for 2026 investors seeking steady, risk-managed rewards.
Comparative Score Analysis: The Strategic Profile
The radar chart reveals the fundamental DNA and trade-offs of General Dynamics and L3Harris Technologies, highlighting their financial strengths and vulnerabilities:
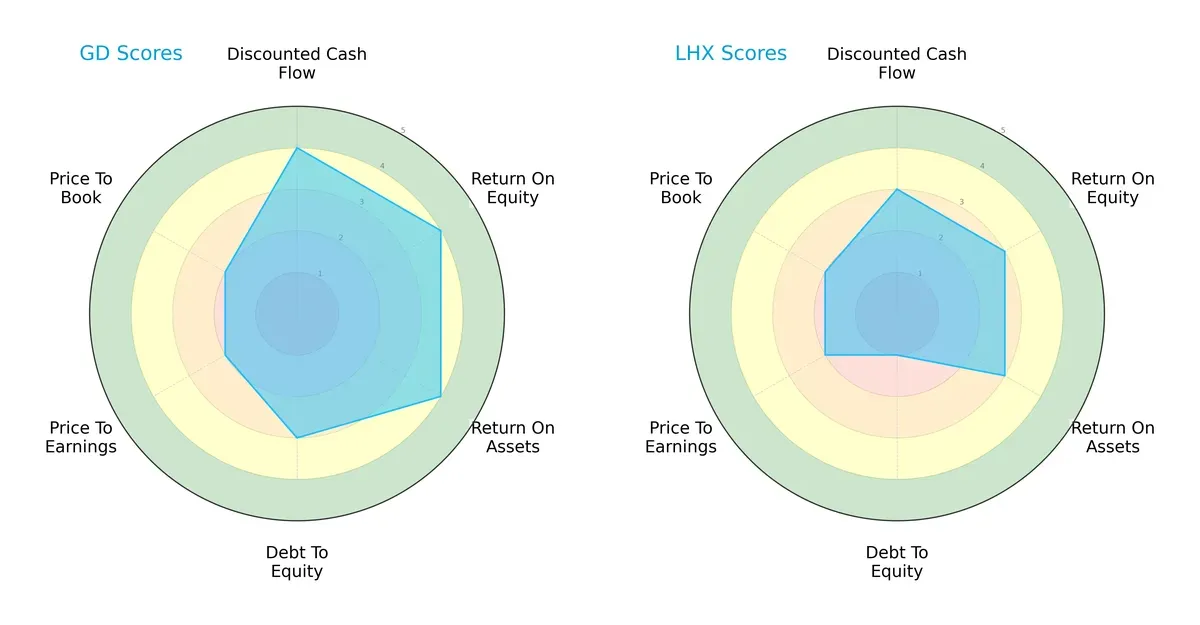
General Dynamics shows a balanced profile with strong DCF, ROE, and ROA scores (all at 4), indicating efficient capital allocation and profitability. Its moderate debt-to-equity score (3) signals prudent leverage management. L3Harris relies more on operational efficiency but carries a higher financial risk with a very unfavorable debt-to-equity score (1). Both firms share moderate valuation scores (PE and PB at 2), but General Dynamics offers a more stable investment base overall.
Bankruptcy Risk: Solvency Showdown
General Dynamics’ Altman Z-Score of 4.26 places it securely in the safe zone, while L3Harris’ 2.56 score signals moderate risk in the grey zone, implying:
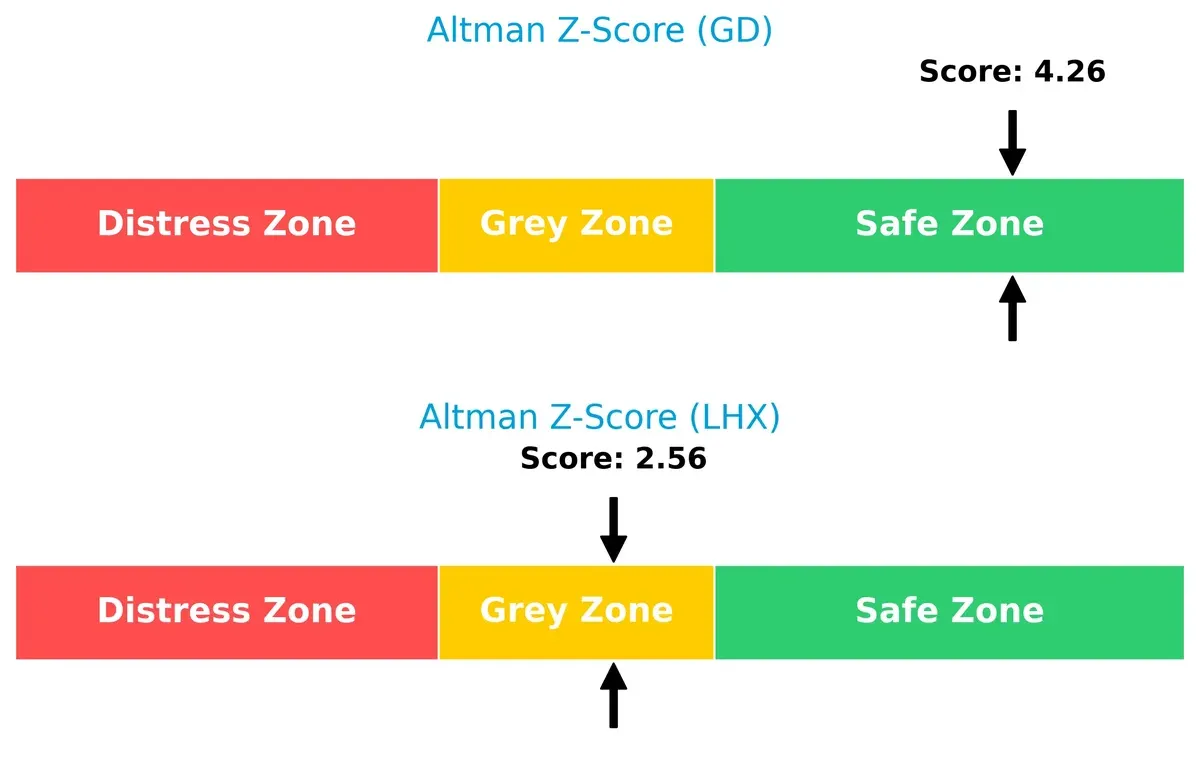
General Dynamics’ superior solvency reduces bankruptcy risk in this late-cycle environment. L3Harris faces higher financial distress risk, warranting caution despite operational strengths.
Financial Health: Quality of Operations
Both companies score very strongly on the Piotroski F-Score, with L3Harris at 9 and General Dynamics at 8, indicating:
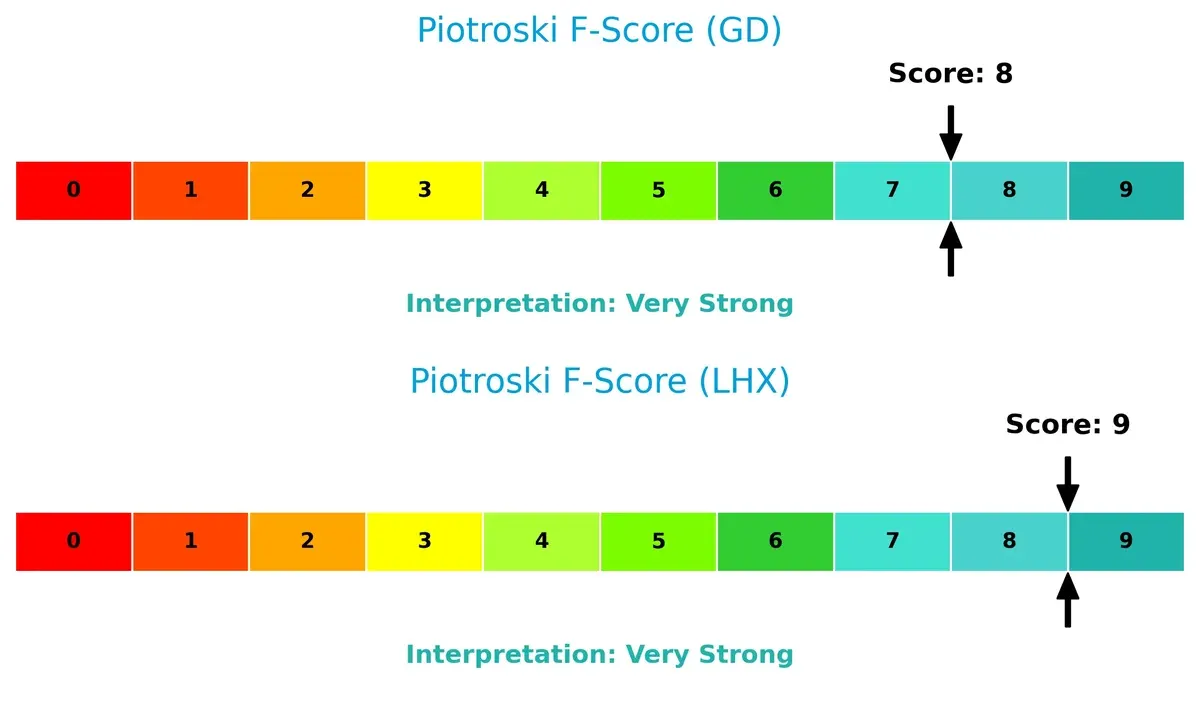
This suggests both firms maintain robust internal financial health. However, L3Harris edges out slightly on operational quality, showing no red flags, while General Dynamics still demonstrates excellent fundamentals but with marginally less internal financial efficiency.
How are the two companies positioned?
This section dissects the operational DNA of GD and LHX by comparing their revenue distribution by segment and internal dynamics. The goal is to confront their economic moats to identify which offers the most resilient, sustainable competitive advantage today.
Revenue Segmentation: The Strategic Mix
This visual comparison dissects how General Dynamics Corporation and L3Harris Technologies diversify income streams and where their primary sector bets lie:
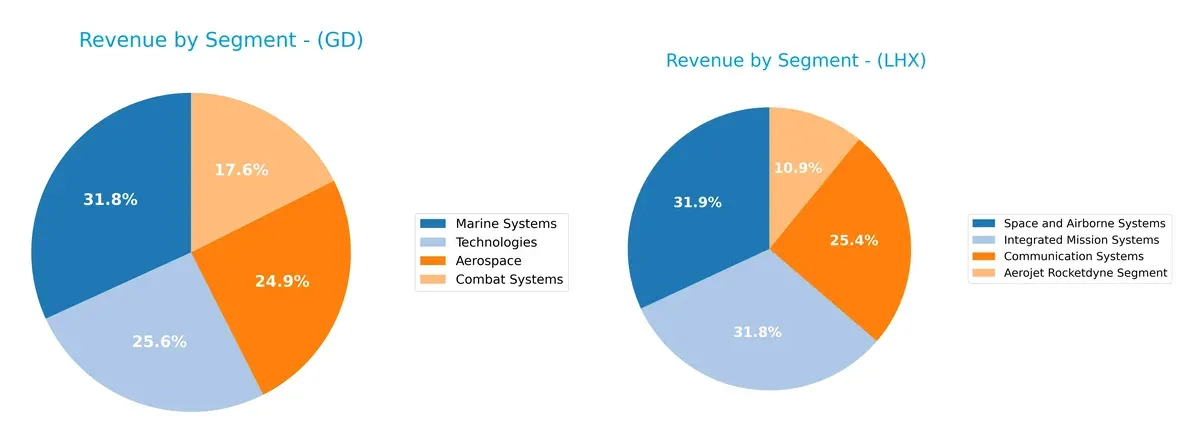
General Dynamics anchors its revenue across four robust segments: Marine Systems leads at $16.7B, followed by Technologies ($13.5B), Aerospace ($13.1B), and Combat Systems ($9.2B). This balanced spread lowers concentration risk and signals a strong infrastructure foothold. L3Harris dwarfs with a more concentrated portfolio; its top three segments—Integrated Mission Systems ($6.8B), Space and Airborne Systems ($6.9B), and Communication Systems ($5.5B)—dominate. This pivot suggests focused tech specialization but raises dependency risks.
Strengths and Weaknesses Comparison
This table compares the Strengths and Weaknesses of General Dynamics Corporation and L3Harris Technologies, Inc.:
GD Strengths
- Strong profitability metrics with ROE 16.43% and ROIC 10.66%
- Favorable WACC at 5.55% supports capital efficiency
- Diversified revenue across Aerospace, Marine, Combat Systems, Technologies
- Solid global presence with significant North America and Europe sales
- Favorable debt ratios, low debt-to-assets at 14%
- High fixed asset turnover at 6.98
LHX Strengths
- Favorable WACC at 6.65% indicates reasonable capital costs
- Favorable quick ratio above 1.0 suggests good liquidity
- Diversified segments including Communication, Integrated Mission, Space Systems
- Favorable fixed asset turnover at 8.2 indicates efficient asset use
- Favorable debt-to-assets ratio at 25.35%
- Neutral PB ratio supports moderate valuation
GD Weaknesses
- Unfavorable PB ratio at 3.55 may indicate overvaluation
- Neutral current and quick ratios suggest limited short-term liquidity cushion
- Net margin neutral at 8.01% signals average profitability
- Limited ratio of neutral asset turnover at 0.92 may restrict operational efficiency
- Heavy dependence on North America sales could limit geographic diversification
LHX Weaknesses
- Unfavorable ROE at 8.18% and neutral ROIC at 5.37% indicate weaker profitability
- Higher P/E ratio at 34.26 may reflect overvaluation risks
- Neutral interest coverage at 4.24 suggests moderate debt servicing ability
- Neutral to unfavorable net margin at 7.35% points to limited profitability
- Lack of reported geographic diversification data
Both companies show slightly favorable financial profiles but differ notably in profitability and valuation metrics. GD leverages stronger returns and geographic diversification, while LHX exhibits solid asset efficiency but faces profitability and valuation challenges. These distinctions should shape each company’s strategic focus on capital allocation and market expansion.
The Moat Duel: Analyzing Competitive Defensibility
A structural moat is the only shield protecting long-term profits from relentless competitive erosion. Let’s dissect the moats of two aerospace giants:
General Dynamics Corporation: Durable Engineering & Government Contracts
General Dynamics’ moat stems from entrenched government contracts and high barriers in defense tech. It shows strong ROIC well above WACC, signaling efficient capital use. Expansion in AI and unmanned systems should deepen this moat in 2026.
L3Harris Technologies, Inc.: Specialized Mission Systems with Narrow Reach
L3Harris relies on niche ISR and communication tech, but its ROIC trails WACC, reflecting shrinking profitability. Unlike General Dynamics, it struggles to sustain excess returns. Growth hinges on breakthrough innovation or market repositioning.
Verdict: Government Scale vs. Niche Innovation
General Dynamics commands a wider, more durable moat with consistent value creation and rising profitability. L3Harris faces a narrowing moat and value erosion. General Dynamics is better positioned to defend and expand its market share.
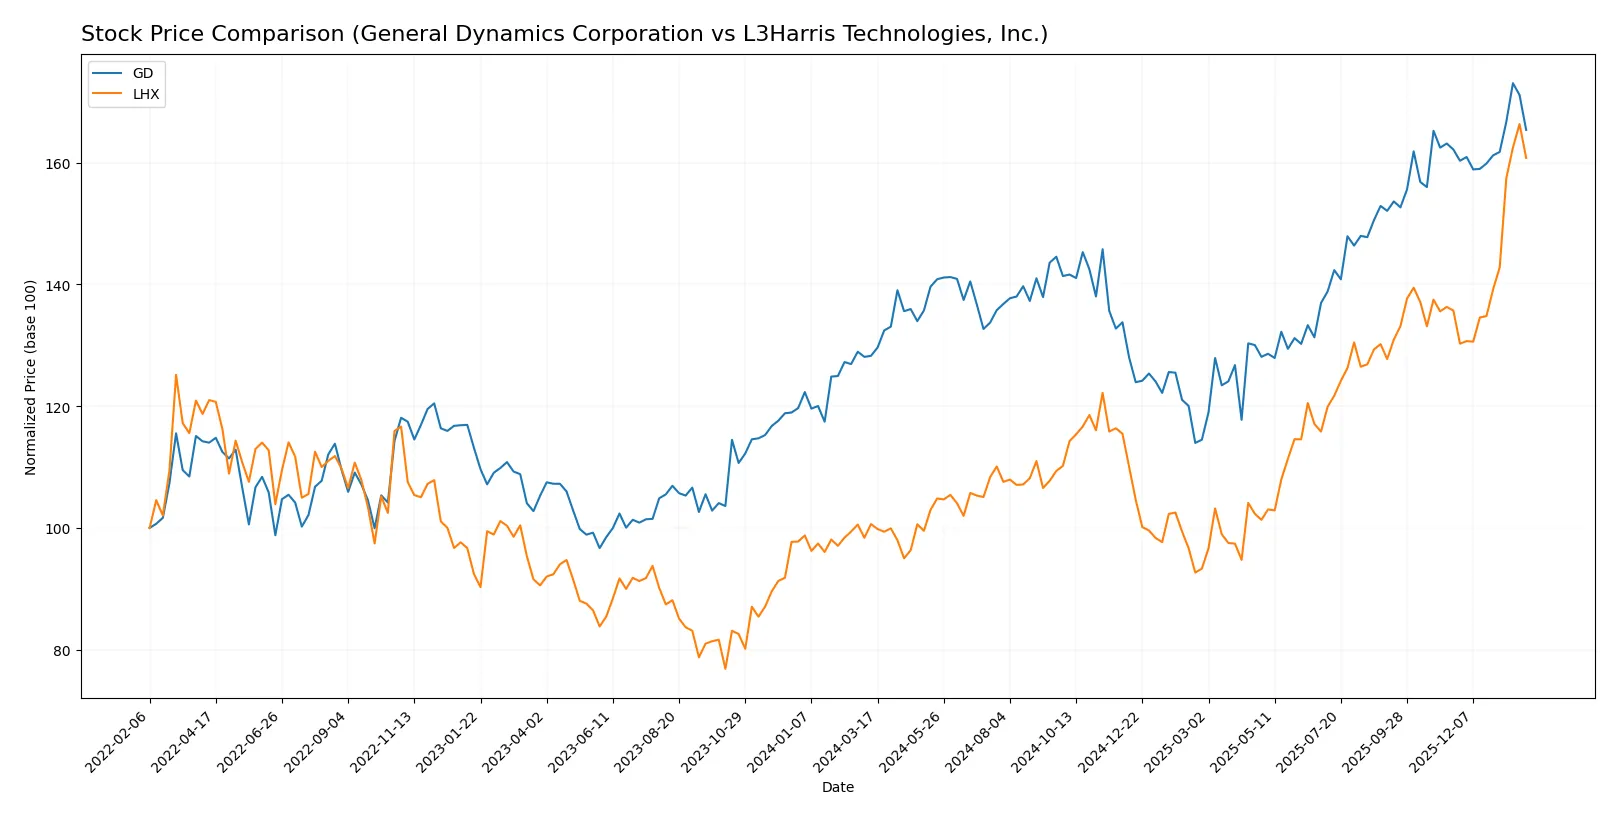
Which stock offers better returns?
Over the past year, General Dynamics and L3Harris exhibited strong upward price movements, with accelerating trends and notable trading volume dynamics shaping their trajectories.
Trend Comparison
General Dynamics recorded a 28.93% price increase over the past 12 months, showing a bullish trend with accelerating momentum and a notable price range between 242 and 367. The recent 2-month period displays a neutral trend with a slight 1.99% gain.
L3Harris gained 59.76% over the same 12-month span, reflecting a bullish trend with acceleration and higher volatility. The recent trend sharply accelerated, posting an 18.47% rise in just over two months.
L3Harris delivered the highest market performance, nearly doubling General Dynamics’ 12-month gain, marked by stronger recent momentum and greater buyer dominance in volume.
Target Prices
Analysts present solid target price ranges for General Dynamics and L3Harris, reflecting cautious optimism.
| Company | Target Low | Target High | Consensus |
|---|---|---|---|
| General Dynamics Corporation | 385 | 444 | 404.22 |
| L3Harris Technologies, Inc. | 323 | 367 | 352.25 |
General Dynamics’ consensus target of 404.22 implies about 15% upside from the current 351.09 price. L3Harris’ consensus target at 352.25 suggests a modest 3% potential gain from the 342.85 price.

Don’t Let Luck Decide Your Entry Point
Optimize your entry points with our advanced ProRealTime indicators. You’ll get efficient buy signals with precise price targets for maximum performance. Start outperforming now!
How do institutions grade them?
General Dynamics Corporation Grades
This table summarizes recent grades assigned by reputable financial institutions for General Dynamics Corporation.
| Grading Company | Action | New Grade | Date |
|---|---|---|---|
| B of A Securities | Maintain | Buy | 2026-01-30 |
| UBS | Maintain | Neutral | 2026-01-15 |
| Citigroup | Maintain | Neutral | 2026-01-13 |
| JP Morgan | Maintain | Overweight | 2025-12-19 |
| Morgan Stanley | Upgrade | Overweight | 2025-12-16 |
| JP Morgan | Maintain | Overweight | 2025-10-28 |
| B of A Securities | Maintain | Buy | 2025-10-28 |
| Bernstein | Maintain | Market Perform | 2025-10-28 |
| JP Morgan | Maintain | Overweight | 2025-10-27 |
| Susquehanna | Maintain | Positive | 2025-10-27 |
L3Harris Technologies, Inc. Grades
This table presents the latest grades from established grading firms for L3Harris Technologies.
| Grading Company | Action | New Grade | Date |
|---|---|---|---|
| RBC Capital | Maintain | Sector Perform | 2026-01-30 |
| UBS | Maintain | Neutral | 2026-01-15 |
| RBC Capital | Maintain | Sector Perform | 2026-01-14 |
| Citigroup | Maintain | Buy | 2026-01-13 |
| Morgan Stanley | Upgrade | Overweight | 2025-12-16 |
| JP Morgan | Maintain | Overweight | 2025-11-04 |
| UBS | Maintain | Neutral | 2025-10-31 |
| Truist Securities | Maintain | Buy | 2025-10-15 |
| Morgan Stanley | Maintain | Equal Weight | 2025-10-15 |
| Barclays | Maintain | Overweight | 2025-07-29 |
Which company has the best grades?
General Dynamics Corporation consistently receives high marks, including multiple “Buy” and “Overweight” ratings. L3Harris shows a mix of “Buy,” “Overweight,” and “Sector Perform” grades. Investors may view General Dynamics as having slightly stronger institutional conviction, impacting perceived stability and growth expectations.
Risks specific to each company
The following categories identify the critical pressure points and systemic threats facing both firms in the 2026 market environment:
1. Market & Competition
General Dynamics Corporation
- Large, diversified aerospace & defense player with stable government contracts; faces pressure from defense budget shifts and private sector competition.
L3Harris Technologies, Inc.
- Focused on advanced defense tech and ISR systems; highly competitive niche markets with rapid tech innovation and evolving customer demands.
2. Capital Structure & Debt
General Dynamics Corporation
- Conservative leverage with debt/equity at 0.31 and strong interest coverage (17.25x), providing financial flexibility.
L3Harris Technologies, Inc.
- Higher leverage at 0.53 debt/equity and moderate interest coverage (4.24x) increases financial risk amid rising rates.
3. Stock Volatility
General Dynamics Corporation
- Low beta at 0.41 signals defensive stock behavior and reduced volatility in market swings.
L3Harris Technologies, Inc.
- Moderate beta at 0.66 indicates more sensitivity to market fluctuations and higher price swings.
4. Regulatory & Legal
General Dynamics Corporation
- Subject to strict defense regulations and export controls; longstanding government relationships mitigate but do not eliminate regulatory risks.
L3Harris Technologies, Inc.
- Similarly exposed to complex defense compliance regimes; innovation in classified tech heightens scrutiny and potential legal challenges.
5. Supply Chain & Operations
General Dynamics Corporation
- Robust, integrated manufacturing with diversified operations; supply chain disruptions could impact costly naval and aerospace programs.
L3Harris Technologies, Inc.
- Reliant on specialized components and advanced electronics; supply chain volatility in tech inputs poses operational risks.
6. ESG & Climate Transition
General Dynamics Corporation
- Increasing pressure to reduce carbon footprint in shipbuilding and aerospace; ESG compliance costs could rise.
L3Harris Technologies, Inc.
- Faces challenges integrating ESG standards in electronics manufacturing and cybersecurity; climate transition poses moderate risk.
7. Geopolitical Exposure
General Dynamics Corporation
- Heavy U.S. defense reliance exposes it to shifts in U.S. foreign policy and defense spending priorities.
L3Harris Technologies, Inc.
- Global tech sales and classified programs expose company to geopolitical tensions and export restrictions.
Which company shows a better risk-adjusted profile?
General Dynamics faces its largest risk in geopolitical exposure due to heavy U.S. defense dependence but benefits from a stronger capital structure and lower volatility. L3Harris confronts significant financial leverage concerns and competitive pressures in fast-evolving tech markets. Despite L3Harris’s strong Piotroski score, its Altman Z-Score in the grey zone signals caution. I observe General Dynamics’s robust interest coverage and safer Altman Z-Score as key factors underpinning a more resilient risk-adjusted profile in 2026.
Final Verdict: Which stock to choose?
General Dynamics demonstrates a durable competitive advantage through its efficient capital use and strong profitability. Its superpower lies in consistent value creation and a growing return on invested capital. The main point of vigilance is its modest liquidity profile, which could pressure short-term flexibility. It suits portfolios focused on steady, long-term growth.
L3Harris boasts a strategic moat anchored in high gross margins and solid income quality, reflecting operational strength in a competitive niche. Its safety profile is comparatively weaker with declining profitability trends and higher leverage. This stock might fit investors seeking growth with moderate risk tolerance, blending growth potential with some valuation premium.
If you prioritize durable value creation and financial stability, General Dynamics outshines with its proven moat and efficient capital allocation. However, if you seek accelerated growth and can tolerate higher risk, L3Harris offers superior recent price momentum and margin resilience, albeit with less stable fundamentals. Each scenario demands careful alignment with your risk profile and investment horizon.
Disclaimer: Investment carries a risk of loss of initial capital. The past performance is not a reliable indicator of future results. Be sure to understand risks before making an investment decision.
Go Further
I encourage you to read the complete analyses of General Dynamics Corporation and L3Harris Technologies, Inc. to enhance your investment decisions: