Home > Comparison > Industrials > GD vs HII
The strategic rivalry between General Dynamics Corporation and Huntington Ingalls Industries defines key dynamics in the aerospace and defense sector. General Dynamics operates a diversified industrial model spanning aerospace, combat systems, and advanced technologies. Huntington Ingalls focuses on specialized military shipbuilding and lifecycle sustainment services. This head-to-head contrasts broad industrial scale versus niche expertise. This analysis will identify which trajectory offers superior risk-adjusted returns for a balanced portfolio.
Table of contents
Companies Overview
General Dynamics and Huntington Ingalls stand as key players shaping the aerospace and defense landscape in the US.
General Dynamics Corporation: Diversified Defense Powerhouse
General Dynamics dominates with a diversified business model spanning aerospace, marine, combat systems, and advanced technologies. It earns revenue through designing business jets, building nuclear submarines, and delivering IT and mission support to military clients. In 2026, the company sharpened its strategic focus on integrating AI and cloud computing to modernize defense capabilities and sustain competitive advantage.
Huntington Ingalls Industries, Inc.: Premier Military Shipbuilder
Huntington Ingalls excels as a specialist in naval shipbuilding and lifecycle sustainment services for the U.S. Navy. Its core revenue comes from constructing nuclear and non-nuclear ships, plus providing overhaul and nuclear support services. The 2026 strategy centers on expanding technical solutions and advanced maintenance services to reinforce its leadership in naval defense infrastructure.
Strategic Collision: Similarities & Divergences
Both firms compete fiercely in the defense sector, but General Dynamics pursues a broad integrated technology approach, while Huntington Ingalls focuses on deep naval shipbuilding expertise. Their battleground lies in securing U.S. government contracts for advanced military hardware and support. Investors face distinct profiles: General Dynamics offers diversified exposure with tech innovation, Huntington Ingalls presents a concentrated play on naval defense dominance.
Income Statement Comparison
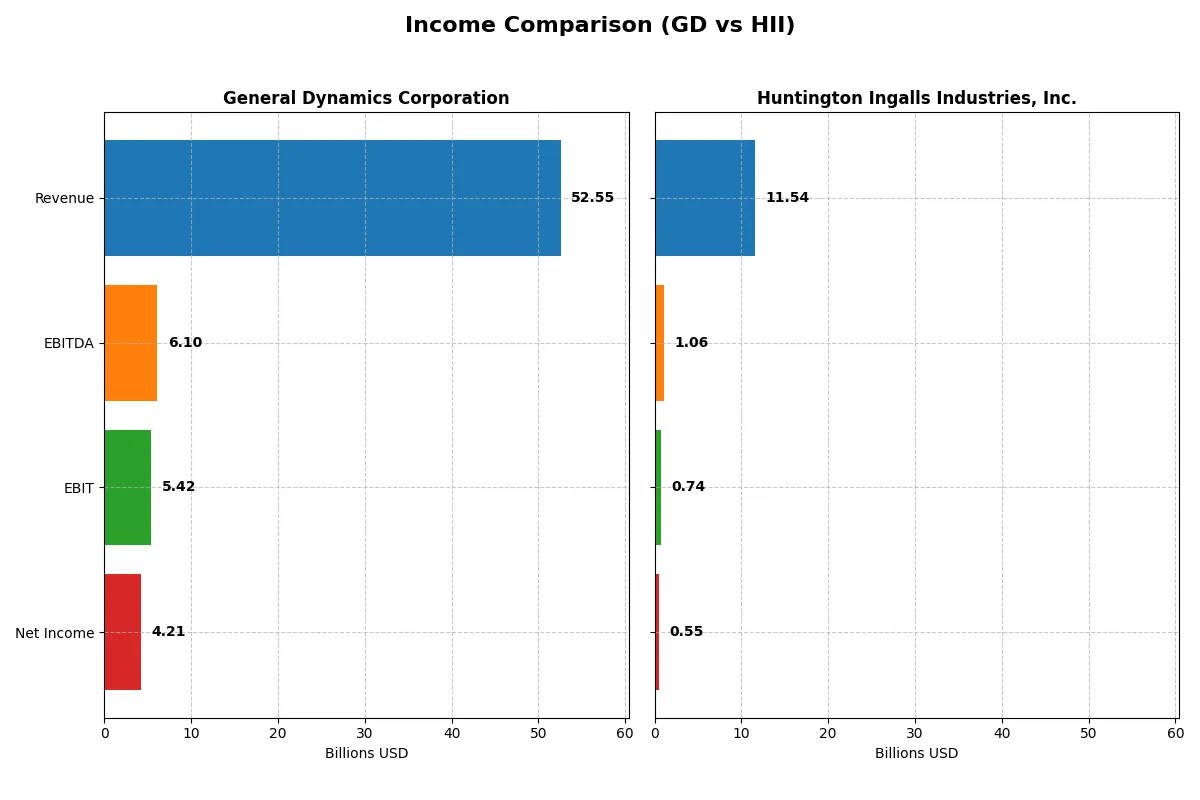
This data dissects the core profitability and scalability of both corporate engines to reveal who dominates the bottom line:
| Metric | General Dynamics Corporation (GD) | Huntington Ingalls Industries, Inc. (HII) |
|---|---|---|
| Revenue | 52.6B | 11.5B |
| Cost of Revenue | 44.6B | 10.1B |
| Operating Expenses | 2.6B | 915M |
| Gross Profit | 7.9B | 1.5B |
| EBITDA | 6.1B | 1.1B |
| EBIT | 5.4B | 738M |
| Interest Expense | 314M | 95M |
| Net Income | 4.2B | 550M |
| EPS | 15.64 | 13.96 |
| Fiscal Year | 2025 | 2024 |
Income Statement Analysis: The Bottom-Line Duel
The following income statement comparison exposes each company’s efficiency in converting revenue into profit and sustaining margin strength over recent years.
General Dynamics Corporation Analysis
General Dynamics has driven revenue from 38.5B in 2021 to 52.6B in 2025, growing net income from 3.26B to 4.21B. Its gross margin holds steady near 15%, while net margin improved to 8%. The 2025 results highlight operational momentum with EBIT expanding 9.8% year-over-year, signaling strong cost control and scalable earnings growth.
Huntington Ingalls Industries, Inc. Analysis
Huntington Ingalls increased revenue modestly from 9.36B in 2020 to 11.5B in 2024 but saw net income decline from 696M to 550M. Gross margin slipped to 12.6% and net margin compressed to under 5%. The latest year reveals weakening profit efficiency, with EBIT down 22% and shrinking margins placing pressure on profitability.
Margin Strength vs. Revenue Growth Leadership
General Dynamics outperforms Huntington Ingalls by combining robust revenue growth with expanding profitability margins. Huntington Ingalls faces margin erosion and declining net income despite revenue gains. For investors prioritizing operational efficiency and sustainable earnings growth, General Dynamics presents a more compelling income statement profile.
Financial Ratios Comparison
These vital ratios act as a diagnostic tool to expose underlying fiscal health, valuation premiums, and capital efficiency for each company:
| Ratios | General Dynamics Corporation (GD) | Huntington Ingalls Industries, Inc. (HII) |
|---|---|---|
| ROE | 16.4% | 11.8% |
| ROIC | 10.7% | 4.7% |
| P/E | 21.6 | 13.5 |
| P/B | 3.55 | 1.60 |
| Current Ratio | 1.44 | 1.08 |
| Quick Ratio | 0.89 | 1.01 |
| D/E (Debt-to-Equity) | 0.31 | 0.73 |
| Debt-to-Assets | 14.0% | 28.1% |
| Interest Coverage | 17.1 | 5.63 |
| Asset Turnover | 0.92 | 0.95 |
| Fixed Asset Turnover | 6.98 | 3.13 |
| Payout Ratio | 37.8% | 37.5% |
| Dividend Yield | 1.75% | 2.77% |
| Fiscal Year | 2025 | 2024 |
Efficiency & Valuation Duel: The Vital Signs
Financial ratios act like a company’s DNA, uncovering hidden risks and operational strengths that drive long-term value.
General Dynamics Corporation
General Dynamics posts a favorable 16.43% ROE and a solid 10.66% ROIC, comfortably above its 5.55% WACC, showing efficient capital use. Its P/E of 21.58 is neutral, signaling fair valuation, but a high P/B of 3.55 suggests a stretched balance sheet. The company returns value via a 1.75% dividend yield, balancing shareholder payouts with reinvestment discipline.
Huntington Ingalls Industries, Inc.
Huntington Ingalls shows a moderate 11.79% ROE but underperforms on ROIC at 4.74%, below its 5.07% WACC, indicating less efficient capital allocation. The P/E of 13.54 is attractive, implying a cheaper valuation versus peers. A higher dividend yield of 2.77% offers stronger immediate income, though profitability metrics reveal operational challenges.
Balanced Risk vs. Valuation Efficiency
General Dynamics delivers stronger profitability and capital efficiency, despite a somewhat stretched book value. Huntington Ingalls offers a cheaper price and higher dividend but weaker returns on invested capital. Investors seeking operational strength may prefer General Dynamics, while income-focused profiles might lean toward Huntington Ingalls.
Which one offers the Superior Shareholder Reward?
I observe that General Dynamics (GD) offers a balanced distribution with a 1.75% dividend yield and a sustainable 38% payout ratio, backed by a strong free cash flow of 14.7/share and consistent buybacks. Huntington Ingalls (HII) pays a higher 2.77% dividend yield with a lower 37% payout ratio but struggles with free cash flow at just 0.66/share, signaling weaker buyback capacity. GD’s model combines dividends and robust buybacks, enhancing total return sustainability. HII’s higher yield is attractive but risks sustainability due to low free cash flow coverage. I conclude GD provides the superior total shareholder reward in 2026.
Comparative Score Analysis: The Strategic Profile
The radar chart reveals the fundamental DNA and trade-offs of General Dynamics Corporation and Huntington Ingalls Industries, Inc., highlighting their respective financial strengths and weaknesses:
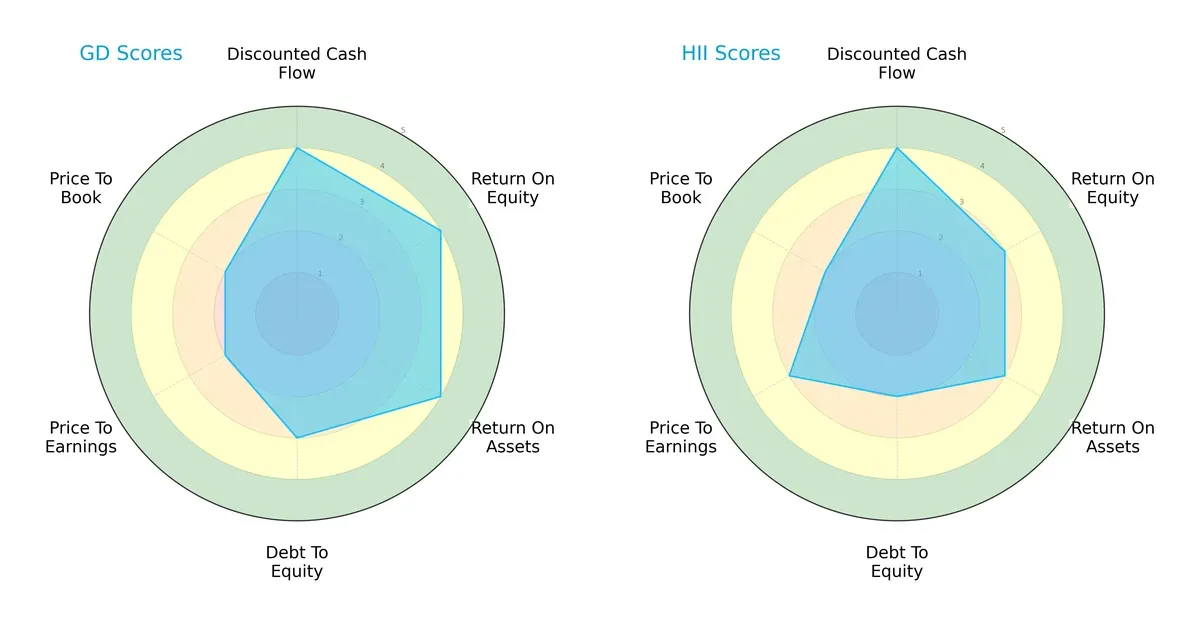
General Dynamics shows stronger profitability with higher ROE (4 vs. 3) and ROA (4 vs. 3) scores than Huntington Ingalls, reflecting better asset and equity returns. Both share a favorable DCF score of 4, indicating similar valuation appeal based on cash flows. However, General Dynamics carries moderately higher financial risk with a debt-to-equity score of 3 versus Huntington’s 2. Huntington edges out slightly on P/E valuation (3 vs. 2), suggesting a more attractive earnings price. Overall, General Dynamics presents a more balanced profile in profitability and leverage, while Huntington relies more on valuation metrics.
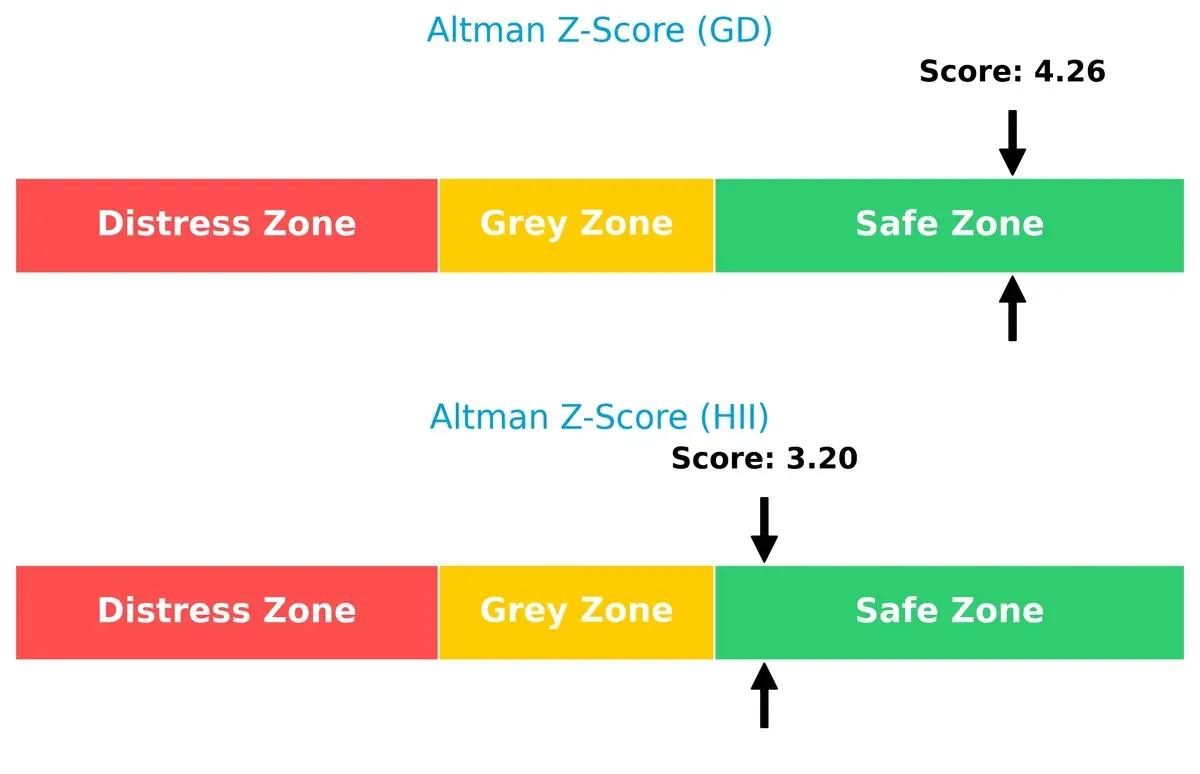
Bankruptcy Risk: Solvency Showdown
General Dynamics leads with a higher Altman Z-Score of 4.26 compared to Huntington’s 3.20, both safely above the distress threshold, signaling strong solvency and lower bankruptcy risk in this cycle:
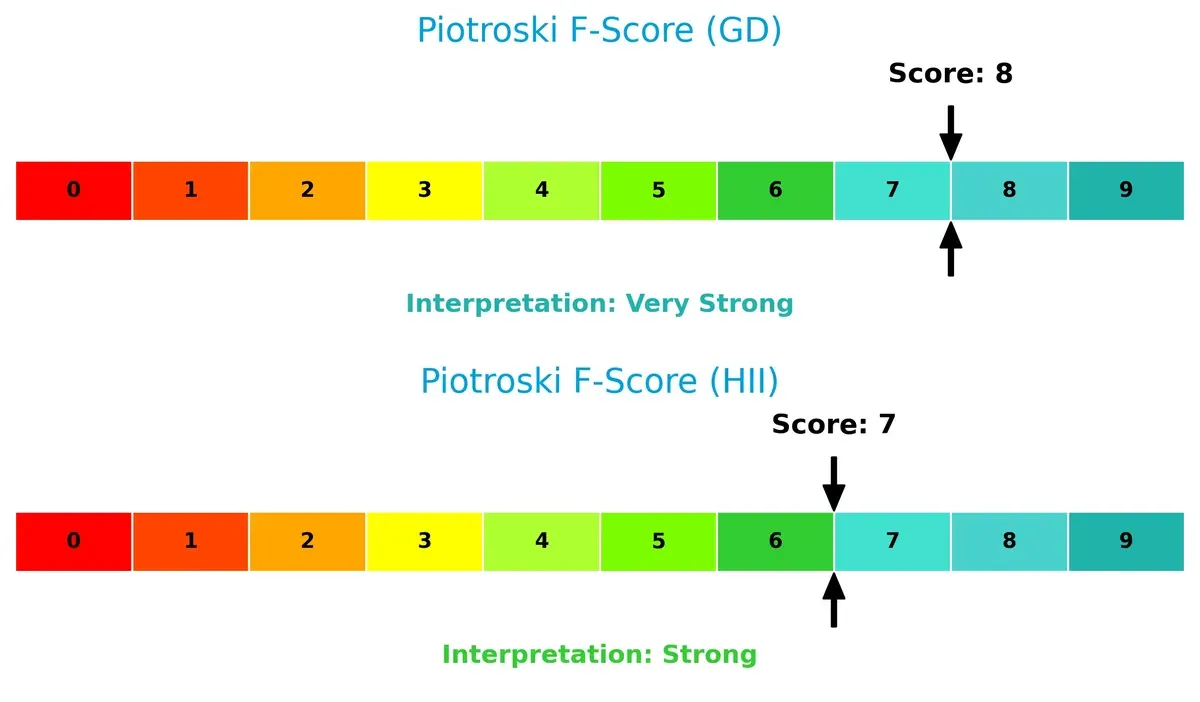
Financial Health: Quality of Operations
General Dynamics scores an 8 on the Piotroski F-Score, indicating very strong financial health. Huntington’s score of 7 is strong but slightly behind, suggesting it has comparatively minor internal risks:
How are the two companies positioned?
This section dissects the operational DNA of GD and HII by comparing their revenue distribution and internal dynamics, including strengths and weaknesses. The final goal is to confront their economic moats to identify which model offers the most resilient, sustainable competitive advantage today.
Revenue Segmentation: The Strategic Mix
The following visual comparison dissects how General Dynamics Corporation and Huntington Ingalls Industries diversify their income streams and where their primary sector bets lie:
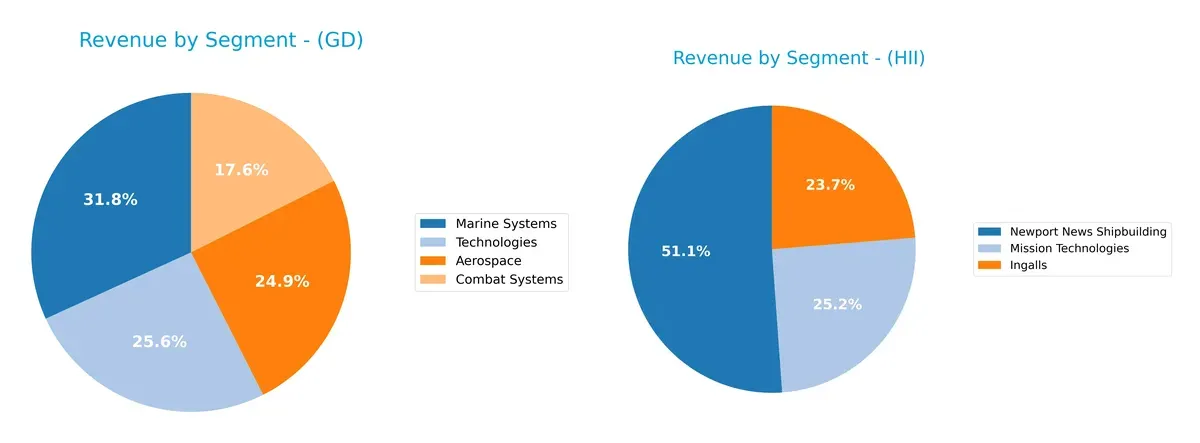
General Dynamics dwarfs Huntington Ingalls with a broad mix across Aerospace ($13.1B), Marine Systems ($16.7B), Technologies ($13.5B), and Combat Systems ($9.2B). Huntington Ingalls anchors revenue heavily in Newport News Shipbuilding ($6B), showing less diversification. GD’s diverse portfolio reduces concentration risk and leverages multiple defense ecosystems. HII’s reliance on shipbuilding underlines infrastructure dominance but poses exposure to sector cyclicality and government budgets.
Strengths and Weaknesses Comparison
This table compares the strengths and weaknesses of General Dynamics Corporation (GD) and Huntington Ingalls Industries, Inc. (HII):
GD Strengths
- Diversified revenue across Aerospace, Combat Systems, Marine, Technologies
- Favorable ROE (16.43%) and ROIC (10.66%) above WACC (5.55%)
- Low debt-to-assets (14%) and strong interest coverage (17.25)
- Global footprint with strong North America and Europe sales
- Higher fixed asset turnover (6.98) indicates efficient asset use
HII Strengths
- Favorable PE (13.54) and dividend yield (2.77%)
- Favorable quick ratio (1.01) and solid interest coverage (7.77)
- Moderate debt-to-assets (28.07%) with manageable leverage
- Favorable fixed asset turnover (3.13) showing operational efficiency
- Focused revenue from shipbuilding and mission technologies
GD Weaknesses
- Neutral net margin (8.01%) and valuation metrics with unfavorable PB (3.55)
- Quick ratio below 1 (0.89) may hint at liquidity concerns
- Heavy reliance on North America market limits geographic diversification
HII Weaknesses
- Unfavorable net margin (4.77%) and ROIC (4.74%) below WACC (5.07%)
- Higher debt-to-equity (0.73) suggests more leverage risk
- Less diversified product segments focused on shipbuilding and technologies
GD benefits from strong profitability metrics, diversified business lines, and global sales, but faces valuation and liquidity caution. HII shows efficient operations and attractive valuation but carries lower profitability and higher leverage risks. These contrasts shape each company’s strategic flexibility and risk profile.
The Moat Duel: Analyzing Competitive Defensibility
A structural moat protects long-term profits from relentless competitive erosion by locking in advantages that rivals cannot easily replicate:
General Dynamics Corporation: Diversified Defense Powerhouse
General Dynamics leverages intangible assets and scale, delivering very favorable ROIC at 5.1% above WACC and margin stability. New tech and service expansions in 2026 could deepen its durable moat.
Huntington Ingalls Industries, Inc.: Specialized Naval Shipbuilder
Huntington Ingalls relies on niche expertise in naval shipbuilding but suffers declining ROIC and shrinking margins. Its focused moat contrasts with General Dynamics’ breadth, limiting future growth and resilience.
Broad Scale vs. Niche Expertise: Who Holds the Moat Edge?
General Dynamics’ wider, growing moat outpaces Huntington Ingalls’ deteriorating competitive position. GD’s diversified portfolio better defends against market shifts and sustains higher profitability long term.
Which stock offers better returns?
General Dynamics and Huntington Ingalls Industries both show strong price gains over the past year, with distinct acceleration patterns and notable highs shaping their trading dynamics.
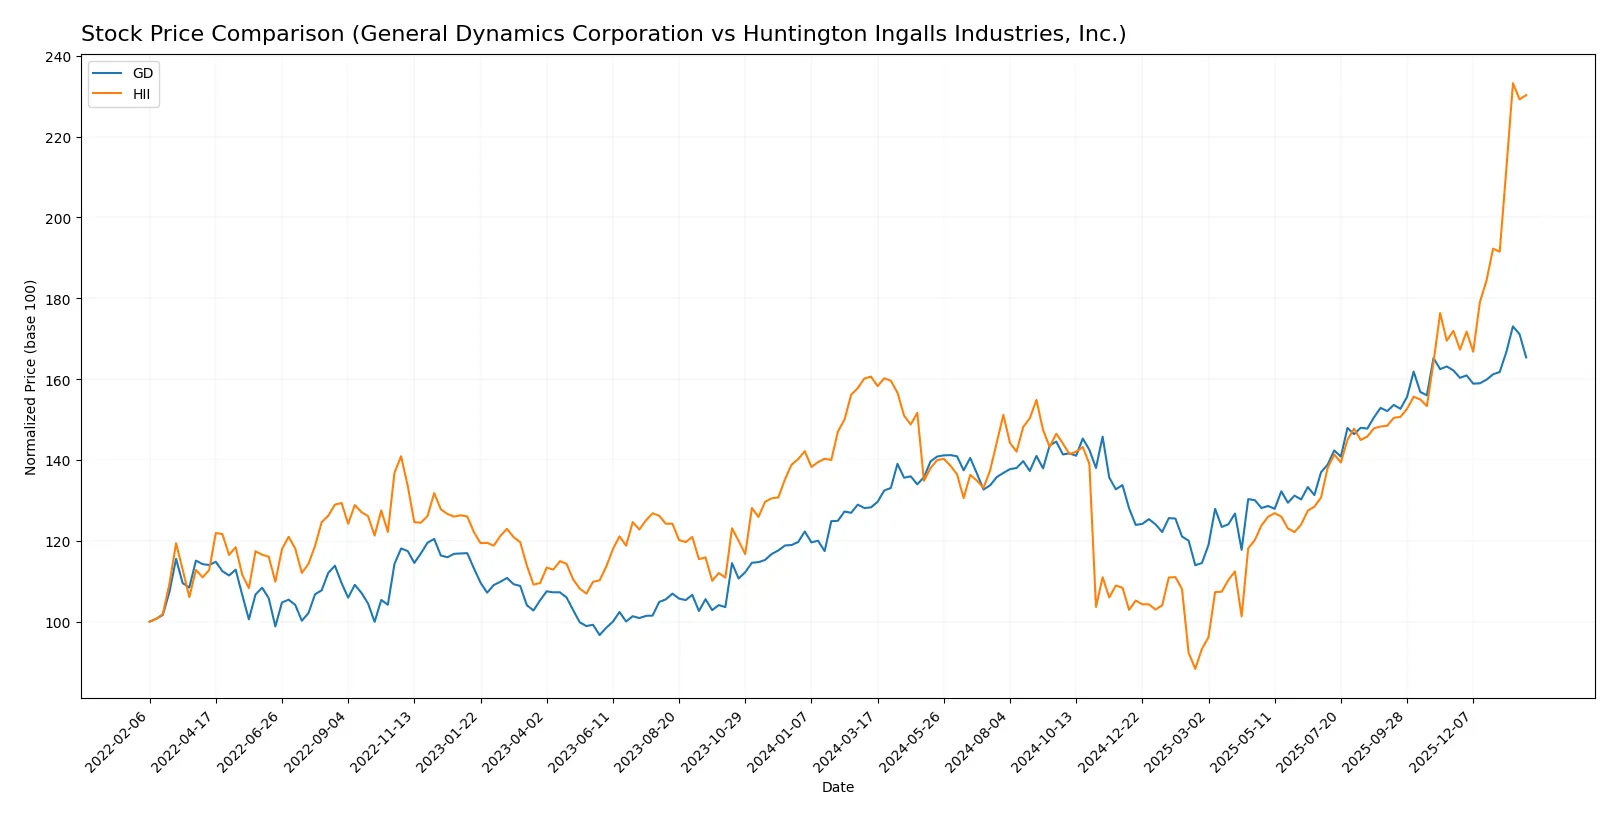
Trend Comparison
General Dynamics (GD) stock rose 28.93% over the past 12 months, showing a bullish trend with accelerating momentum. The price ranged from 241.94 to 367.38, and volatility measured by standard deviation stands at 28.77.
Huntington Ingalls Industries (HII) gained 43.36% in the same period, also with accelerating bullish momentum. It experienced wider price swings, from 161.27 to 425.9, and higher volatility at 52.5 standard deviation.
HII outperformed GD in market returns over the last year, delivering a stronger price gain with more pronounced volatility and acceleration.
Target Prices
Analysts present a mixed but generally optimistic target price consensus for these aerospace and defense leaders.
| Company | Target Low | Target High | Consensus |
|---|---|---|---|
| General Dynamics Corporation | 385 | 444 | 404.22 |
| Huntington Ingalls Industries, Inc. | 264 | 425 | 367 |
General Dynamics trades below its consensus target of 404, signaling upside potential. Huntington Ingalls sits near its consensus target of 367, reflecting more balanced expectations.

Don’t Let Luck Decide Your Entry Point
Optimize your entry points with our advanced ProRealTime indicators. You’ll get efficient buy signals with precise price targets for maximum performance. Start outperforming now!
How do institutions grade them?
The following tables summarize recent institutional grades for General Dynamics Corporation and Huntington Ingalls Industries, Inc.:
General Dynamics Corporation Grades
This table shows the latest grades from reputable financial institutions for General Dynamics Corporation.
| Grading Company | Action | New Grade | Date |
|---|---|---|---|
| B of A Securities | Maintain | Buy | 2026-01-30 |
| UBS | Maintain | Neutral | 2026-01-15 |
| Citigroup | Maintain | Neutral | 2026-01-13 |
| JP Morgan | Maintain | Overweight | 2025-12-19 |
| Morgan Stanley | Upgrade | Overweight | 2025-12-16 |
| JP Morgan | Maintain | Overweight | 2025-10-28 |
| B of A Securities | Maintain | Buy | 2025-10-28 |
| Bernstein | Maintain | Market Perform | 2025-10-28 |
| JP Morgan | Maintain | Overweight | 2025-10-27 |
| Susquehanna | Maintain | Positive | 2025-10-27 |
Huntington Ingalls Industries, Inc. Grades
This table presents the most recent grades for Huntington Ingalls Industries, Inc. from established grading firms.
| Grading Company | Action | New Grade | Date |
|---|---|---|---|
| Goldman Sachs | Maintain | Buy | 2026-01-20 |
| Citigroup | Maintain | Buy | 2026-01-13 |
| JP Morgan | Maintain | Neutral | 2025-11-03 |
| Goldman Sachs | Maintain | Buy | 2025-10-31 |
| TD Cowen | Maintain | Buy | 2025-10-31 |
| B of A Securities | Maintain | Underperform | 2025-08-13 |
| Barclays | Maintain | Equal Weight | 2025-08-04 |
| TD Cowen | Upgrade | Buy | 2025-07-10 |
| Barclays | Maintain | Equal Weight | 2025-05-05 |
| Goldman Sachs | Maintain | Buy | 2025-05-02 |
Which company has the best grades?
General Dynamics receives more consistent overweight and buy ratings from top firms, signaling stronger institutional confidence. Huntington Ingalls shows a mix of buy and neutral grades, with some underperform marks, indicating more varied sentiment among investors. This could affect relative investor perception and portfolio positioning.
Risks specific to each company
The following categories identify critical pressure points and systemic threats facing General Dynamics Corporation and Huntington Ingalls Industries in the 2026 market environment:
1. Market & Competition
General Dynamics Corporation
- Broad aerospace & defense portfolio diversifies market risk amid intense sector competition.
Huntington Ingalls Industries, Inc.
- Focused shipbuilding niche limits diversification; faces fierce competition in naval contracts.
2. Capital Structure & Debt
General Dynamics Corporation
- Low debt-to-equity ratio (0.31) signals strong balance sheet and financial flexibility.
Huntington Ingalls Industries, Inc.
- Higher debt-to-equity ratio (0.73) raises leverage risk, though interest coverage remains solid.
3. Stock Volatility
General Dynamics Corporation
- Beta of 0.414 indicates lower volatility and defensive stock behavior versus market swings.
Huntington Ingalls Industries, Inc.
- Beta of 0.354 similarly suggests low volatility but slightly lower market sensitivity.
4. Regulatory & Legal
General Dynamics Corporation
- Extensive operations in sensitive defense sectors expose to complex U.S. regulatory scrutiny.
Huntington Ingalls Industries, Inc.
- Nuclear shipbuilding and environmental services increase regulatory burden and compliance risks.
5. Supply Chain & Operations
General Dynamics Corporation
- Diverse supply chain across aerospace and marine segments mitigates operational disruption risks.
Huntington Ingalls Industries, Inc.
- Concentrated shipbuilding operations heighten exposure to supply chain delays and cost overruns.
6. ESG & Climate Transition
General Dynamics Corporation
- Emerging investments in AI and cloud computing align with tech-forward ESG strategies.
Huntington Ingalls Industries, Inc.
- Environmental management services increase ESG compliance costs but improve sustainability positioning.
7. Geopolitical Exposure
General Dynamics Corporation
- Global operations subject to geopolitical tensions affecting defense budgets and export controls.
Huntington Ingalls Industries, Inc.
- Primarily U.S.-focused, limiting direct geopolitical risks but reliant on federal defense spending.
Which company shows a better risk-adjusted profile?
General Dynamics faces its largest risk in geopolitical exposure given its global footprint and defense sector sensitivity. Huntington Ingalls’ biggest risk lies in capital structure due to higher leverage and concentrated operations. GD’s stronger balance sheet, higher ROIC, and safer Altman Z-Score give it a superior risk-adjusted profile. GD’s 2025 Altman Z-Score of 4.26 firmly places it in the safe zone, while HII’s 3.20, although safe, is closer to the grey zone threshold. This difference underscores GD’s financial resilience amid sector volatility.
Final Verdict: Which stock to choose?
General Dynamics stands out as a cash machine with a durable competitive advantage, consistently delivering returns well above its cost of capital. Its key point of vigilance lies in its moderate price-to-book ratio, which suggests investors should watch valuation closely. This stock fits well in aggressive growth portfolios seeking quality and resilience.
Huntington Ingalls Industries offers a strategic moat through its niche defense contracting and relatively lower valuation multiple, providing a margin of safety compared to General Dynamics. Its financial profile is less robust, but it suits portfolios focused on value with a tilt toward growth at a reasonable price.
If you prioritize durable value creation and consistent profitability, General Dynamics is the compelling choice due to its strong economic moat and superior returns on invested capital. However, if you seek a more value-oriented approach with potential upside from a lower valuation, Huntington Ingalls Industries offers better stability at a discount but with higher operational risks.
Disclaimer: Investment carries a risk of loss of initial capital. The past performance is not a reliable indicator of future results. Be sure to understand risks before making an investment decision.
Go Further
I encourage you to read the complete analyses of General Dynamics Corporation and Huntington Ingalls Industries, Inc. to enhance your investment decisions: