Home > Comparison > Industrials > XYL vs GNRC
The strategic rivalry between Xylem Inc. and Generac Holdings Inc. shapes the Industrials sector’s machinery landscape. Xylem operates as a diversified water technology leader with integrated solutions across infrastructure and measurement. Generac, by contrast, focuses on power generation equipment and energy storage, emphasizing residential and commercial markets. This analysis pits Xylem’s broad industrial approach against Generac’s specialized energy focus to identify which offers superior risk-adjusted returns for a diversified portfolio.
Table of contents
Companies Overview
Xylem Inc. and Generac Holdings Inc. both shape critical segments of the industrial machinery market, commanding significant presence.
Xylem Inc.: Water Technology Innovator
Xylem Inc. leads in engineered water solutions, generating revenue through pumps, filtration, and smart water infrastructure products. Its core segments—Water Infrastructure, Applied Water, and Measurement & Control—reflect a strategic emphasis on integrated water management and digital analytics in 2026. Xylem’s competitive advantage lies in its diversified product suite and advanced technology for water transport and treatment.
Generac Holdings Inc.: Power Generation Specialist
Generac Holdings Inc. dominates power generation, offering residential and commercial generators, energy storage, and clean energy systems. Its 2026 strategy prioritizes expanding portable and standby power solutions alongside clean energy brands like PWRcell. Generac’s revenue engine thrives on delivering reliable backup power and innovative energy storage to diverse end markets worldwide.
Strategic Collision: Similarities & Divergences
Both companies operate in industrial machinery but diverge sharply in focus—Xylem on water infrastructure’s closed-loop systems, Generac on open, modular power solutions. Their primary battleground is infrastructure resilience: water systems versus energy backup. Xylem offers a stable, tech-driven growth profile, while Generac presents a higher-beta, innovation-driven investment case marked by energy transition exposure.
Income Statement Comparison
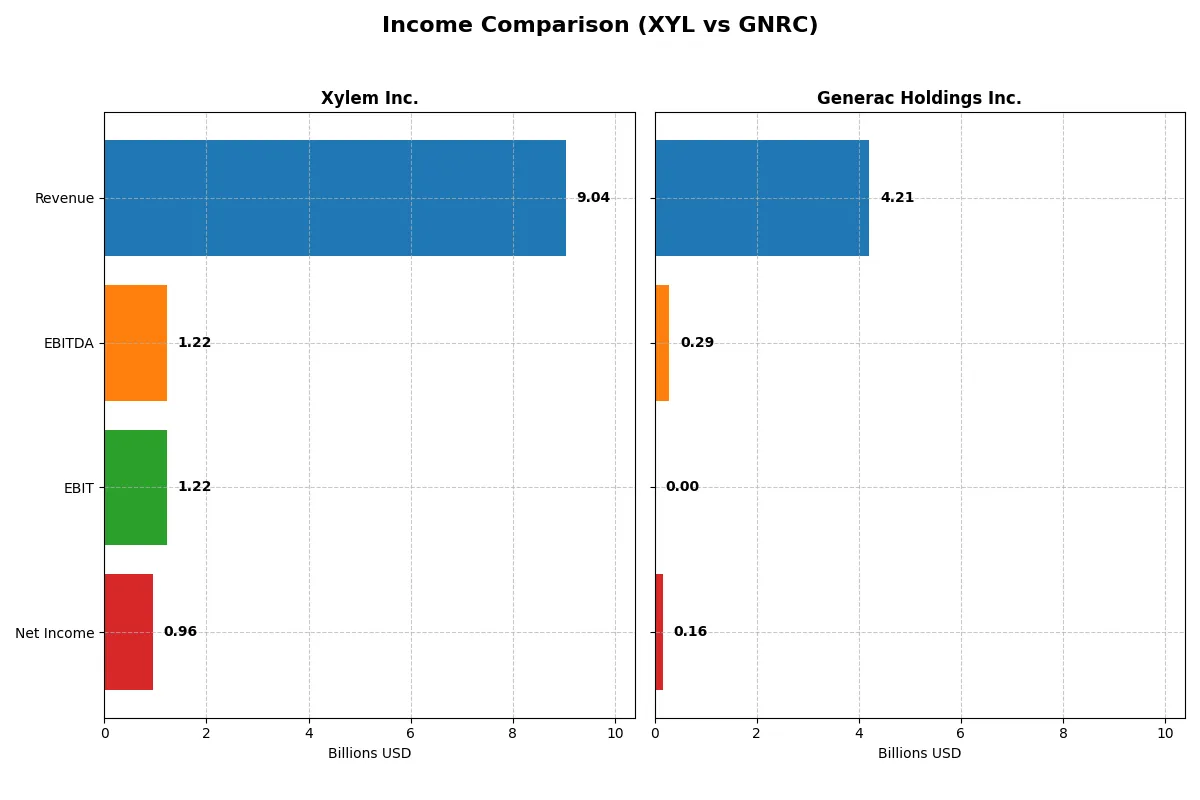
This data dissects the core profitability and scalability of both corporate engines to reveal who dominates the bottom line:
| Metric | Xylem Inc. (XYL) | Generac Holdings Inc. (GNRC) |
|---|---|---|
| Revenue | 9.04B | 4.21B |
| Cost of Revenue | 5.56B | 2.60B |
| Operating Expenses | 2.25B | 1.32B |
| Gross Profit | 3.48B | 1.61B |
| EBITDA | 1.22B | 289M |
| EBIT | 1.22B | 0 |
| Interest Expense | 29M | -71M |
| Net Income | 957M | 160M |
| EPS | 3.93 | 2.73 |
| Fiscal Year | 2025 | 2025 |
Income Statement Analysis: The Bottom-Line Duel
This income statement comparison reveals which company operates with greater efficiency and delivers stronger bottom-line performance.
Xylem Inc. Analysis
Xylem’s revenue climbed steadily from $5.2B in 2021 to $9.0B in 2025, reflecting robust growth. Net income more than doubled, reaching $957M in 2025. Its gross margin holds firm at 38.5%, while the net margin improved to 10.6%. Xylem’s 2025 figures demonstrate efficient cost control and healthy margin expansion, underscoring solid operational momentum.
Generac Holdings Inc. Analysis
Generac’s revenue showed modest overall growth to $4.2B in 2025 but declined 2% year-over-year. Net income tumbled 70% over five years, falling to $160M in 2025. While its gross margin remains comparable at 38.3%, the net margin shrank to just 3.8%. The 2025 results highlight margin compression and deteriorating profitability amid rising expenses.
Margin Strength vs. Profit Decline
Xylem outperforms Generac with superior margin expansion and strong net income growth. Generac’s revenue scale is smaller and profit margins have contracted sharply. For investors prioritizing earnings efficiency and margin resilience, Xylem presents a stronger fundamental profile with clearer momentum.
Financial Ratios Comparison
These vital ratios act as a diagnostic tool to expose the underlying fiscal health, valuation premiums, and capital efficiency of the companies compared below:
| Ratios | Xylem Inc. (XYL) | Generac Holdings Inc. (GNRC) |
|---|---|---|
| ROE | 8.3% | 0% |
| ROIC | 6.4% | 0% |
| P/E | 34.6 | 50.0 |
| P/B | 2.89 | 0 |
| Current Ratio | 1.63 | 0 |
| Quick Ratio | 1.28 | 0 |
| D/E (Debt-to-Equity) | 0.17 | 0 |
| Debt-to-Assets | 11.0% | 0 |
| Interest Coverage | 42.2 | -4.1 |
| Asset Turnover | 0.51 | 0 |
| Fixed Asset Turnover | 7.80 | 0 |
| Payout ratio | 40.9% | 0.18% |
| Dividend yield | 1.18% | 0.004% |
| Fiscal Year | 2025 | 2025 |
Efficiency & Valuation Duel: The Vital Signs
Financial ratios act as a company’s DNA, uncovering hidden risks and operational strengths essential for investment decisions.
Xylem Inc.
Xylem posts a solid 10.6% net margin but a modest 8.3% ROE, signaling moderate profitability. Its P/E of 34.6 renders the stock somewhat expensive compared to industry averages. The company balances this with a 1.18% dividend yield and maintains a slightly favorable overall ratio profile, supporting shareholder returns steadily.
Generac Holdings Inc.
Generac struggles with a low 3.8% net margin and zero reported ROE, reflecting operational challenges. Its P/E of 50.0 appears stretched, increasing valuation risk. The firm pays no dividend and shows mostly unfavorable ratios, signaling limited financial efficiency and higher risk for investors.
Valuation Discipline vs. Profitability Stress
Xylem offers a better risk-reward balance with stronger margins and a consistent dividend, despite a high valuation. Generac’s stretched multiples and weak profitability suggest higher risk. Investors seeking operational safety may prefer Xylem, while those betting on turnaround face greater uncertainty with Generac.
Which one offers the Superior Shareholder Reward?
I see Xylem (XYL) delivers a balanced shareholder reward with a 1.18% dividend yield and a 41% payout ratio, supported by robust free cash flow (3.7/share) covering dividends well. Its steady buybacks enhance total returns. Generac (GNRC), by contrast, barely pays dividends (0.0037%) and focuses on reinvestment, showing strong free cash flow (7.5/share) but volatile margins. Given XYL’s sustainable dividend and buybacks, I favor Xylem for reliable, long-term total shareholder return in 2026.
Comparative Score Analysis: The Strategic Profile
The radar chart reveals the fundamental DNA and trade-offs of Xylem Inc. and Generac Holdings Inc., highlighting their financial strengths and valuation challenges:
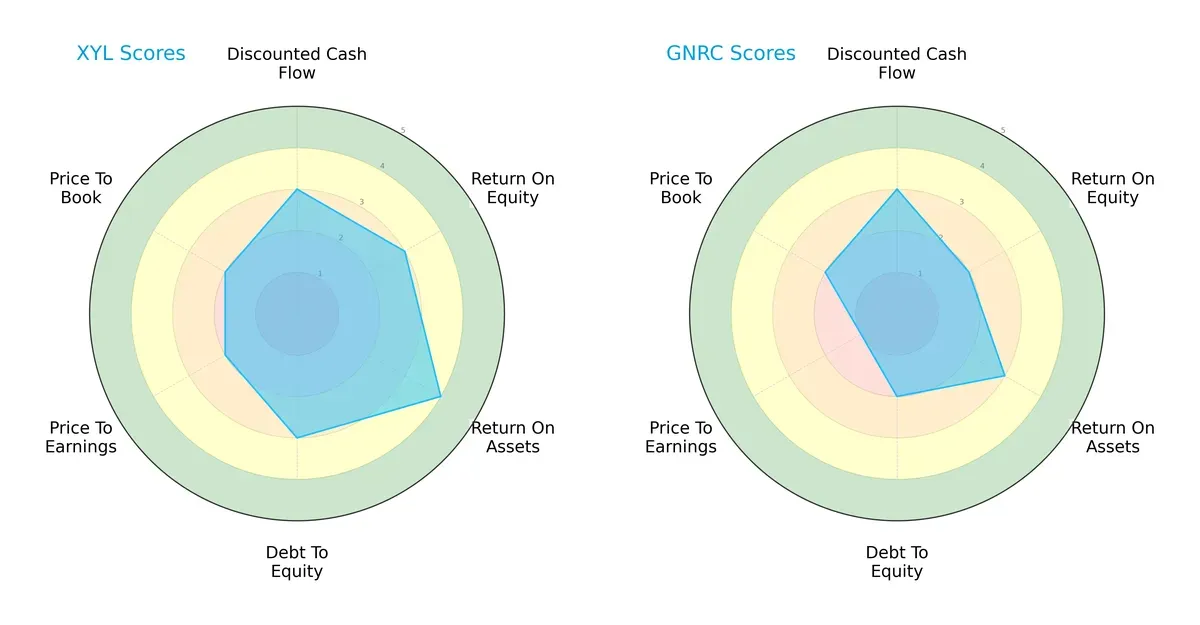
Xylem exhibits a more balanced profile with moderate DCF, ROE, and Debt/Equity scores, and a favorable ROA score. Generac leans on moderate DCF but shows weaknesses in ROE and debt management. Both face valuation headwinds, but Xylem’s operational efficiency stands out.
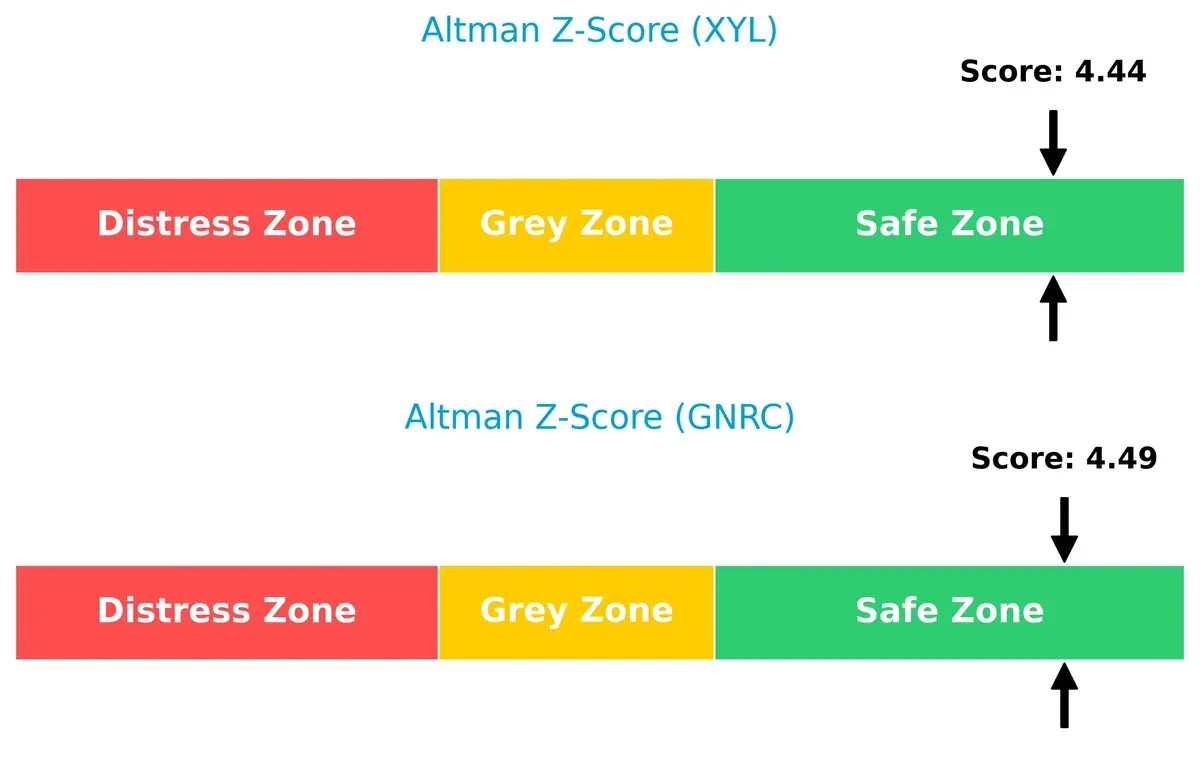
Bankruptcy Risk: Solvency Showdown
Xylem and Generac both score safely above 4.4 on the Altman Z-Score, signaling robust financial health and low bankruptcy risk in this cycle:
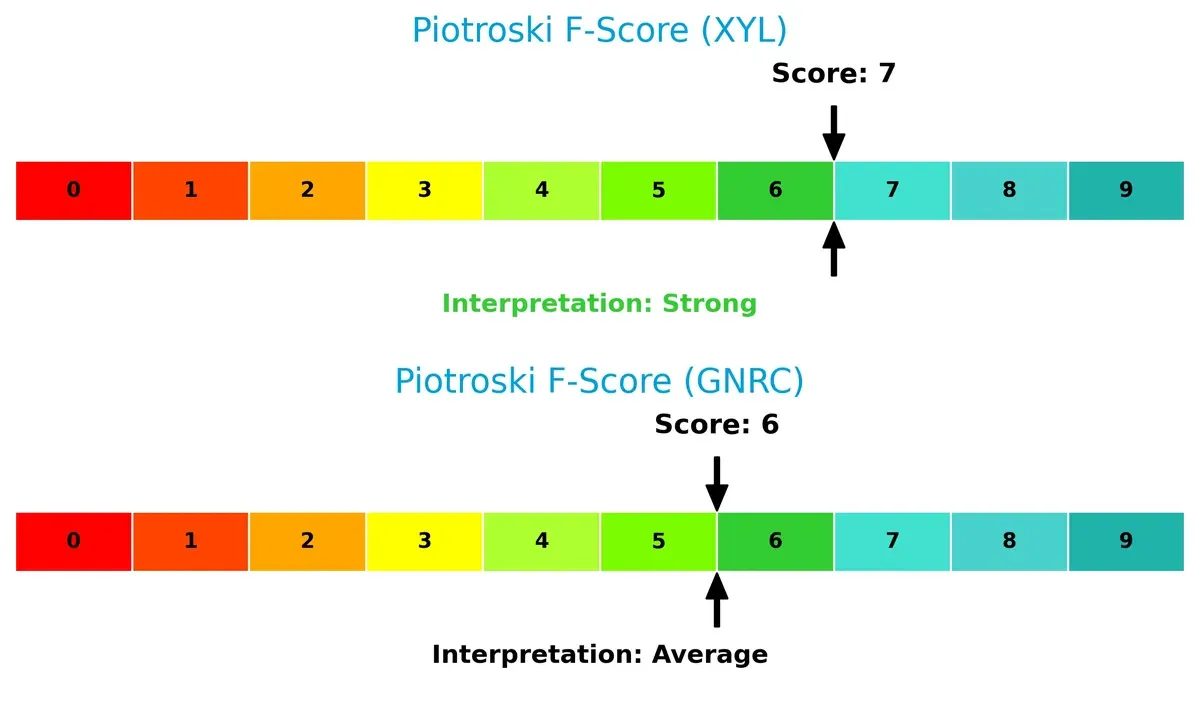
Financial Health: Quality of Operations
Xylem’s Piotroski F-Score of 7 indicates strong financial health, outperforming Generac’s average score of 6. Generac’s internal metrics show modest red flags compared to Xylem’s more solid operational quality:
How are the two companies positioned?
This section dissects the operational DNA of Xylem and Generac by comparing revenue distribution and internal dynamics. The ultimate goal is to confront their economic moats to identify the most resilient and sustainable competitive advantage in today’s market.
Revenue Segmentation: The Strategic Mix
The following comparison dissects how Xylem Inc. and Generac Holdings diversify their income streams and where their primary sector bets lie:
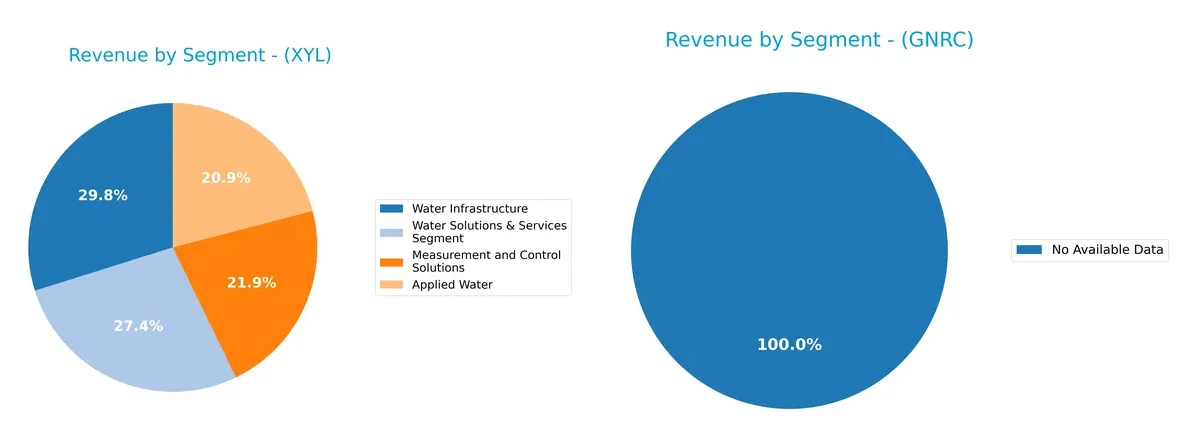
Xylem Inc. shows a diversified revenue mix with Water Infrastructure at $2.56B, Water Solutions & Services $2.34B, Measurement and Control Solutions $1.87B, and Applied Water $1.79B in 2024. Generac Holdings lacks available segmentation data. Xylem’s broad portfolio anchors it against sector volatility, leveraging infrastructure dominance and ecosystem lock-in. This diversification mitigates concentration risk common in single-segment firms.
Strengths and Weaknesses Comparison
This table compares the strengths and weaknesses of Xylem Inc. and Generac Holdings Inc.:
Xylem Inc. Strengths
- Diversified product segments including Applied Water, Measurement & Control, Water Infrastructure
- Favorable net margin at 10.59%
- Strong liquidity ratios: current ratio 1.62, quick ratio 1.28
- Low debt-to-equity at 0.17 and debt-to-assets at 11.01%
- High interest coverage ratio 42.17
- Solid global presence with significant revenues in US, Europe, Asia Pacific
Generac Holdings Inc. Strengths
- Favorable price-to-book ratio
- Low debt-to-equity and debt-to-assets ratios indicate low leverage
- Presence in a niche market segment
Xylem Inc. Weaknesses
- Return on equity at 8.34% is unfavorable versus cost of capital
- Price-to-earnings ratio high at 34.64 indicating expensive valuation
- Neutral return on invested capital at 6.42% versus WACC at 8.75%
- Moderate asset turnover at 0.51
- No direct innovation metrics provided
Generac Holdings Inc. Weaknesses
- Unfavorable net margin at 3.79%
- Zero return on equity and return on invested capital, indicating lack of profitability
- Unavailable WACC and poor liquidity with zero current and quick ratios
- Negative interest coverage ratio
- Zero asset turnover and fixed asset turnover ratios
- No dividend yield and unfavorable valuation at P/E 50.02
Xylem shows financial strength and diversified global operations but faces challenges in equity returns and valuation. Generac struggles with profitability and liquidity, which raises concerns about operational efficiency and financial stability.
The Moat Duel: Analyzing Competitive Defensibility
A structural moat is the only barrier that protects long-term profits from relentless competitive pressures. Here’s how Xylem Inc. and Generac Holdings stack up:
Xylem Inc.: Innovation-Driven Infrastructure Moat
Xylem’s moat stems from intangible assets and specialized engineering in water infrastructure. It sustains stable margins and 10.6% net profit. New digital solutions in 2026 could deepen this competitive edge.
Generac Holdings Inc.: Market Reach & Product Diversity Moat
Generac’s strength lies in broad product range and residential standby generators, differentiating from Xylem’s niche. However, profitability eroded sharply in 2025, signaling pressure on its competitive position. Expansion into clean energy may offer growth potential.
Verdict: Engineering Expertise vs. Product Breadth
Xylem’s focused innovation delivers consistent profitability despite a declining ROIC trend, while Generac suffers margin erosion and unclear moat metrics. I see Xylem as better equipped to defend market share long term.
Which stock offers better returns?
The past year shows stark contrasts: Xylem Inc. slips slightly with decelerating weakness, while Generac Holdings Inc. surges strongly on accelerating gains.
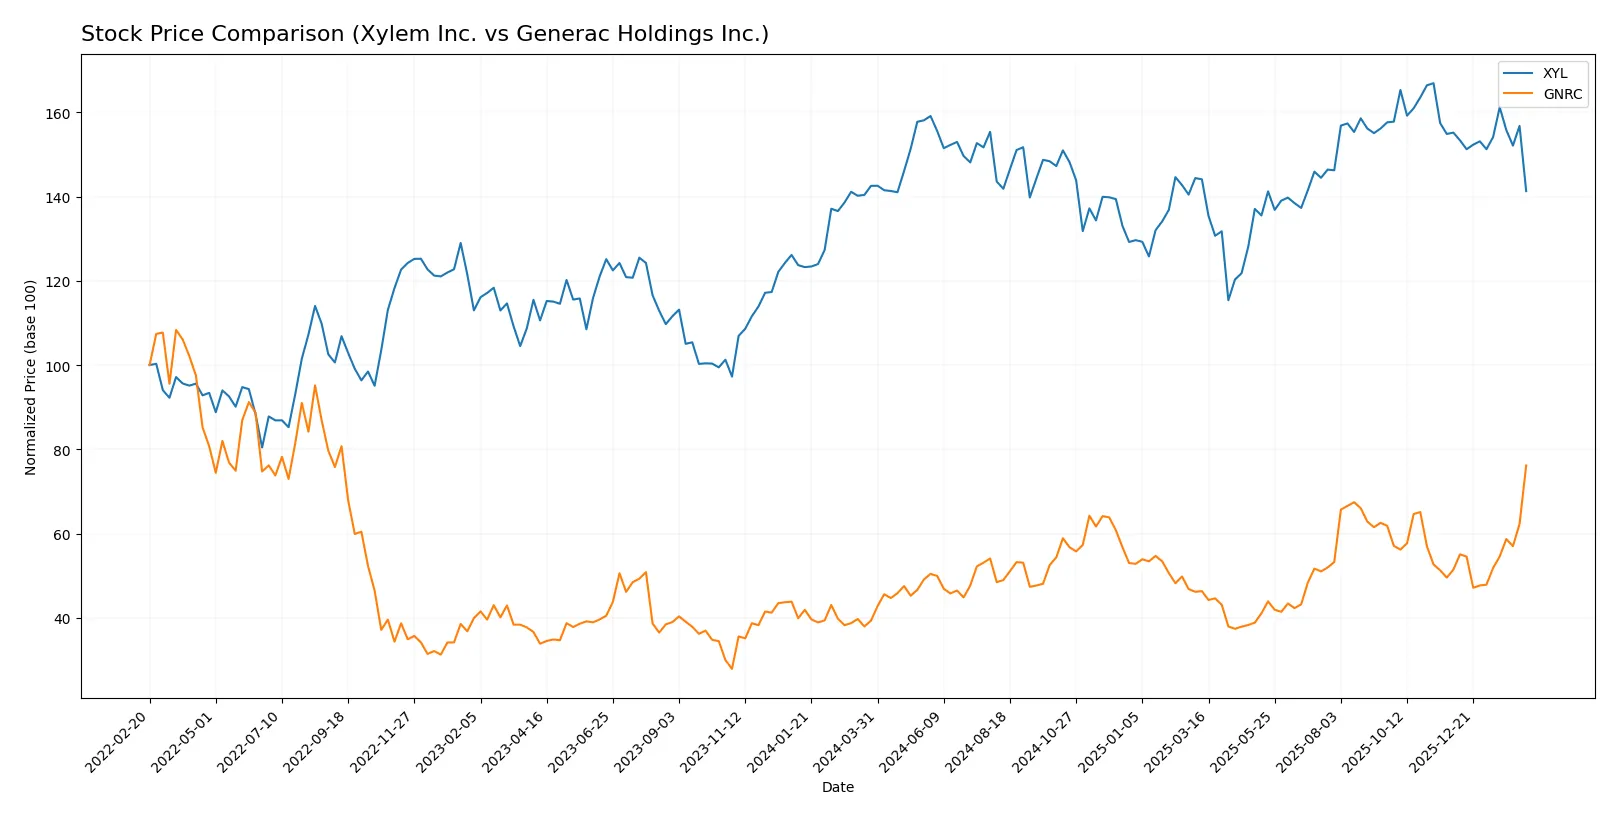
Trend Comparison
Xylem Inc. posts a -0.87% price change over the past 12 months, signaling a bearish trend with decelerating momentum and a high price range between 104.6 and 151.31.
Generac Holdings Inc. delivers a robust 93.64% gain, confirming a bullish trend with accelerating strength and a wider price band from 110.25 to 224.45.
Generac’s stock outperforms Xylem substantially, exhibiting the highest market return and clear upward momentum throughout the last year.
Target Prices
Analysts show a bullish consensus for Xylem Inc. and Generac Holdings Inc., indicating potential upside from current levels.
| Company | Target Low | Target High | Consensus |
|---|---|---|---|
| Xylem Inc. | 138 | 176 | 162.67 |
| Generac Holdings Inc. | 195 | 292 | 238.89 |
Both stocks trade significantly below consensus targets, signaling analyst expectations for strong price appreciation ahead. This gap suggests upside potential but requires monitoring sector cyclicality and execution risks.

Don’t Let Luck Decide Your Entry Point
Optimize your entry points with our advanced ProRealTime indicators. You’ll get efficient buy signals with precise price targets for maximum performance. Start outperforming now!
How do institutions grade them?
The following tables summarize recent institutional grades for Xylem Inc. and Generac Holdings Inc.:
Xylem Inc. Grades
Here are the latest grades assigned by well-known financial institutions for Xylem Inc.:
| Grading Company | Action | New Grade | Date |
|---|---|---|---|
| Citigroup | maintain | Buy | 2026-02-11 |
| Stifel | maintain | Buy | 2026-02-11 |
| RBC Capital | maintain | Outperform | 2026-02-11 |
| Barclays | maintain | Overweight | 2026-02-11 |
| Barclays | maintain | Overweight | 2026-01-07 |
| Mizuho | maintain | Neutral | 2026-01-05 |
| TD Cowen | maintain | Hold | 2025-12-05 |
| UBS | maintain | Buy | 2025-11-06 |
| Stifel | maintain | Buy | 2025-10-29 |
| RBC Capital | maintain | Outperform | 2025-10-29 |
Generac Holdings Inc. Grades
Below is a snapshot of recent institutional grades for Generac Holdings Inc.:
| Grading Company | Action | New Grade | Date |
|---|---|---|---|
| Barclays | maintain | Equal Weight | 2026-02-13 |
| Wells Fargo | maintain | Overweight | 2026-02-12 |
| Guggenheim | downgrade | Neutral | 2026-02-12 |
| Guggenheim | maintain | Buy | 2026-02-10 |
| Barclays | maintain | Equal Weight | 2026-01-20 |
| Canaccord Genuity | maintain | Buy | 2026-01-13 |
| Baird | upgrade | Outperform | 2026-01-09 |
| Citigroup | upgrade | Buy | 2026-01-08 |
| B of A Securities | maintain | Buy | 2026-01-07 |
| Wells Fargo | upgrade | Overweight | 2025-12-19 |
Which company has the best grades?
Xylem Inc. consistently holds Buy and Outperform grades from top-tier firms, signaling strong institutional confidence. Generac’s ratings are more mixed, with recent downgrades and several Equal Weight assignments, suggesting cautious investor sentiment. This divergence may influence risk-averse investors leaning towards Xylem.
Risks specific to each company
The following categories identify critical pressure points and systemic threats facing both firms in the 2026 market environment:
1. Market & Competition
Xylem Inc. (XYL)
- Operates globally with diversified water solutions, facing intense industrial machinery competition.
Generac Holdings Inc. (GNRC)
- Focuses on power generation with rising competition and evolving energy technologies challenging market share.
2. Capital Structure & Debt
Xylem Inc. (XYL)
- Maintains low debt-to-equity (0.17), strong interest coverage (42.17), indicating solid financial stability.
Generac Holdings Inc. (GNRC)
- Limited data but shows signs of weak debt management and negative interest coverage, raising financial risk concerns.
3. Stock Volatility
Xylem Inc. (XYL)
- Beta at 1.16 suggests moderate volatility, slightly above industrial average but manageable.
Generac Holdings Inc. (GNRC)
- High beta of 1.81 reflects elevated stock price swings, increasing investment risk.
4. Regulatory & Legal
Xylem Inc. (XYL)
- Exposure to water treatment regulations globally, requiring compliance but mitigated by diversified segments.
Generac Holdings Inc. (GNRC)
- Faces regulatory scrutiny in energy and emissions sectors, potentially increasing compliance costs.
5. Supply Chain & Operations
Xylem Inc. (XYL)
- Complex global supply chain with risks from geopolitical tensions but benefits from established distribution networks.
Generac Holdings Inc. (GNRC)
- Supply chain vulnerabilities exist due to reliance on specialized components for power solutions and storage.
6. ESG & Climate Transition
Xylem Inc. (XYL)
- Strong ESG positioning through water sustainability solutions, aligning with climate transition trends.
Generac Holdings Inc. (GNRC)
- Transition risks present as energy sector shifts to renewables; clean energy products still emerging.
7. Geopolitical Exposure
Xylem Inc. (XYL)
- Diversified global footprint reduces single-market risk but still exposed to trade tensions.
Generac Holdings Inc. (GNRC)
- Primarily US-focused but exposed to global supply chain disruptions and tariffs.
Which company shows a better risk-adjusted profile?
Xylem’s strongest risk is market competition in a cyclical industrial sector, yet its low debt and solid liquidity buffer systemic shocks. Generac faces significant financial risks from leverage and operational volatility amid competitive and regulatory pressures. Xylem’s safer debt profile and stronger Altman Z-Score (4.44 vs. 4.48 both safe zones, but Generac’s weaker ratios and higher beta undermine confidence) give it a superior risk-adjusted profile. Notably, Generac’s absence of dividends and unfavorable profitability ratios highlight caution, while Xylem’s moderate dividend yield and favorable liquidity support resilience.
Final Verdict: Which stock to choose?
Xylem Inc. (XYL) stands out for its operational resilience and solid cash flow generation. Its ability to maintain efficiency amid a challenging macro environment is a key superpower. However, declining returns on invested capital signal a point of vigilance. XYL suits portfolios targeting steady income with moderate growth aspirations.
Generac Holdings Inc. (GNRC) leverages a strategic moat in its niche market with strong cash flow yield and accelerating stock momentum. Despite weaker profitability metrics and volatile earnings, its recurring revenue potential and innovation investments provide a defensive edge versus XYL. GNRC fits well in growth-at-a-reasonable-price (GARP) portfolios seeking cyclical upside.
If you prioritize operational stability and consistent cash generation, Xylem offers the compelling choice due to its robust balance sheet and income quality. However, if you seek growth with higher risk tolerance, Generac outshines by capturing market acceleration and innovation upside. Both require careful monitoring of their distinctive risks and market cycles.
Disclaimer: Investment carries a risk of loss of initial capital. The past performance is not a reliable indicator of future results. Be sure to understand risks before making an investment decision.
Go Further
I encourage you to read the complete analyses of Xylem Inc. and Generac Holdings Inc. to enhance your investment decisions: