In the dynamic industrial machinery sector, Symbotic Inc. and Generac Holdings Inc. stand out as innovators reshaping their markets through advanced technology and diversified product offerings. Symbotic focuses on warehouse automation, enhancing efficiency for retailers, while Generac excels in power generation and energy solutions for residential and commercial customers. This article will explore both companies to identify which represents the most compelling investment opportunity for you.
Table of contents
Companies Overview
I will begin the comparison between Symbotic Inc. and Generac Holdings Inc. by providing an overview of these two companies and their main differences.
Symbotic Inc. Overview
Symbotic Inc. is an automation technology company focused on robotics and technology to enhance efficiency for retailers and wholesalers in the US. Its core product, The Symbotic System, is a comprehensive warehouse automation solution designed to cut costs, improve operational efficiency, and optimize inventory management. The company is headquartered in Wilmington, Massachusetts, and operates within the industrial machinery sector.
Generac Holdings Inc. Overview
Generac Holdings Inc. designs, manufactures, and sells power generation and energy storage products for residential, commercial, and industrial customers globally. Its portfolio includes standby generators, portable generators, outdoor power equipment, and clean energy solutions. Founded in 1959 and based in Waukesha, Wisconsin, Generac serves diverse markets through a broad distribution network comprising dealers, retailers, and e-commerce partners in the industrial machinery sector.
Key similarities and differences
Both Symbotic and Generac operate within the industrial machinery sector in the US, serving businesses with specialized equipment. Symbotic focuses on warehouse automation technology primarily for retailers and wholesalers, while Generac’s business model centers on power generation and energy storage products sold worldwide across residential and industrial markets. Generac has a larger workforce and broader product range, whereas Symbotic emphasizes robotics-driven efficiency improvements in supply chain operations.
Income Statement Comparison
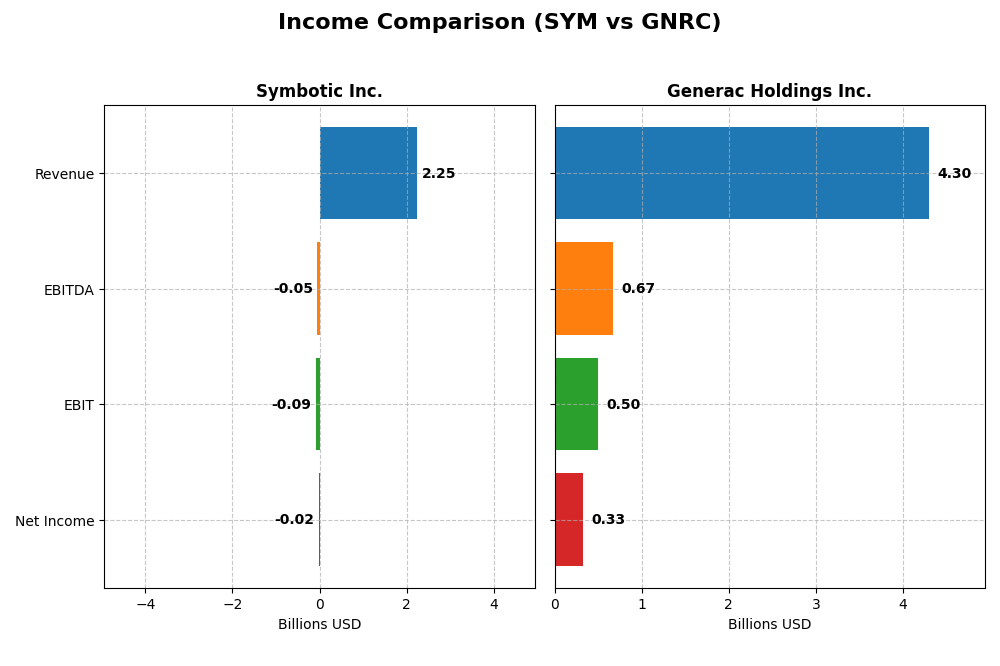
The table below compares the key income statement metrics for Symbotic Inc. and Generac Holdings Inc. for their most recent fiscal years, providing insight into their financial performance.
| Metric | Symbotic Inc. (SYM) | Generac Holdings Inc. (GNRC) |
|---|---|---|
| Market Cap | 42.8B | 8.97B |
| Revenue | 2.25B | 4.30B |
| EBITDA | -48.0M | 671M |
| EBIT | -92.1M | 499M |
| Net Income | -16.9M | 325M |
| EPS | -0.16 | 5.46 |
| Fiscal Year | 2025 | 2024 |
Income Statement Interpretations
Symbotic Inc.
Symbotic Inc. showed strong revenue growth from 2021 to 2025, increasing from 251M to 2.25B USD, with net income improving but remaining negative at -17M USD in 2025. Gross margins stayed neutral at 18.8%, while EBIT and net margins were unfavorable, reflecting ongoing losses. The latest year saw revenue growth of 25.7%, but EBIT declined by 10.6%, indicating margin pressures despite top-line expansion.
Generac Holdings Inc.
Generac Holdings experienced steady revenue growth from 2.49B USD in 2020 to 4.30B in 2024, with net income fluctuating but positive at 325M USD in 2024. Margins improved favorably, with a strong gross margin near 39% and EBIT margin at 11.6%. The most recent year showed modest revenue growth of 6.8%, supported by a 28.7% rise in EBIT and a 50.0% increase in net margin, signaling enhanced profitability.
Which one has the stronger fundamentals?
Generac demonstrates stronger fundamentals with consistent profitability, higher margins, and positive net income, despite slower recent revenue growth. Symbotic, while growing rapidly, remains unprofitable with negative EBIT and net margins. Both companies have favorable overall income statement evaluations, but Generac’s superior margin stability and profitability indicate more robust income fundamentals.
Financial Ratios Comparison
The table below presents a side-by-side comparison of key financial ratios for Symbotic Inc. (SYM) and Generac Holdings Inc. (GNRC) based on their most recent fiscal year data.
| Ratios | Symbotic Inc. (2025) | Generac Holdings Inc. (2024) |
|---|---|---|
| ROE | -7.65% | 13.04% |
| ROIC | -16.63% | 9.89% |
| P/E | -334.54 | 28.39 |
| P/B | 25.60 | 3.70 |
| Current Ratio | 1.08 | 1.97 |
| Quick Ratio | 0.99 | 0.97 |
| D/E (Debt-to-Equity) | 0.14 | 0.59 |
| Debt-to-Assets | 1.32% | 28.88% |
| Interest Coverage | 0 | 5.98 |
| Asset Turnover | 0.94 | 0.84 |
| Fixed Asset Turnover | 15.92 | 5.01 |
| Payout Ratio | 0 | 0.08% |
| Dividend Yield | 0 | 0.003% |
Interpretation of the Ratios
Symbotic Inc.
Symbotic shows mixed financial ratios with a slightly unfavorable overall assessment. Key concerns include negative net margin (-0.75%), return on equity (-7.65%), and return on invested capital (-16.63%), indicating profitability challenges. The company maintains a neutral liquidity position with a current ratio of 1.08. Symbotic does not pay dividends, likely reflecting reinvestment focus or growth phase priorities.
Generac Holdings Inc.
Generac presents a neutral ratios profile, with moderate profitability metrics such as net margin at 7.57%, return on equity at 13.04%, and return on invested capital at 9.89%. The company maintains a strong liquidity position (current ratio 1.97) and favorable interest coverage (5.56x). Like Symbotic, Generac does not pay dividends, which may suggest reinvestment or strategic allocation of capital elsewhere.
Which one has the best ratios?
Generac Holdings displays a more balanced and stable ratio profile with fewer unfavorable metrics and stronger liquidity and interest coverage than Symbotic. Symbotic’s profitability ratios are negative and liquidity is weaker. Overall, Generac’s ratios reflect more financial stability, while Symbotic’s indicate ongoing operational and profitability challenges.
Strategic Positioning
This section compares the strategic positioning of Symbotic Inc. and Generac Holdings Inc., including Market position, Key segments, and Exposure to technological disruption:
Symbotic Inc.
- Market position and competitive pressure
- Key segments and business drivers
- Exposure to technological disruption
Generac Holdings Inc.
- Market cap of 42.8B in industrial machinery; focused on automation technology for US retailers and wholesalers.
- Revenue driven mainly by Systems automation (2.12B), with growing Operation Services and Software Support.
- High exposure due to robotics and warehouse automation innovation improving efficiency and cost reduction.
Symbotic Inc. vs Generac Holdings Inc. Positioning
Symbotic’s strategy centers on advanced automation systems, focusing on warehouse efficiency, representing a concentrated and innovation-driven approach. Generac offers a diversified portfolio across power generation and energy storage with broad market coverage, balancing product variety and technological upgrades.
Which has the best competitive advantage?
Both companies show declining ROIC trends and are shedding value, indicating very unfavorable moats. Symbotic’s higher market cap and technological focus contrast with Generac’s diversification, but neither currently demonstrates a strong sustainable competitive advantage.
Stock Comparison
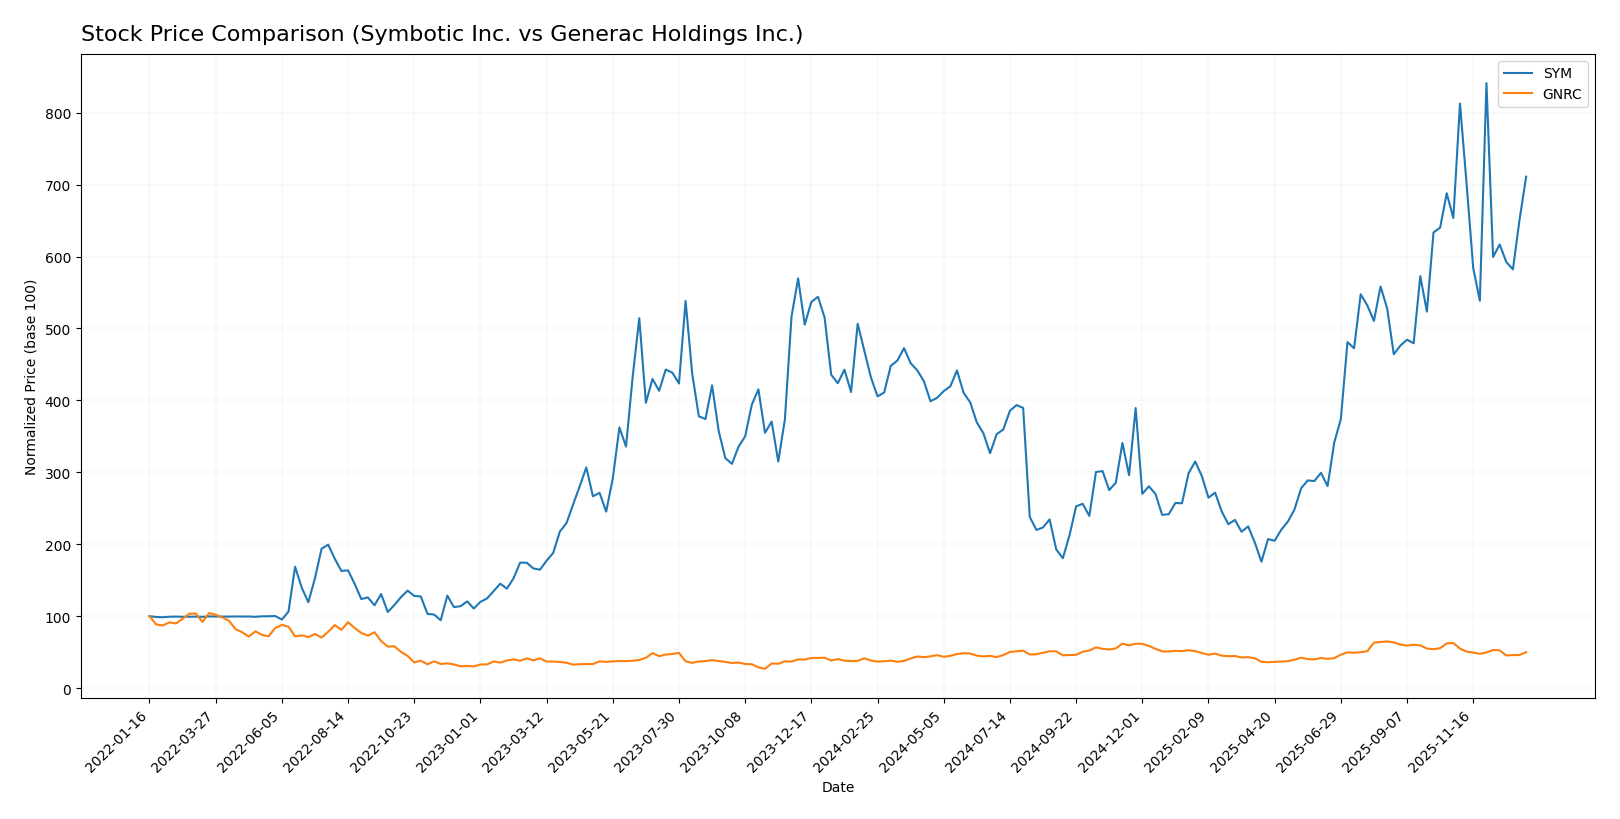
The stock price movements of Symbotic Inc. (SYM) and Generac Holdings Inc. (GNRC) over the past year reveal distinct bullish trends with decelerating momentum, alongside notable price volatility and shifts in trading dynamics.
Trend Analysis
Symbotic Inc. (SYM) experienced a strong bullish trend over the past 12 months, with a 64.58% price increase and decelerating momentum. Price volatility is moderate, with a standard deviation of 15.15, peaking at 83.77 and bottoming at 17.5.
Generac Holdings Inc. (GNRC) also showed a bullish trend over the same period, gaining 30.27%. This trend is decelerating amid higher volatility (std deviation 22.61), with a high of 198.8 and a low of 110.25. The recent quarter shows bearish pressure with a -20.41% drop.
Comparing the two, Symbotic Inc. delivered the highest market performance over the past year, outperforming Generac Holdings by a significant margin in price appreciation.
Target Prices
The current analyst target consensus for these industrial machinery companies reflects moderate to strong upside potential.
| Company | Target High | Target Low | Consensus |
|---|---|---|---|
| Symbotic Inc. | 83 | 41 | 65.11 |
| Generac Holdings Inc. | 248 | 184 | 210 |
Analysts expect Symbotic’s price to be near its current level of 70.82 USD, indicating a balanced outlook. Generac’s consensus target of 210 USD suggests significant upside from the current 152.78 USD price.
Analyst Opinions Comparison
This section compares analysts’ ratings and grades for Symbotic Inc. and Generac Holdings Inc.:
Rating Comparison
SYM Rating
- Rating: C+ with a very favorable status reflecting cautious optimism.
- Discounted Cash Flow Score: 5, very favorable, suggesting undervaluation.
- ROE Score: 1, very unfavorable, showing weak profit generation from equity.
- ROA Score: 1, very unfavorable, indicating poor asset utilization.
- Debt To Equity Score: 3, moderate, implying balanced financial risk.
- Overall Score: 2, moderate, showing average financial standing.
GNRC Rating
- Rating: B with a very favorable status indicating stronger analyst confidence.
- Discounted Cash Flow Score: 3, moderate, indicating fair valuation.
- ROE Score: 4, favorable, demonstrating efficient profit generation.
- ROA Score: 4, favorable, reflecting effective use of assets.
- Debt To Equity Score: 2, moderate, reflecting somewhat lower financial risk.
- Overall Score: 3, moderate, indicating slightly better overall financial health.
Which one is the best rated?
Based solely on the provided data, Generac Holdings Inc. holds a better rating overall with a B grade and higher scores in ROE, ROA, and overall financial health compared to Symbotic Inc.’s C+ rating and lower profitability metrics.
Scores Comparison
Here is a comparison of the Altman Z-Score and Piotroski Score for both companies:
SYM Scores
- Altman Z-Score: 13.05, indicating a very safe zone with low bankruptcy risk.
- Piotroski Score: 3, classified as very weak financial strength.
GNRC Scores
- Altman Z-Score: 3.73, indicating a safe zone with low bankruptcy risk.
- Piotroski Score: 7, classified as strong financial strength.
Which company has the best scores?
Based on the data, SYM has a much higher Altman Z-Score indicating stronger bankruptcy safety, while GNRC has a significantly better Piotroski Score showing stronger financial health. Each leads in a different score category.
Grades Comparison
Here is a comparison of the recent grades assigned to Symbotic Inc. and Generac Holdings Inc.:
Symbotic Inc. Grades
The table below summarizes the latest grades from reputable financial institutions for Symbotic Inc.:
| Grading Company | Action | New Grade | Date |
|---|---|---|---|
| Goldman Sachs | Downgrade | Sell | 2025-12-02 |
| Barclays | Maintain | Underweight | 2025-11-26 |
| Baird | Maintain | Neutral | 2025-11-26 |
| Craig-Hallum | Upgrade | Buy | 2025-11-25 |
| Northland Capital Markets | Maintain | Outperform | 2025-11-25 |
| Needham | Maintain | Buy | 2025-11-25 |
| Cantor Fitzgerald | Maintain | Overweight | 2025-11-25 |
| DA Davidson | Maintain | Neutral | 2025-11-25 |
| Citigroup | Maintain | Buy | 2025-11-25 |
| UBS | Downgrade | Sell | 2025-09-23 |
Overall, Symbotic’s grades show a mixed trend with several buy and outperform ratings, but notable recent downgrades to sell by Goldman Sachs and UBS.
Generac Holdings Inc. Grades
Below is a summary of recent grades from established financial firms for Generac Holdings Inc.:
| Grading Company | Action | New Grade | Date |
|---|---|---|---|
| Baird | Upgrade | Outperform | 2026-01-09 |
| Citigroup | Upgrade | Buy | 2026-01-08 |
| B of A Securities | Maintain | Buy | 2026-01-07 |
| Wells Fargo | Upgrade | Overweight | 2025-12-19 |
| JP Morgan | Upgrade | Overweight | 2025-12-08 |
| Citigroup | Maintain | Neutral | 2025-11-03 |
| Barclays | Maintain | Equal Weight | 2025-10-31 |
| UBS | Maintain | Buy | 2025-10-30 |
| Canaccord Genuity | Maintain | Buy | 2025-10-30 |
| Citigroup | Maintain | Neutral | 2025-10-21 |
Generac’s ratings predominantly show upgrades to outperform, buy, and overweight, with no recent sell ratings, indicating positive analyst sentiment.
Which company has the best grades?
Generac Holdings Inc. has received generally stronger and more consistent buy and outperform grades compared to Symbotic Inc., which has experienced mixed ratings including recent sell downgrades. For investors, this divergence may reflect differing analyst confidence levels and risk perceptions between the two companies.
Strengths and Weaknesses
Below is a comparative overview of key strengths and weaknesses for Symbotic Inc. (SYM) and Generac Holdings Inc. (GNRC) based on their recent financial and operational data.
| Criterion | Symbotic Inc. (SYM) | Generac Holdings Inc. (GNRC) |
|---|---|---|
| Diversification | Moderate: Revenue mainly from Systems (2.12B in 2025) with smaller segments in Operation Services and Software Support | Limited product segmentation data; focused on power generation and related products |
| Profitability | Weak: Negative net margin (-0.75%), ROE (-7.65%), ROIC (-16.63%) with declining trends; value destroying | Moderate: Positive net margin (7.57%), ROE (13.04%), ROIC (9.89%); but ROIC below WACC; neutral profitability |
| Innovation | High fixed asset turnover (15.92) suggests operational efficiency and asset utilization | Moderate fixed asset turnover (5.01) with continued investment in product development |
| Global presence | Not explicitly detailed; likely growing given revenue scale and product complexity | Established presence with diversified markets, supported by solid current ratio (1.97) |
| Market Share | Challenged: Shedding value and declining ROIC indicate competitive pressure | Stable: Neutral to favorable financial ratios and moderate market valuation |
In summary, Symbotic shows operational strengths in asset utilization but struggles with profitability and value creation, signaling caution. Generac maintains steadier profitability and financial health but faces pressure to improve returns relative to capital costs. Investors should weigh operational efficiency against profitability trends in their decision-making.
Risk Analysis
Below is a comparative table of key risks for Symbotic Inc. (SYM) and Generac Holdings Inc. (GNRC) based on the latest data available:
| Metric | Symbotic Inc. (SYM) | Generac Holdings Inc. (GNRC) |
|---|---|---|
| Market Risk | High (Beta 2.14, volatile stock) | Moderate (Beta 1.83) |
| Debt Level | Low (Debt to Equity 0.14, favorable) | Moderate (Debt to Equity 0.59) |
| Regulatory Risk | Moderate (Industrial automation sector) | Moderate (Energy and power equipment sector) |
| Operational Risk | Elevated (Negative profitability, weak ROE) | Moderate (Stable margins, good ROE) |
| Environmental Risk | Moderate (Warehouse automation focus) | Moderate to High (Energy products, emissions concerns) |
| Geopolitical Risk | Low (Domestic US operations) | Moderate (Global distribution channels) |
Symbotic faces the highest market risk due to its elevated beta and unfavorable profitability metrics, increasing operational risk. Generac’s moderate debt and stable returns reduce financial risk, though environmental and geopolitical factors tied to global supply chains may impact it. Caution is advised with Symbotic’s operational and market volatility.
Which Stock to Choose?
Symbotic Inc. (SYM) shows a favorable income statement with strong revenue growth of 791.94% over five years, but suffers from unfavorable profitability ratios including a negative ROE of -7.65% and ROIC of -16.63%, and a very unfavorable moat rating indicating value destruction. Its debt levels are low and the overall rating is moderate with a C+ score.
Generac Holdings Inc. (GNRC) displays steady income growth with a neutral 6.79% revenue increase last year and favorable profitability ratios, including a 13.04% ROE and 9.89% ROIC, though its WACC is slightly unfavorable. The company has moderate debt and a B rating with a neutral financial ratio evaluation, but also a very unfavorable moat due to declining ROIC.
For investors prioritizing growth potential, SYM’s rapid revenue expansion and favorable income statement might appear attractive despite weaker profitability and value creation concerns. Conversely, GNRC’s stable profitability and moderate financial health could be more suitable for investors seeking quality and steadier returns. Both companies show risks in value creation, suggesting careful consideration of risk tolerance.
Disclaimer: Investment carries a risk of loss of initial capital. The past performance is not a reliable indicator of future results. Be sure to understand risks before making an investment decision.
Go Further
I encourage you to read the complete analyses of Symbotic Inc. and Generac Holdings Inc. to enhance your investment decisions: