Home > Comparison > Industrials > ROP vs GNRC
The strategic rivalry between Roper Technologies, Inc. and Generac Holdings Inc. shapes the industrial machinery sector’s competitive landscape. Roper operates as a diversified technology-driven industrial conglomerate, emphasizing software and engineered products. In contrast, Generac focuses on power generation equipment for residential and commercial markets, combining manufacturing with energy solutions. This analysis evaluates which company’s business model offers superior risk-adjusted returns, guiding investors seeking durable industrial exposure.
Table of contents
Companies Overview
Roper Technologies and Generac Holdings stand as key players in the industrial machinery market, each shaping their niche with distinct approaches.
Roper Technologies, Inc.: Diversified Industrial Software and Solutions Leader
Roper Technologies dominates with its diversified industrial software and engineered products portfolio. Its core revenue derives from software solutions spanning financial, healthcare, and supply chain sectors, alongside precision instruments and control systems. In 2026, Roper emphasizes cloud-based analytics and automation to deepen integration across industries, leveraging its broad technology base to drive recurring revenue.
Generac Holdings Inc.: Power Generation Innovator
Generac Holdings focuses on power generation equipment and energy storage systems for residential, commercial, and industrial markets. It generates income through sales of generators, portable power devices, and clean energy solutions. The company’s 2026 strategy centers on expanding clean energy and remote monitoring technologies, aiming to capitalize on rising demand for energy resilience and sustainability.
Strategic Collision: Similarities & Divergences
Both companies compete in industrial machinery but diverge sharply in strategy. Roper pursues a software-centric, diversified model while Generac focuses on hardware-driven power solutions. They battle primarily over technology integration and customer reach in industrial applications. Their distinct investment profiles reflect Roper’s recurring revenue strength versus Generac’s exposure to energy market cycles.
Income Statement Comparison
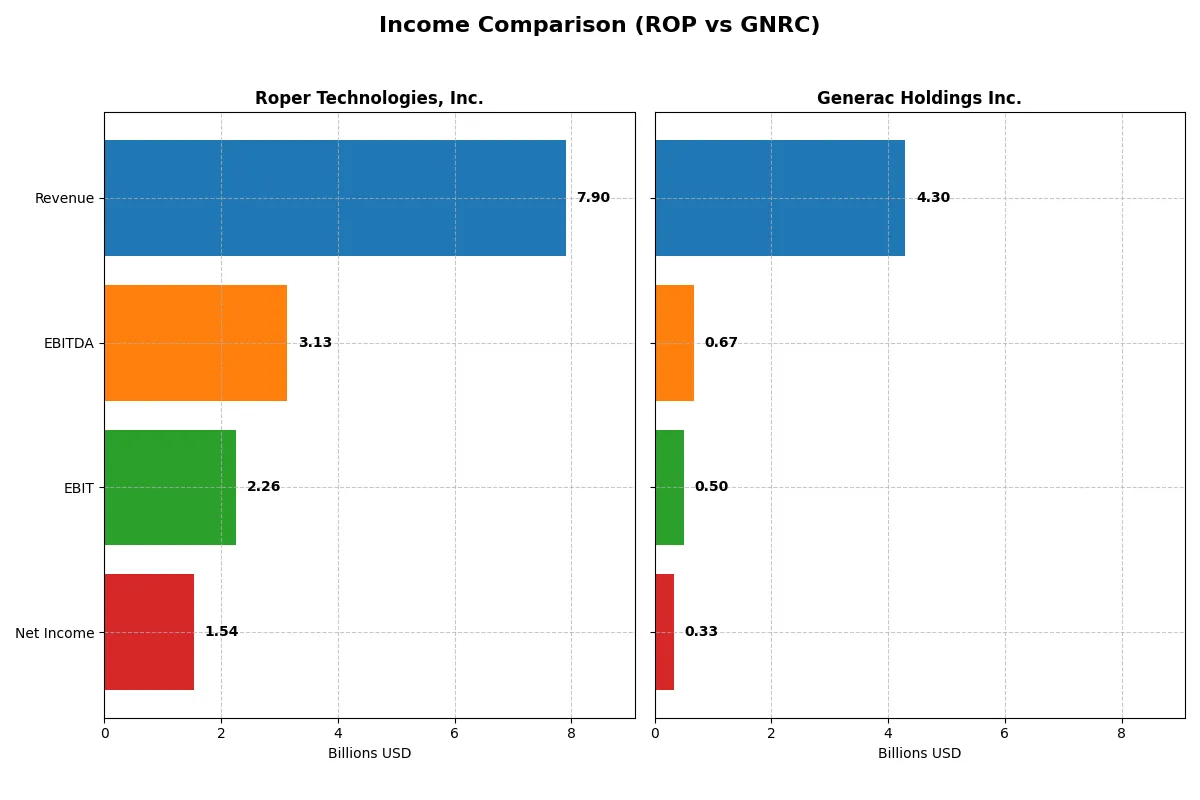
This data dissects the core profitability and scalability of both corporate engines to reveal who dominates the bottom line:
| Metric | Roper Technologies, Inc. (ROP) | Generac Holdings Inc. (GNRC) |
|---|---|---|
| Revenue | 7.90B | 4.30B |
| Cost of Revenue | 2.43B | 2.63B |
| Operating Expenses | 3.24B | 1.13B |
| Gross Profit | 5.47B | 1.67B |
| EBITDA | 3.13B | 671M |
| EBIT | 2.26B | 499M |
| Interest Expense | 325M | 90M |
| Net Income | 1.54B | 325M |
| EPS | 14.31 | 5.46 |
| Fiscal Year | 2025 | 2024 |
Income Statement Analysis: The Bottom-Line Duel
This income statement comparison reveals which company runs a more efficient and profitable business engine over recent years.
Roper Technologies, Inc. Analysis
Roper Technologies shows a strong revenue climb from $4.8B in 2021 to $7.9B in 2025, with net income rising from $1.1B to $1.5B. Its gross margin holds steady at 69.2%, signaling robust pricing power. Despite a slight net margin dip to 19.4% in 2025, Roper maintains excellent operating efficiency and consistent earnings momentum.
Generac Holdings Inc. Analysis
Generac’s revenue grows from $2.5B in 2020 to $4.3B in 2024, but net income fluctuates, declining overall to $325M. Gross margin sits lower at 38.8%, reflecting higher cost pressure. Yet, the company accelerated EBIT and net margin growth in the latest year, indicating improving operational leverage and profit conversion after prior volatility.
Verdict: Margin Strength vs. Earnings Recovery
Roper dominates with higher revenue scale and superior margins, delivering steady income growth and solid cash generation. Generac shows promising recovery in profitability but trails in margin quality and net income consistency. Investors seeking stability and durable profitability may favor Roper’s resilient margin profile over Generac’s improving but less certain earnings trajectory.
Financial Ratios Comparison
These vital ratios act as a diagnostic tool to expose the underlying fiscal health, valuation premiums, and capital efficiency of the companies compared below:
| Ratios | Roper Technologies, Inc. (ROP) | Generac Holdings Inc. (GNRC) |
|---|---|---|
| ROE | 8.2% | 13.0% |
| ROIC | 5.5% | 9.9% |
| P/E | 35.9 | 28.4 |
| P/B | 2.95 | 3.70 |
| Current Ratio | 0.40 | 1.97 |
| Quick Ratio | 0.37 | 0.97 |
| D/E | 0.41 | 0.59 |
| Debt-to-Assets | 24.5% | 28.9% |
| Interest Coverage | 7.7x | 6.0x |
| Asset Turnover | 0.22 | 0.84 |
| Fixed Asset Turnover | 47.0 | 5.0 |
| Payout Ratio | 20.8% | 0.08% |
| Dividend Yield | 0.58% | 0.003% |
| Fiscal Year | 2024 | 2024 |
Efficiency & Valuation Duel: The Vital Signs
Financial ratios act as a company’s DNA, uncovering operational strengths and hidden risks behind surface-level performance.
Roper Technologies, Inc.
Roper shows a strong net margin of 19.44%, signaling profitability, but its ROE and ROIC are zero, revealing inefficiencies in capital use. The P/E ratio at 31.06 suggests the stock is expensive relative to earnings. A modest dividend yield of 0.74% indicates limited shareholder returns, possibly favoring reinvestment in intangible assets and R&D.
Generac Holdings Inc.
Generac posts a moderate net margin of 7.57% with a decent ROE of 13.04% and ROIC near 9.89%, reflecting reasonable operational efficiency. Its P/E ratio of 28.39 is high but slightly less stretched than Roper’s. The absence of dividends implies reinvestment into growth initiatives and asset turnover improvements, supported by a solid current ratio of 1.97.
Premium Valuation vs. Operational Safety
Roper trades at a higher valuation but struggles with capital efficiency, while Generac balances moderate profitability with healthier liquidity and reinvestment potential. Investors seeking operational stability may prefer Generac, whereas those accepting valuation risk might consider Roper’s growth focus.
Which one offers the Superior Shareholder Reward?
Roper Technologies, Inc. (ROP) offers a superior shareholder reward compared to Generac Holdings Inc. (GNRC). ROP pays a modest dividend yield near 0.74% with a sustainable payout ratio around 21–23%, backed by strong free cash flow coverage (over 90%). It also engages in consistent share buybacks, enhancing total shareholder returns. GNRC, by contrast, pays virtually no dividends (yield near 0%) and maintains a very low payout ratio, relying instead on reinvestment into growth and capital expenditure. However, GNRC’s free cash flow coverage is less robust, and its buyback program appears limited. Historically in industrial tech sectors, a balanced distribution strategy like ROP’s—combining dividends and buybacks—tends to outperform pure growth models in delivering risk-adjusted returns. I conclude that Roper’s shareholder-friendly capital allocation offers the more attractive total return profile for 2026 investors.
Comparative Score Analysis: The Strategic Profile
The radar chart reveals the fundamental DNA and trade-offs of Roper Technologies, Inc. and Generac Holdings Inc., highlighting their distinct financial strengths and weaknesses:
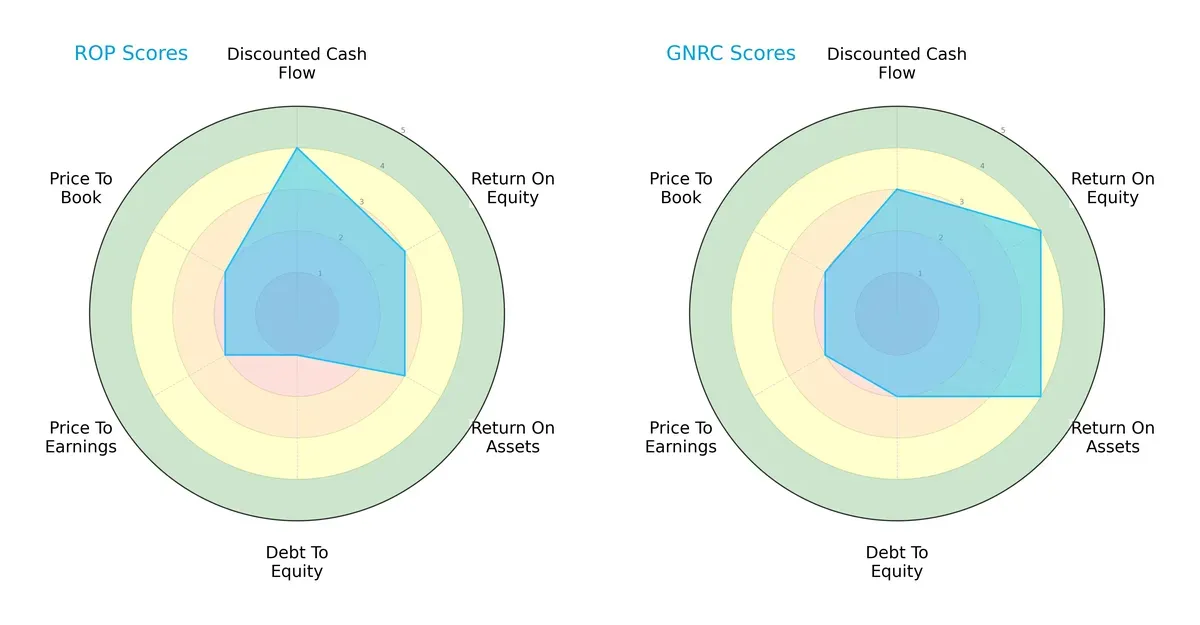
Roper shows strength in discounted cash flow (DCF) with a score of 4 but struggles with debt-to-equity at 1. Generac balances higher returns on equity (4) and assets (4) with moderate leverage (2). Generac presents a more balanced profile, while Roper relies heavily on cash flow advantage but carries higher financial risk.
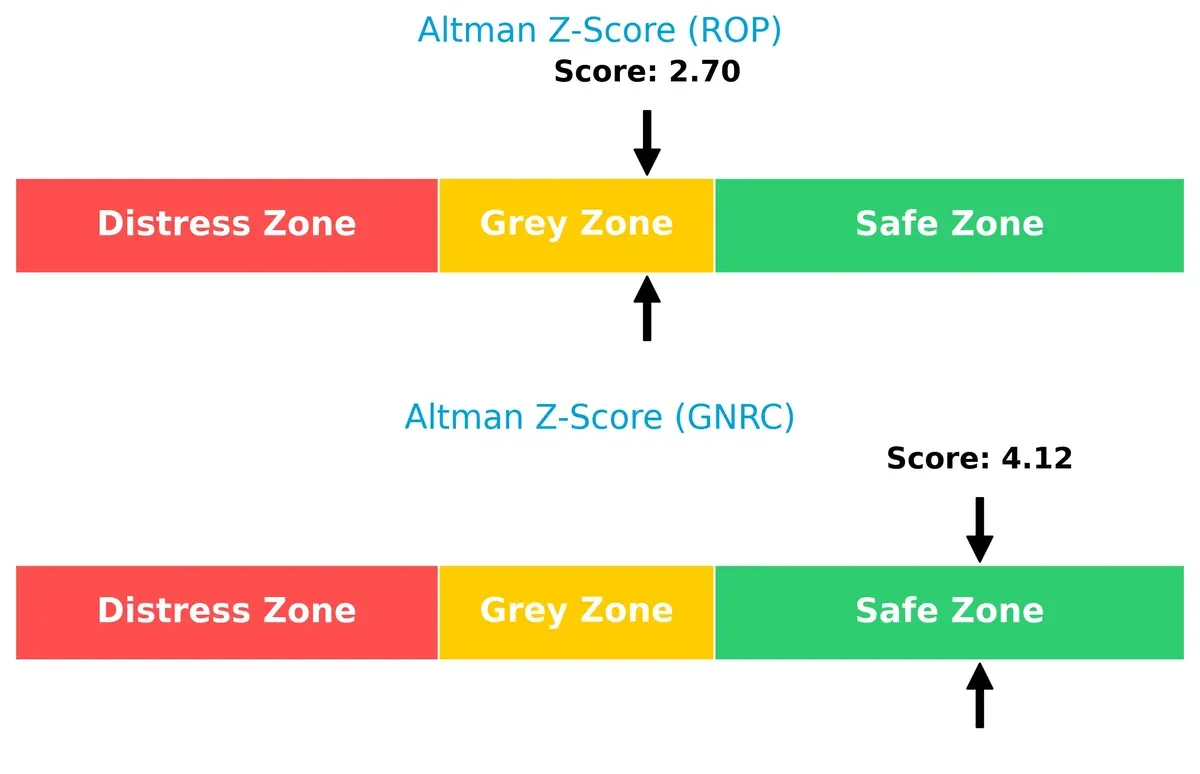
Bankruptcy Risk: Solvency Showdown
Generac’s Altman Z-Score of 4.12 places it firmly in the safe zone, while Roper’s 2.70 situates it in the grey zone. This gap implies Generac has a stronger buffer against bankruptcy risks amidst current market volatility:
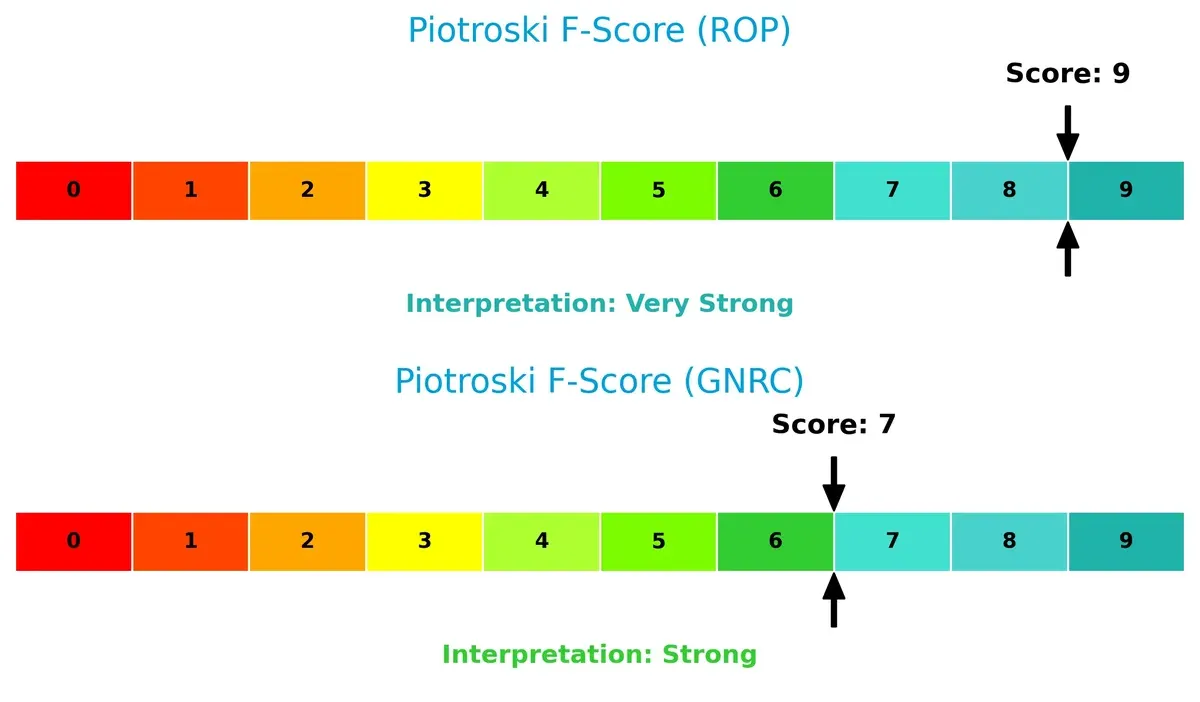
Financial Health: Quality of Operations
Roper scores a perfect 9 in the Piotroski F-Score, signaling peak financial health and operational efficiency. Generac’s 7 is strong but shows slightly more internal risk compared to Roper’s flawless metrics:
How are the two companies positioned?
This section dissects Roper and Generac’s operational DNA by comparing their revenue distribution and internal dynamics. The goal is to confront their economic moats to reveal which business model delivers the most resilient competitive advantage today.
Revenue Segmentation: The Strategic Mix
The following visual comparison dissects how Roper Technologies, Inc. and Generac Holdings Inc. diversify their income streams and where their primary sector bets lie:
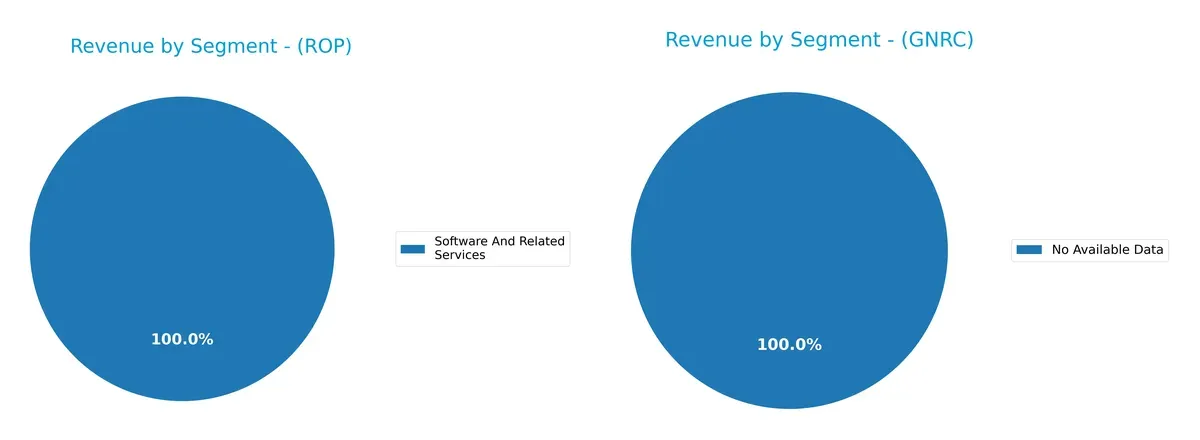
Roper Technologies shows a diverse revenue mix, with segments like Application Software ($3.19B), Network Software ($1.44B), and Technology Enabled Products ($1.55B) in 2023. In contrast, Generac Holdings lacks available data for segmentation. Roper’s balanced portfolio reduces concentration risk and supports ecosystem lock-in, while Generac’s undisclosed breakdown limits insight on its sector exposure and strategic focus.
Strengths and Weaknesses Comparison
This table compares the Strengths and Weaknesses of Roper Technologies and Generac Holdings:
Roper Technologies Strengths
- Strong net margin at 19.44%
- Favorable debt to equity and debt to assets ratios
- High interest coverage of 6.96 indicates solid ability to meet interest payments
Generac Holdings Strengths
- Favorable current ratio at 1.97 shows good short-term liquidity
- Favorable debt to assets at 28.88%
- Strong fixed asset turnover at 5.01 indicates efficient use of assets
Roper Technologies Weaknesses
- Zero ROE and ROIC indicate weak profitability and capital efficiency
- Unfavorable liquidity ratios with current and quick ratios at zero
- Unfavorable P/E of 31.06 suggests expensive valuation
Generac Holdings Weaknesses
- Neutral to unfavorable profitability with net margin 7.57% and ROE 13.04%
- Unfavorable WACC at 11.42% raises capital cost concerns
- Unfavorable P/B at 3.7 and zero dividend yield
Roper’s strengths lie in profitability and low leverage, but weak returns and liquidity ratios are red flags. Generac shows balanced liquidity and asset efficiency but faces challenges in profitability and valuation. Both firms exhibit contrasting financial profiles impacting strategic priorities.
The Moat Duel: Analyzing Competitive Defensibility
A structural moat is the only barrier protecting long-term profits from relentless competition erosion. Let’s dissect the moats of Roper Technologies and Generac Holdings:
Roper Technologies, Inc.: Diversified Product Ecosystem with Intangible Assets
Roper’s moat stems from a broad portfolio of engineered products and cloud-based software, fostering high ROIC and margin stability. Its 2025 income statement shows robust gross margin at 69%, signaling strong pricing power. Expansion into healthcare and data analytics could deepen this moat in 2026.
Generac Holdings Inc.: Cost Advantage in Power Generation Equipment
Generac’s competitive edge lies in cost-efficient manufacturing and distribution of power solutions, supporting moderate margins and rapid EBIT growth. Unlike Roper, Generac targets residential and commercial markets with scalable product lines. Its innovation in clean energy storage presents growth opportunities in the evolving energy sector.
Diverse Ecosystem vs. Cost Efficiency: Who Holds the Stronger Moat?
Roper’s intangible asset-driven moat offers wider defensibility through diversified revenue streams and high margins. Generac’s cost advantage is narrower and currently under pressure with declining ROIC. I see Roper better positioned to defend market share amid rising competition and technological shifts.
Which stock offers better returns?
The past year reveals stark contrasts in price trajectories and trading dynamics between the two companies, highlighting clear divergence in investor sentiment and market performance.
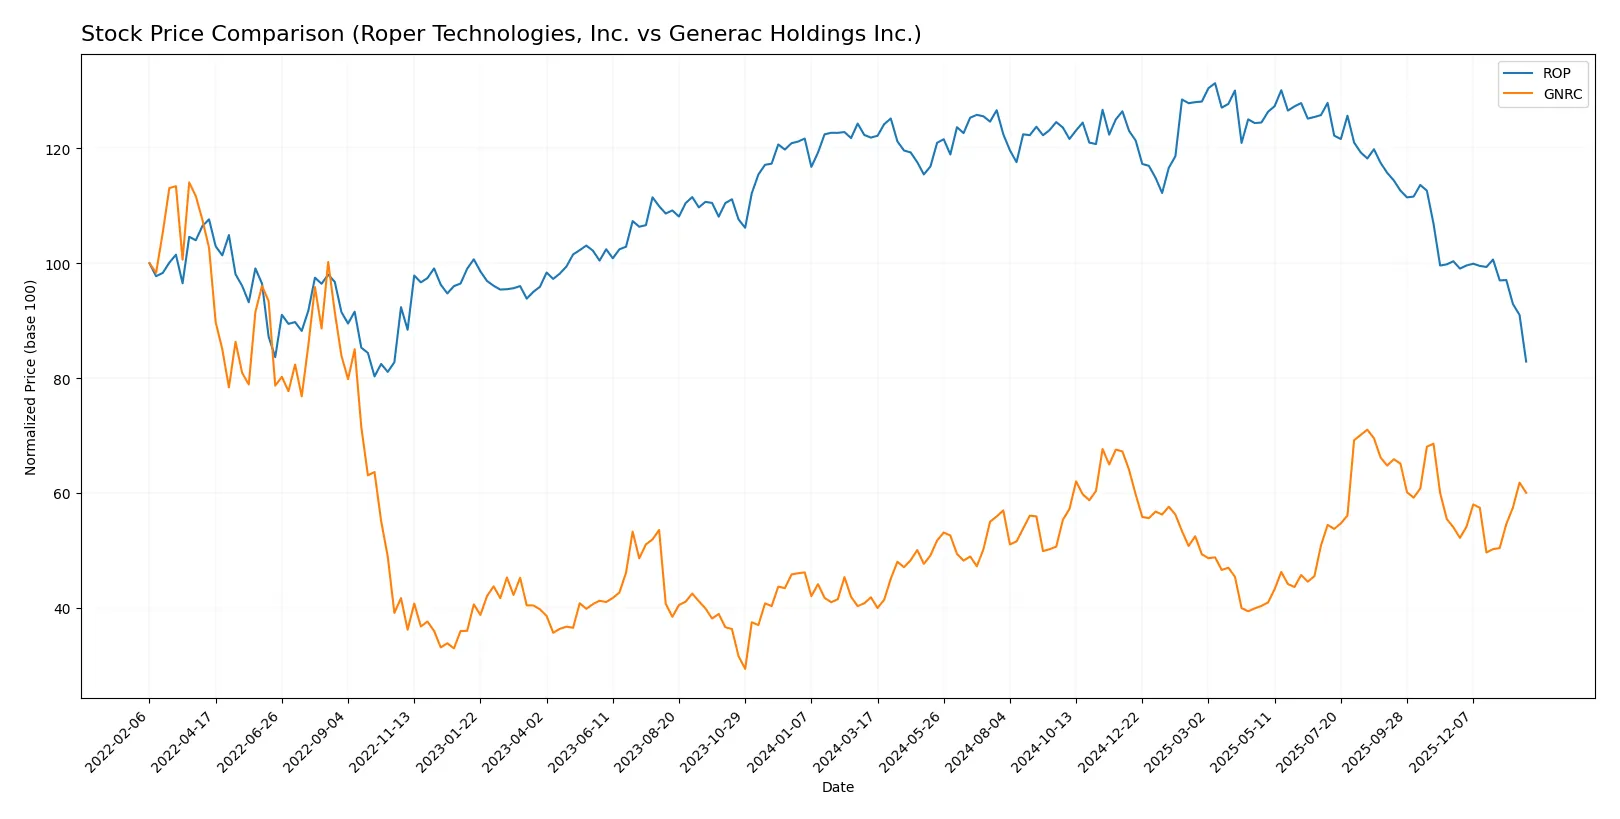
Trend Comparison
Roper Technologies, Inc. shows a bearish trend over the past 12 months with a -32.0% price change and decelerating decline, hitting a low of 371.23 and high of 588.38 amid high volatility (44.8% std deviation).
Generac Holdings Inc. demonstrates a bullish trend, rising 43.5% over the past year with accelerating gains, reaching a high of 198.8 and low of 110.25, accompanied by moderate volatility (21.99% std deviation).
Generac outperformed Roper significantly, delivering positive and accelerating returns while Roper’s stock price declined sharply, marking Generac as the stronger market performer during this period.
Target Prices
Analysts present a cautiously optimistic target consensus for both Roper Technologies and Generac Holdings.
| Company | Target Low | Target High | Consensus |
|---|---|---|---|
| Roper Technologies, Inc. | 365 | 575 | 475.5 |
| Generac Holdings Inc. | 184 | 248 | 208.13 |
The consensus target prices for both stocks suggest upside potential versus current prices: Roper trades near 371, well below its 475.5 consensus, while Generac at 168 is also below its 208.13 target. This indicates measured confidence in future growth.

Don’t Let Luck Decide Your Entry Point
Optimize your entry points with our advanced ProRealTime indicators. You’ll get efficient buy signals with precise price targets for maximum performance. Start outperforming now!
How do institutions grade them?
This section compares the latest institutional grades for Roper Technologies, Inc. and Generac Holdings Inc.:
Roper Technologies, Inc. Grades
The following table summarizes recent grades from recognized financial institutions for Roper Technologies, Inc.:
| Grading Company | Action | New Grade | Date |
|---|---|---|---|
| Goldman Sachs | Maintain | Neutral | 2026-01-29 |
| Argus Research | Downgrade | Hold | 2026-01-28 |
| Truist Securities | Maintain | Buy | 2026-01-28 |
| Mizuho | Maintain | Underperform | 2026-01-28 |
| Oppenheimer | Downgrade | Perform | 2026-01-28 |
| RBC Capital | Maintain | Sector Perform | 2026-01-28 |
| Barclays | Maintain | Underweight | 2026-01-28 |
| Stifel | Downgrade | Hold | 2026-01-28 |
| Citigroup | Maintain | Buy | 2026-01-28 |
| JP Morgan | Maintain | Underweight | 2026-01-28 |
Generac Holdings Inc. Grades
This table shows recent grades from credible analysts for Generac Holdings Inc.:
| Grading Company | Action | New Grade | Date |
|---|---|---|---|
| Barclays | Maintain | Equal Weight | 2026-01-20 |
| Canaccord Genuity | Maintain | Buy | 2026-01-13 |
| Baird | Upgrade | Outperform | 2026-01-09 |
| Citigroup | Upgrade | Buy | 2026-01-08 |
| B of A Securities | Maintain | Buy | 2026-01-07 |
| Wells Fargo | Upgrade | Overweight | 2025-12-19 |
| JP Morgan | Upgrade | Overweight | 2025-12-08 |
| Citigroup | Maintain | Neutral | 2025-11-03 |
| Barclays | Maintain | Equal Weight | 2025-10-31 |
| Canaccord Genuity | Maintain | Buy | 2025-10-30 |
Which company has the best grades?
Generac Holdings Inc. consistently receives higher ratings, including several upgrades to Buy, Outperform, and Overweight. Roper Technologies shows mixed grades with multiple downgrades and neutral to underweight recommendations. This disparity suggests stronger analyst confidence in Generac, possibly influencing investor sentiment and risk perception.
Risks specific to each company
The following categories identify the critical pressure points and systemic threats facing both firms in the 2026 market environment:
1. Market & Competition
Roper Technologies, Inc.
- Diversified software and engineered products reduce exposure but face intense industrial competition.
Generac Holdings Inc.
- Focused on power generation with rising competition from clean energy disruptors.
2. Capital Structure & Debt
Roper Technologies, Inc.
- Favorable debt to assets and interest coverage, but weak current and quick ratios signal liquidity risks.
Generac Holdings Inc.
- Moderate leverage with good current ratio and manageable interest coverage, showing balanced financial risk.
3. Stock Volatility
Roper Technologies, Inc.
- Beta near 1 indicates market-level volatility, offering moderate risk exposure.
Generac Holdings Inc.
- High beta (1.83) signals elevated stock price swings and higher investor risk.
4. Regulatory & Legal
Roper Technologies, Inc.
- Operations across multiple sectors expose it to varied regulatory regimes, increasing compliance complexity.
Generac Holdings Inc.
- Power equipment manufacturing faces stringent environmental and safety regulations that could raise costs.
5. Supply Chain & Operations
Roper Technologies, Inc.
- Complex global supply chain for diverse products may create operational bottlenecks and cost pressures.
Generac Holdings Inc.
- Reliance on specialized components for generators increases vulnerability to supply disruptions.
6. ESG & Climate Transition
Roper Technologies, Inc.
- Exposure to tech and healthcare sectors offers ESG opportunities but requires ongoing innovation.
Generac Holdings Inc.
- Transition to clean energy products is in progress but legacy fossil-fuel-based generators pose risks.
7. Geopolitical Exposure
Roper Technologies, Inc.
- Primarily US-based with moderate global footprint, limiting geopolitical risk but susceptible to trade policies.
Generac Holdings Inc.
- US-centric operations reduce geopolitical risks but limit international growth opportunities.
Which company shows a better risk-adjusted profile?
Roper’s most impactful risk lies in its weak liquidity ratios despite strong debt metrics, raising short-term financial concerns. Generac faces higher stock volatility and regulatory risks due to its concentrated market and evolving energy landscape. Overall, Generac shows a better risk-adjusted profile, supported by a safer Altman Z-score and stronger operational metrics, despite its higher beta. Roper’s liquidity weaknesses and unfavorable valuation multiples justify caution in this market cycle.
Final Verdict: Which stock to choose?
Roper Technologies, Inc. excels as a cash-generating powerhouse with robust margins and steady revenue growth. Its main point of vigilance lies in a stretched balance sheet and declining return on invested capital, which may pressure future profitability. It suits investors targeting aggressive growth with tolerance for leverage risk.
Generac Holdings Inc. leverages a strategic moat rooted in resilient recurring revenue and solid operational returns. It offers better liquidity and a safer balance sheet than Roper, appealing to risk-averse investors. This profile fits well into a GARP (Growth at a Reasonable Price) portfolio seeking steady yet modest expansion.
If you prioritize high-margin cash flow and can stomach leverage risks, Roper Technologies presents a compelling scenario due to its operational strength and growth trajectory. However, if you seek superior financial stability and consistent returns with less volatility, Generac Holdings outshines as the more prudent choice. Both stocks carry risks linked to declining ROIC trends, demanding careful portfolio fit and risk tolerance assessment.
Disclaimer: Investment carries a risk of loss of initial capital. The past performance is not a reliable indicator of future results. Be sure to understand risks before making an investment decision.
Go Further
I encourage you to read the complete analyses of Roper Technologies, Inc. and Generac Holdings Inc. to enhance your investment decisions: