Rockwell Automation, Inc. (ROK) and Generac Holdings Inc. (GNRC) both operate in the industrial machinery sector, yet they target distinct yet occasionally overlapping markets. Rockwell leads in industrial automation and digital transformation, while Generac focuses on power generation and energy solutions. Their innovation strategies reflect different approaches to industrial challenges. This article will dissect their strengths and help you decide which company deserves a spot in your investment portfolio.
Table of contents
Companies Overview
I will begin the comparison between Rockwell Automation, Inc. and Generac Holdings Inc. by providing an overview of these two companies and their main differences.
Rockwell Automation Overview
Rockwell Automation, Inc. delivers industrial automation and digital transformation solutions globally. Its offerings span intelligent devices, software and control, and lifecycle services. The company targets discrete, hybrid, and process end markets such as automotive, food and beverage, and oil and gas. Headquartered in Milwaukee, Wisconsin, Rockwell Automation has a market cap of $46B and employs 27,000 people.
Generac Holdings Overview
Generac Holdings Inc. designs and manufactures power generation equipment, energy storage, and related products for residential, commercial, and industrial markets worldwide. Its portfolio includes standby generators, portable generators, outdoor power equipment, and clean energy solutions. Based in Waukesha, Wisconsin, Generac has a market cap of $9B and around 5,400 employees.
Key similarities and differences
Both companies operate within the industrial machinery sector and serve diverse markets with specialized equipment. Rockwell Automation focuses on automation hardware, software, and services across multiple industrial segments, emphasizing digital transformation. Generac centers on power generation and energy solutions, targeting residential to industrial customers with a broader product range including portable equipment and clean energy technologies. Their scale and workforce size also differ significantly.
Income Statement Comparison
The table below compares the key income statement metrics for Rockwell Automation, Inc. and Generac Holdings Inc. for their most recent fiscal years.
| Metric | Rockwell Automation, Inc. (ROK) | Generac Holdings Inc. (GNRC) |
|---|---|---|
| Market Cap | 46.1B | 8.97B |
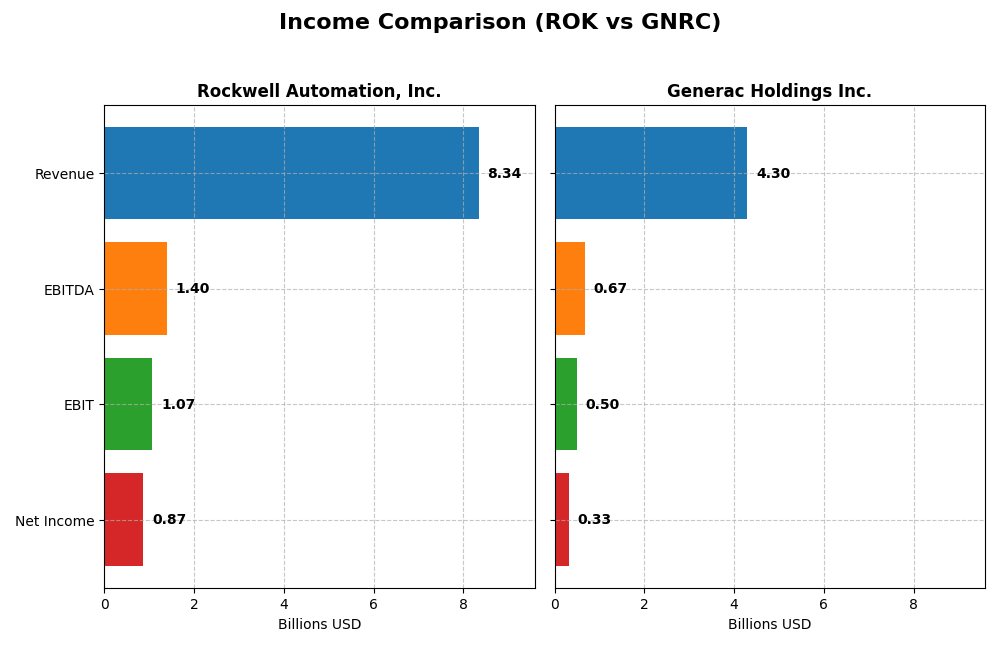
| Revenue | 8.34B | 4.30B |
| EBITDA | 1.40B | 671M |
| EBIT | 1.07B | 499M |
| Net Income | 869M | 325M |
| EPS | 7.69 | 5.46 |
| Fiscal Year | 2025 | 2024 |
Income Statement Interpretations
Rockwell Automation, Inc.
Rockwell Automation’s revenue showed a modest growth of 0.97% in the latest year, reaching $8.34B, while net income declined by 9.64% to $867M. Gross margin improved favorably to 48.14%, but EBIT and net margins contracted. The 2025 fiscal year revealed slowing growth and margin compression, despite strong profitability metrics over the period.
Generac Holdings Inc.
Generac’s revenue increased by 6.79% to $4.30B in 2024, with net income rising 49.97% to $325M. Gross margin expanded to 38.77%, and EBIT margin improved to 11.62%. The recent year demonstrated robust earnings and margin gains, supported by favorable operational leverage, although net income growth over five years remained slightly negative.
Which one has the stronger fundamentals?
Generac presents a more favorable overall income statement evaluation with 64% positive metrics, including solid recent growth in net income and margins. Rockwell shows stronger absolute margins but faces unfavorable recent trends in net income and EPS declines. Generac’s better momentum contrasts with Rockwell’s margin strength, highlighting differing fundamental profiles.
Financial Ratios Comparison
This table compares key financial ratios of Rockwell Automation, Inc. (ROK) and Generac Holdings Inc. (GNRC) based on their most recent fiscal year data.
| Ratios | Rockwell Automation, Inc. (ROK) | Generac Holdings Inc. (GNRC) |
|---|---|---|
| ROE | 23.8% | 13.0% |
| ROIC | 13.7% | 9.9% |
| P/E | 45.3 | 28.4 |
| P/B | 10.8 | 3.7 |
| Current Ratio | 1.14 | 1.97 |
| Quick Ratio | 0.77 | 0.97 |
| D/E (Debt-to-Equity) | 1.00 | 0.59 |
| Debt-to-Assets | 32.5% | 28.9% |
| Interest Coverage | 9.1 | 6.0 |
| Asset Turnover | 0.74 | 0.84 |
| Fixed Asset Turnover | 6.95 | 5.01 |
| Payout ratio | 68.0% | 0.08% |
| Dividend yield | 1.50% | 0.003% |
Interpretation of the Ratios
Rockwell Automation, Inc.
Rockwell Automation shows strong profitability with favorable net margin (10.42%), ROE (23.78%), and ROIC (13.71%), but its valuation metrics, including high PE (45.33) and PB (10.78), are unfavorable. Liquidity ratios are mixed, with a neutral current ratio (1.14) but a weak quick ratio (0.77). The company pays dividends with a moderate yield (1.5%), supported by stable free cash flow coverage, posing limited payout risk.
Generac Holdings Inc.
Generac’s financial ratios present a neutral outlook with modest net margin (7.57%), ROE (13.04%), and ROIC (9.89%). Its liquidity is favorable, highlighted by a strong current ratio (1.97) and manageable debt-to-assets (28.88%). The absence of dividend payments reflects a reinvestment or growth focus; free cash flow is variable, and the company does not currently return capital to shareholders via dividends or buybacks.
Which one has the best ratios?
Rockwell Automation generally offers stronger profitability and return ratios but at the cost of higher valuation multiples and mixed liquidity metrics. Generac maintains better liquidity and lower leverage with a neutral profitability profile and no dividend payout. Overall, Rockwell Automation’s ratios are slightly more favorable, while Generac’s are more neutral, reflecting differing financial strategies.
Strategic Positioning
This section compares the strategic positioning of Rockwell Automation and Generac Holdings, including market position, key segments, and exposure to technological disruption:
Rockwell Automation
- Leading industrial automation provider with global reach and strong competitive pressure in machinery sector.
- Diverse segments: Intelligent Devices, Software & Control, Lifecycle Services driving growth and innovation.
- Significant exposure to digital transformation and automation technology advances.
Generac Holdings
- Power generation equipment specialist with notable competition in residential and commercial markets.
- Focused on power generation, energy storage, outdoor power, and clean energy solutions.
- Exposure to evolving power generation and energy storage technologies, including remote monitoring.
Rockwell Automation vs Generac Holdings Positioning
Rockwell Automation maintains a diversified portfolio across automation hardware, software, and services, benefiting from broad industrial applications. Generac Holdings concentrates on power generation and related products, focusing on residential and light commercial sectors, with narrower segment diversification.
Which has the best competitive advantage?
Rockwell Automation demonstrates a very favorable moat with growing ROIC and value creation, indicating durable competitive advantage. Generac Holdings shows a very unfavorable moat with declining ROIC and value destruction, reflecting weaker competitive positioning.
Stock Comparison
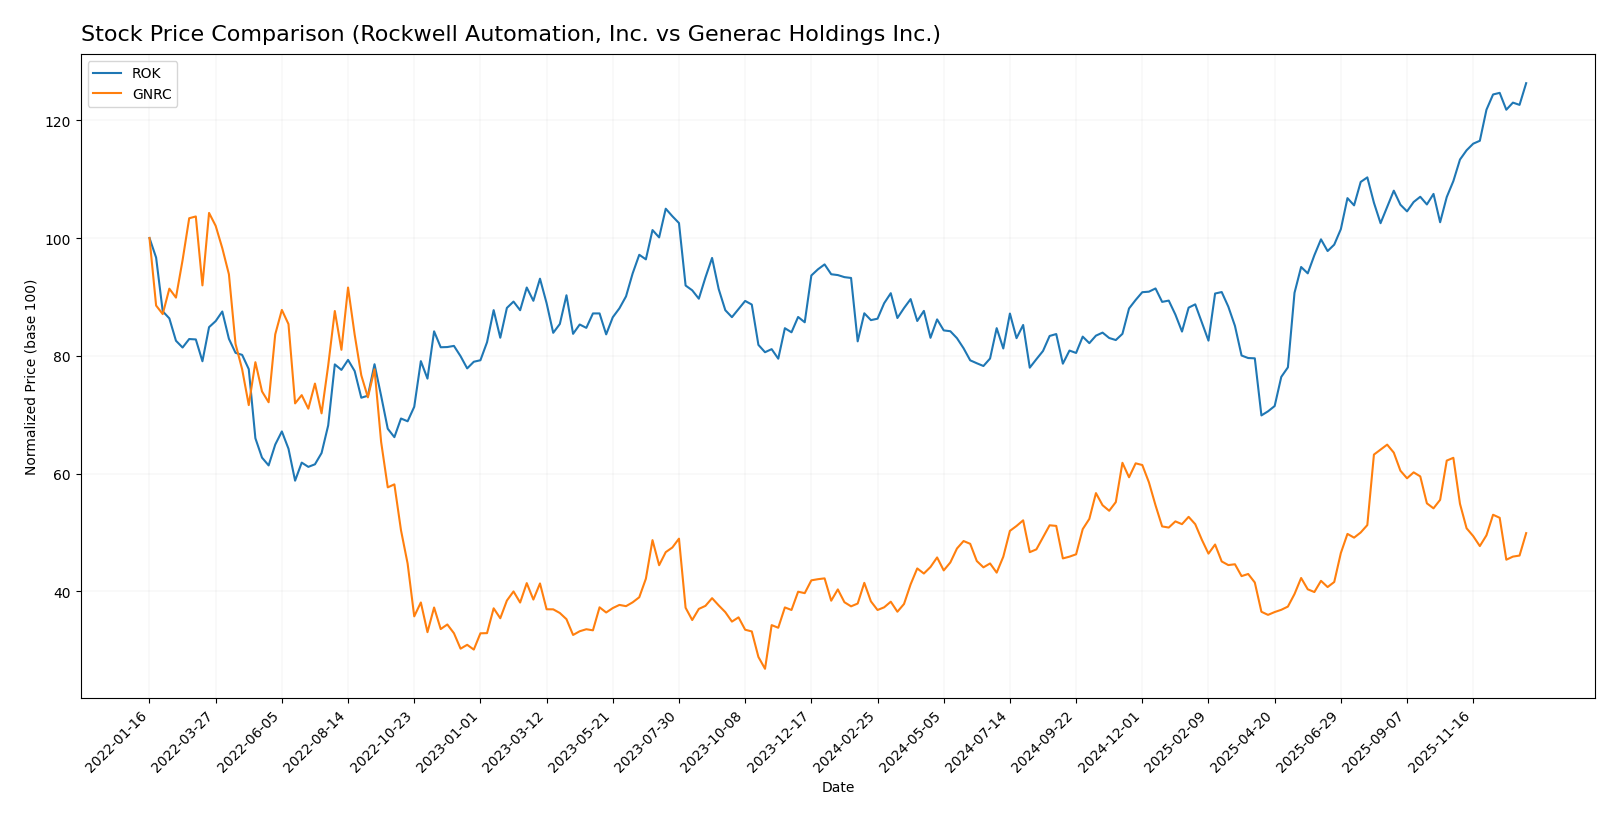
The stock price movements of Rockwell Automation, Inc. and Generac Holdings Inc. over the past year reveal divergent trading dynamics, with Rockwell showing strong gains and accelerating momentum while Generac demonstrates a slowing but still positive annual trend.
Trend Analysis
Rockwell Automation, Inc. recorded a bullish trend with a 46.76% price increase over the past 12 months, showing acceleration and high volatility with a standard deviation of 44.57. The stock ranged between 227.11 and 410.53 during this period.
Generac Holdings Inc. also posted a bullish trend with a 30.27% rise over the year but exhibited deceleration and lower volatility at 22.61 standard deviation. Prices fluctuated between 110.25 and 198.8, with a recent downward trend of -20.41%.
Comparing both stocks, Rockwell Automation delivered the highest market performance with stronger gains and accelerating momentum, while Generac showed moderate growth but recent weakness in price trend.
Target Prices
Analysts present a clear target price consensus for Rockwell Automation, Inc. and Generac Holdings Inc., reflecting optimistic outlooks.
| Company | Target High | Target Low | Consensus |
|---|---|---|---|
| Rockwell Automation, Inc. | 470 | 380 | 421.57 |
| Generac Holdings Inc. | 248 | 184 | 210 |
Rockwell Automation’s consensus target price of 421.57 USD is slightly above its current price of 410.53 USD, indicating moderate upside potential. Generac’s consensus target at 210 USD suggests considerable growth above its current 152.78 USD price, signaling stronger bullish expectations.
Analyst Opinions Comparison
This section compares analysts’ ratings and grades for Rockwell Automation, Inc. (ROK) and Generac Holdings Inc. (GNRC):
Rating Comparison
ROK Rating
- Rating: B-, considered Very Favorable by analysts.
- Discounted Cash Flow Score: 3, viewed as Moderate, indicating average valuation projections.
- ROE Score: 5, Very Favorable, reflecting high efficiency in generating shareholder returns.
- ROA Score: 4, Favorable, indicating effective asset use.
- Debt To Equity Score: 1, Very Unfavorable, indicating high financial risk due to leverage.
- Overall Score: 3, Moderate, summarizing a balanced financial standing.
GNRC Rating
- Rating: B, also rated Very Favorable, indicating a slightly stronger overall assessment.
- Discounted Cash Flow Score: 3, also Moderate, showing similar valuation expectations.
- ROE Score: 4, Favorable, showing good but lower efficiency compared to ROK.
- ROA Score: 4, Favorable, matching ROK’s asset utilization performance.
- Debt To Equity Score: 2, Moderate, showing lower leverage and reduced financial risk.
- Overall Score: 3, Moderate, reflecting a comparable overall financial health to ROK.
Which one is the best rated?
Based strictly on the provided data, GNRC holds a slightly better rating (B vs. B-) and a more favorable debt-to-equity score, indicating lower financial risk. However, ROK excels in return on equity with a higher score, suggesting stronger profitability efficiency.
Scores Comparison
Here is a comparison of the Altman Z-Score and Piotroski Score for Rockwell Automation and Generac Holdings:
ROK Scores
- Altman Z-Score: 5.32, indicating a safe zone financial status.
- Piotroski Score: 8, categorized as very strong financial health.
GNRC Scores
- Altman Z-Score: 3.73, also in the safe zone but lower.
- Piotroski Score: 7, showing strong but not very strong status.
Which company has the best scores?
Based on the provided data, Rockwell Automation has higher scores, with a stronger Altman Z-Score and a very strong Piotroski Score compared to Generac’s safe zone Altman Z-Score and strong Piotroski Score.
Grades Comparison
Here is a comparison of the recent grades assigned by reputable financial institutions for both companies:
Rockwell Automation, Inc. Grades
This table summarizes the latest grades from major financial institutions for Rockwell Automation, Inc.:
| Grading Company | Action | New Grade | Date |
|---|---|---|---|
| Wells Fargo | Maintain | Equal Weight | 2026-01-07 |
| Barclays | Maintain | Overweight | 2026-01-07 |
| Goldman Sachs | Upgrade | Neutral | 2025-12-16 |
| Jefferies | Maintain | Buy | 2025-12-10 |
| Citigroup | Maintain | Buy | 2025-12-08 |
| Barclays | Maintain | Overweight | 2025-12-04 |
| Baird | Maintain | Outperform | 2025-11-21 |
| B of A Securities | Maintain | Buy | 2025-11-20 |
| JP Morgan | Maintain | Neutral | 2025-11-11 |
| Morgan Stanley | Maintain | Overweight | 2025-11-10 |
The overall trend for Rockwell Automation shows a stable mix of “Buy,” “Overweight,” and “Neutral” ratings with some recent upgrades, indicating moderate confidence among analysts.
Generac Holdings Inc. Grades
This table summarizes the latest grades from major financial institutions for Generac Holdings Inc.:
| Grading Company | Action | New Grade | Date |
|---|---|---|---|
| Baird | Upgrade | Outperform | 2026-01-09 |
| Citigroup | Upgrade | Buy | 2026-01-08 |
| B of A Securities | Maintain | Buy | 2026-01-07 |
| Wells Fargo | Upgrade | Overweight | 2025-12-19 |
| JP Morgan | Upgrade | Overweight | 2025-12-08 |
| Citigroup | Maintain | Neutral | 2025-11-03 |
| Barclays | Maintain | Equal Weight | 2025-10-31 |
| UBS | Maintain | Buy | 2025-10-30 |
| Canaccord Genuity | Maintain | Buy | 2025-10-30 |
| Citigroup | Maintain | Neutral | 2025-10-21 |
Generac Holdings has seen several recent upgrades to “Buy,” “Overweight,” and “Outperform,” reflecting improving analyst sentiment and positive momentum.
Which company has the best grades?
Generac Holdings holds a stronger consensus with more upgrades and a buy-oriented rating mix compared to Rockwell Automation’s more balanced hold and buy ratings. This suggests Generac is currently viewed more favorably by analysts, potentially appealing to investors seeking growth opportunities with upward momentum.
Strengths and Weaknesses
The table below summarizes the key strengths and weaknesses of Rockwell Automation, Inc. (ROK) and Generac Holdings Inc. (GNRC) based on recent financial and operational data.
| Criterion | Rockwell Automation, Inc. (ROK) | Generac Holdings Inc. (GNRC) |
|---|---|---|
| Diversification | Well-diversified across Intelligent Devices, Lifecycle Services, and Software segments | Less diversified, primarily focused on power generation products |
| Profitability | High profitability with 10.42% net margin and 23.78% ROE, creating value | Moderate profitability with 7.57% net margin and 13.04% ROE, value destruction |
| Innovation | Strong innovation with growing ROIC (+77%) and solid software/control products segment | Declining ROIC (-30%) indicating challenges in innovation and value creation |
| Global presence | Established global footprint with significant revenue in multiple segments | More regional focus, less global diversification |
| Market Share | Strong market position with durable competitive advantage (very favorable moat) | Weaker market position with declining profitability and very unfavorable moat |
Key takeaways: Rockwell Automation exhibits a durable competitive advantage with strong profitability, diversification, and innovation. Generac, however, faces challenges with declining returns and less diversification, signaling higher investment risk.
Risk Analysis
Below is a comparative table summarizing key risks for Rockwell Automation, Inc. (ROK) and Generac Holdings Inc. (GNRC) based on the most recent data available in 2026:
| Metric | Rockwell Automation, Inc. (ROK) | Generac Holdings Inc. (GNRC) |
|---|---|---|
| Market Risk | Beta 1.52 indicates above-market volatility | Beta 1.83 shows higher volatility risk |
| Debt Level | Debt-to-Equity neutral at 1.0; Debt-to-Assets 32.5% | Lower debt-to-equity at 0.59; Debt-to-Assets 28.9%, favorable |
| Regulatory Risk | Moderate, industrial sector exposure to regulations | Moderate, energy equipment regulations apply |
| Operational Risk | Exposure to global supply chain disruptions | Risks from manufacturing and distribution complexity |
| Environmental Risk | Moderate, involved in eco-industrial markets | Moderate, energy products with environmental compliance needs |
| Geopolitical Risk | Medium, international operations | Medium, global supply chain exposure |
Most impactful and likely risks include market volatility, with both companies showing elevated betas, and debt-related financial risk, which is notably higher for Rockwell Automation. Rockwell’s very unfavorable debt-to-equity rating signals caution despite solid profitability, while Generac maintains a more conservative leverage profile. Operational and regulatory risks remain moderate but require monitoring given sector dynamics.
Which Stock to Choose?
Rockwell Automation, Inc. (ROK) shows a slightly favorable financial ratio profile with strong profitability metrics including a 23.78% ROE and a 13.71% ROIC. Despite a moderate debt level and some unfavorable valuation ratios, its income statement reveals mixed growth with declining net margin and EPS over the longer term. The company holds a very favorable rating (B-) and demonstrates a very favorable moat with growing ROIC above WACC, indicating durable competitive advantage.
Generac Holdings Inc. (GNRC) presents a neutral financial ratio profile with moderate profitability—13.04% ROE and 9.89% ROIC—and a stronger current ratio and lower debt-to-assets. Its income statement shows favorable recent growth in EBIT and net margin but overall mixed performance. The company carries a very favorable rating (B) but a very unfavorable moat due to declining ROIC below WACC, suggesting value erosion and decreasing profitability.
Considering ratings and overall financial evaluations, investors focused on stability and quality might find Rockwell Automation’s strong moat and profitability attractive, while those oriented toward recent growth trends could see Generac’s improving income statement as a potential opportunity. The choice could depend on whether an investor prioritizes durable competitive advantage or near-term earnings momentum.
Disclaimer: Investment carries a risk of loss of initial capital. The past performance is not a reliable indicator of future results. Be sure to understand risks before making an investment decision.
Go Further
I encourage you to read the complete analyses of Rockwell Automation, Inc. and Generac Holdings Inc. to enhance your investment decisions: