Home > Comparison > Industrials > GNRC vs PSN
The strategic rivalry between Generac Holdings Inc. and Parsons Corporation shapes the industrial machinery sector’s evolution. Generac, a product-focused manufacturer of power generation and energy storage systems, contrasts with Parsons, a service-driven provider of defense and critical infrastructure solutions. This analysis explores their divergent operational models and competitive positioning. I aim to identify which company delivers superior risk-adjusted returns for a diversified portfolio amid shifting industry dynamics.

Table of contents
Companies Overview
Generac Holdings Inc. and Parsons Corporation both wield significant influence in the industrial machinery sector, shaping critical infrastructure and power solutions globally.
Generac Holdings Inc.: Power Generation Pioneer
Generac dominates the power generation equipment market, focusing on residential, commercial, and industrial sectors. It generates revenue primarily through sales of standby generators, portable generators, and clean energy systems. In 2026, its strategic emphasis lies on expanding energy storage and smart monitoring technologies to capitalize on rising demand for reliable, sustainable power.
Parsons Corporation: Infrastructure and Defense Specialist
Parsons leads in integrated solutions for defense and critical infrastructure, delivering cybersecurity, space, and geospatial services chiefly to government clients. Its revenue streams stem from federal contracts and infrastructure project management. The company’s 2026 strategy centers on enhancing cyber defense capabilities and expanding intelligent transportation systems amid growing infrastructure modernization needs.
Strategic Collision: Similarities & Divergences
Both companies operate in industrial machinery but differ sharply in focus: Generac pursues a product-centric approach targeting energy reliability, while Parsons adopts a service-driven model emphasizing government contracts and infrastructure tech. Their primary battleground is critical infrastructure resilience, where Generac’s hardware solutions meet Parsons’ integrated system services. Investors face distinct profiles—Generac offers exposure to energy innovation, Parsons to defense and infrastructure modernization.
Income Statement Comparison
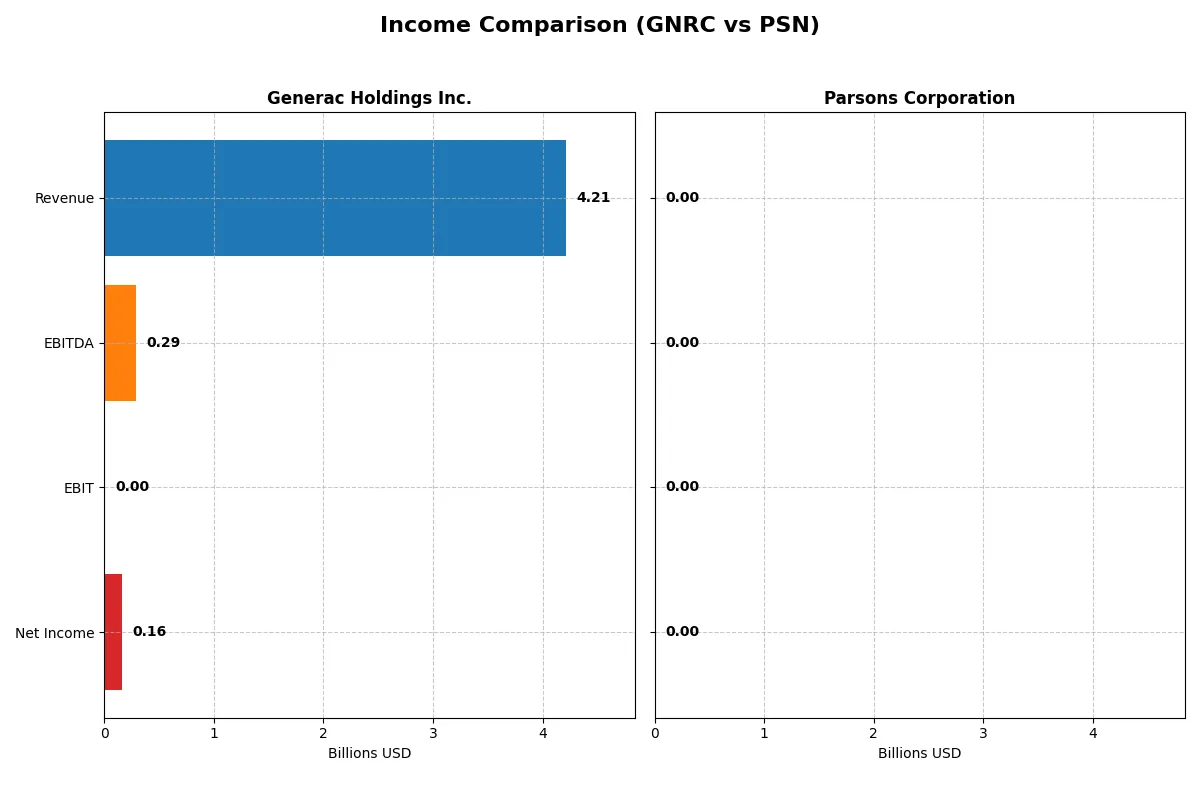
This data dissects the core profitability and scalability of both corporate engines to reveal who dominates the bottom line:
| Metric | Generac Holdings Inc. (GNRC) | Parsons Corporation (PSN) |
|---|---|---|
| Revenue | 4.21B | 100K |
| Cost of Revenue | 2.60B | 0 |
| Operating Expenses | 1.32B | 16K |
| Gross Profit | 1.61B | 0 |
| EBITDA | 289M | 6.6K |
| EBIT | 0 | 0 |
| Interest Expense | -71M | -800 |
| Net Income | 160M | 3.8K |
| EPS | 2.73 | 0 |
| Fiscal Year | 2025 | 2025 |
Income Statement Analysis: The Bottom-Line Duel
This income statement comparison reveals how efficiently each company converts revenue into profit amidst recent market challenges and operational shifts.
Generac Holdings Inc. Analysis
Generac’s revenue shows a slight decline to 4.21B in 2025 from 4.30B in 2024, reflecting a -2% annual drop. Gross margins remain healthy at 38.3%, but net income plunged 51% to 160M, signaling margin compression and lower profitability. The company’s operating income collapsed to 289M from 537M, indicating deteriorating operational efficiency.
Parsons Corporation Analysis
Parsons faces a dramatic revenue collapse to $100K in 2025 from 6.75B in 2024, a near-total drop. Gross profit and operating income similarly vanished, though net margin holds steady near 3.8%, partly due to low expenses. This collapse suggests either a reporting anomaly or a major operational disruption, causing severe top-line and bottom-line contraction.
Steady Decline vs. Abrupt Collapse
Generac manages a moderate revenue decrease but suffers sharp profit margin erosion, reflecting operational headwinds. Parsons shows catastrophic revenue and profit losses in 2025, undermining its income statement health. Generac’s profile, despite setbacks, remains more consistent, while Parsons’ drastic fall raises substantial red flags for investors seeking stability.
Financial Ratios Comparison
These vital ratios act as a diagnostic tool to expose the underlying fiscal health, valuation premiums, and capital efficiency of the companies analyzed:
| Ratios | Generac Holdings Inc. (GNRC) | Parsons Corporation (PSN) |
|---|---|---|
| ROE | 13.0% | 0.0001% |
| ROIC | 9.9% | 0.00015% |
| P/E | 28.4 | 0 (no reported earnings) |
| P/B | 3.70 | 0 (no data) |
| Current Ratio | 1.97 | 1.75 |
| Quick Ratio | 0.97 | 1.75 |
| D/E (Debt-to-Equity) | 0.59 | 0.52 |
| Debt-to-Assets | 28.9% | 23.9% |
| Interest Coverage | 5.98 | -8.25 (negative, red flag) |
| Asset Turnover | 0 (no data) | 0 (no meaningful data) |
| Fixed Asset Turnover | 0 (no data) | 0 (no meaningful data) |
| Payout ratio | 0.08% | 0% |
| Dividend yield | 0.004% | 0% |
| Fiscal Year | 2025 | 2025 |
Efficiency & Valuation Duel: The Vital Signs
Ratios act as a company’s DNA, exposing hidden risks and operational excellence that raw numbers alone cannot reveal.
Generac Holdings Inc.
Generac shows weak profitability with a net margin of 3.79% and ROE at 0%, signaling poor core earnings efficiency. Its P/E ratio of 50.02 marks the stock as expensive and stretched. The company pays no dividend, focusing instead on reinvestment in R&D, which accounts for about 5% of revenue.
Parsons Corporation
Parsons posts a similar net margin near 3.8%, with ROE also at 0%, reflecting limited profitability. However, its valuation metrics appear more balanced, supported by a favorable WACC of 2.19% and current ratio of 1.75. It offers no dividend, likely prioritizing working capital and debt management.
Premium Valuation vs. Operational Safety
Generac’s expensive valuation contrasts with Parsons’ more conservative financial structure and liquidity. Parsons presents a better balance of risk and reward through healthier solvency ratios. Investors seeking operational safety may prefer Parsons, while those tolerating valuation risk might consider Generac’s growth focus.
Which one offers the Superior Shareholder Reward?
I see Generac Holdings Inc. (GNRC) delivers minimal dividend yield at 0.0037%, with a tiny payout ratio near 0.18%. Its focus lies in steady free cash flow generation of $7.5/share and moderate buybacks, supporting sustainable shareholder returns. Parsons Corporation (PSN) pays no dividends but aggressively reinvests in growth, with no buyback activity reported. GNRC’s balanced distribution between modest dividends and share repurchases offers a more tangible, sustainable total return. I conclude GNRC provides the superior shareholder reward for 2026 investors seeking a blend of income and capital appreciation.
Comparative Score Analysis: The Strategic Profile
The radar chart reveals the fundamental DNA and trade-offs of Generac Holdings Inc. and Parsons Corporation, highlighting their financial strengths and vulnerabilities:
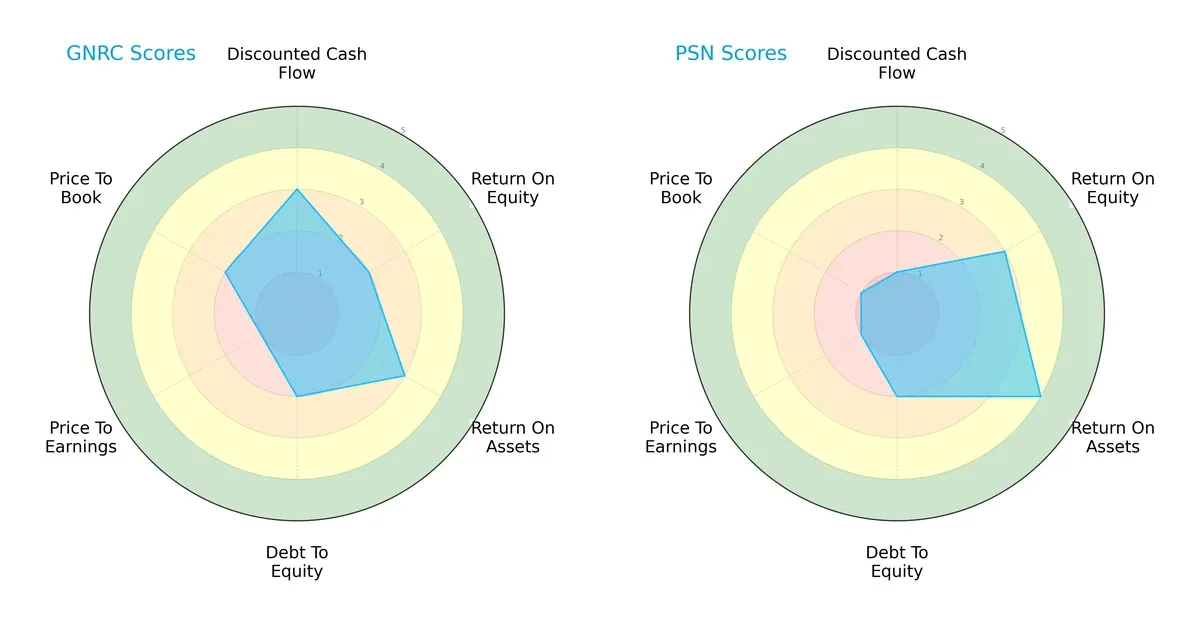
Generac demonstrates moderate discounted cash flow and return on assets but struggles with return on equity and valuation metrics. Parsons excels in asset utilization and equity returns but scores very low on DCF and valuation. Parsons shows a more balanced operational efficiency, while Generac relies on moderate cash flow projections amid valuation challenges.
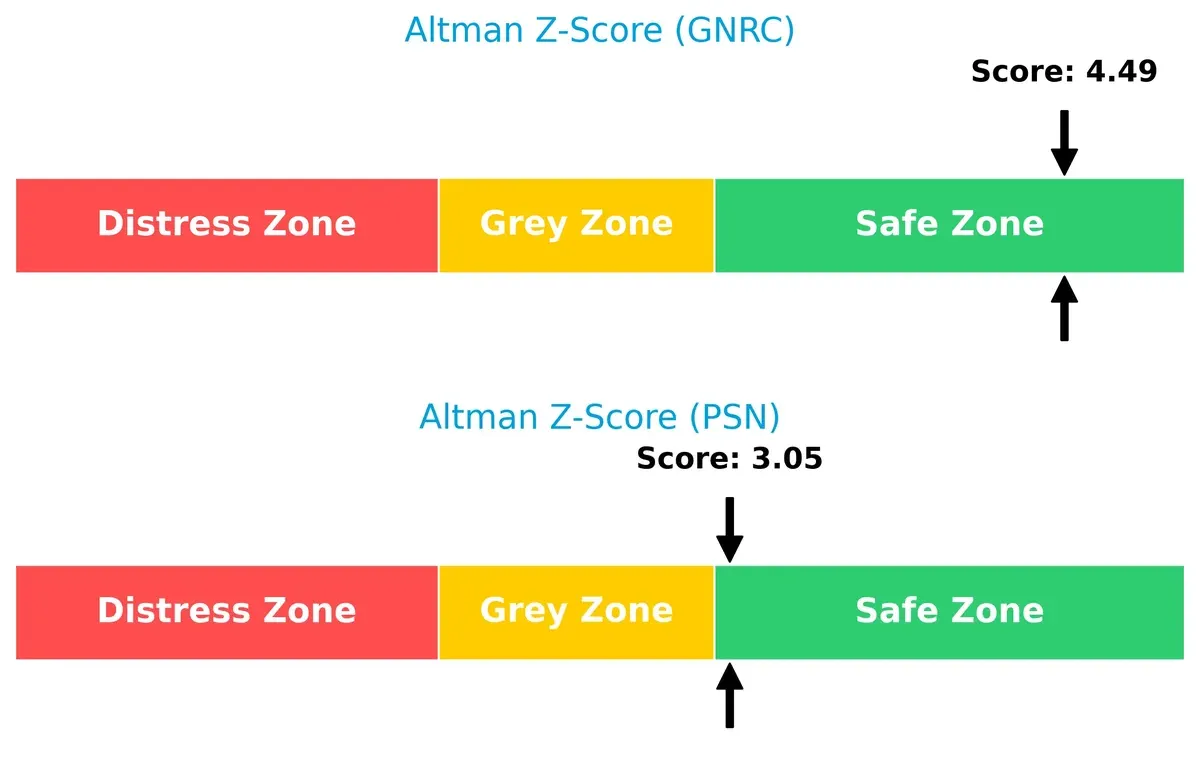
Bankruptcy Risk: Solvency Showdown
Generac’s Altman Z-Score of 4.49 versus Parsons’ 3.05 places both firms safely above distress thresholds, but Generac enjoys a wider margin, signaling stronger long-term solvency in this cycle:
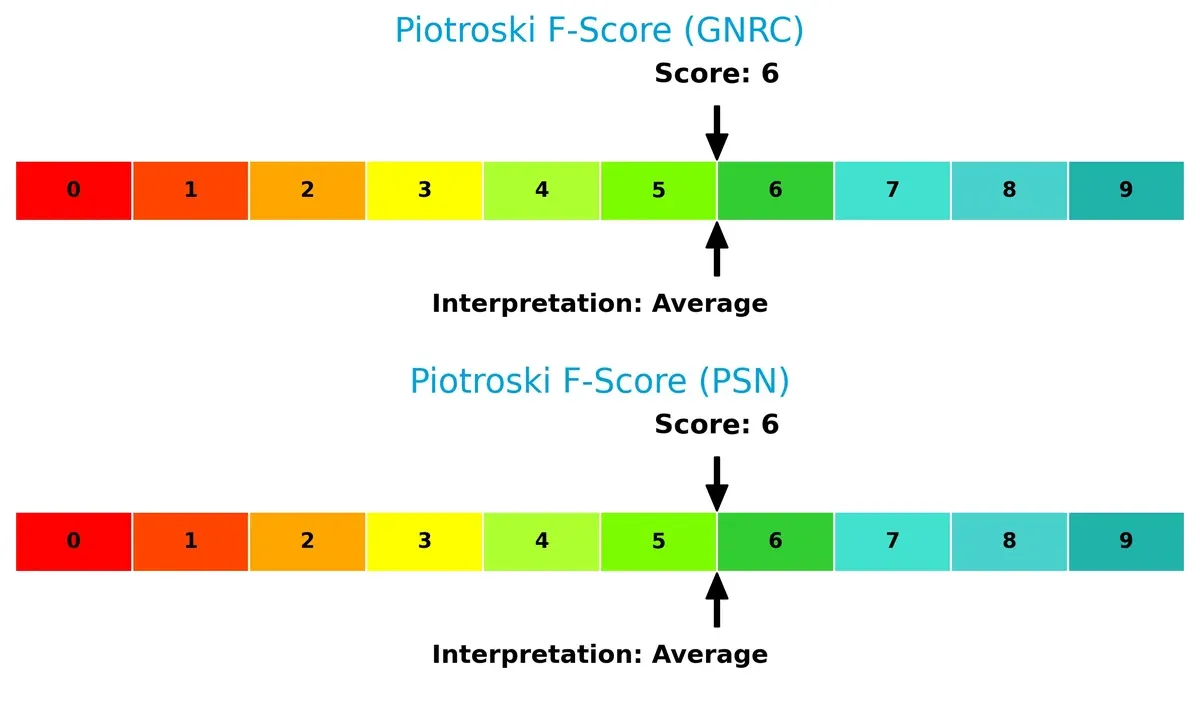
Financial Health: Quality of Operations
Both companies share an average Piotroski F-Score of 6, indicating stable financial health with no immediate red flags. Neither firm shows peak financial robustness, suggesting room for operational improvement:
How are the two companies positioned?
This section dissects the operational DNA of GNRC and PSN by comparing their revenue distribution and internal dynamics. The goal is to confront their economic moats and identify which business model offers the most resilient competitive advantage today.
Revenue Segmentation: The Strategic Mix
This visual comparison dissects how Generac Holdings Inc. and Parsons Corporation diversify income streams and where their primary sector bets lie:
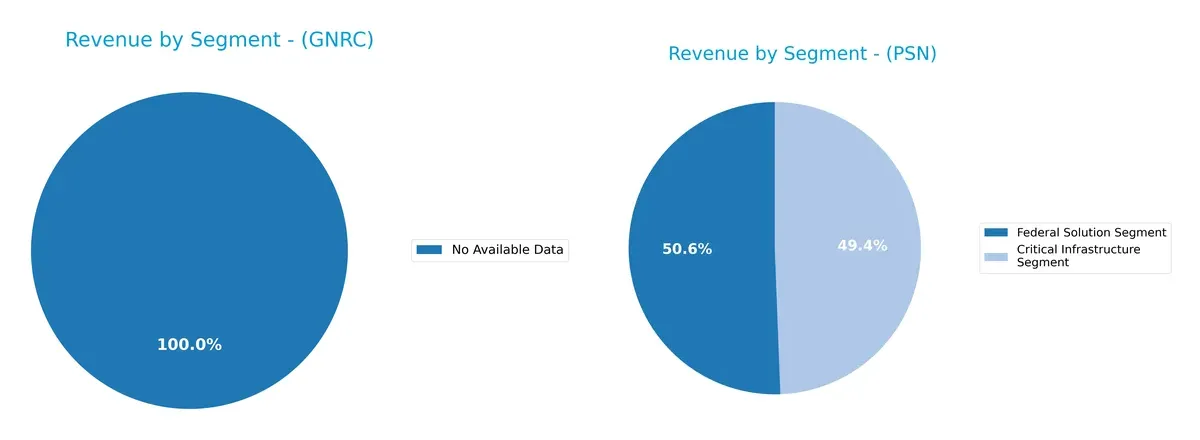
Parsons leans on two robust segments: Federal Solutions at $3.2B and Critical Infrastructure near $3.1B in 2025, revealing a balanced portfolio. Generac’s segmentation data is unavailable, forcing caution. Parsons’ dual-segment approach mitigates concentration risk and anchors its government and infrastructure foothold. This mix contrasts with a typical single-segment reliance, suggesting Parsons pivots on ecosystem lock-in and infrastructure dominance for steady growth.
Strengths and Weaknesses Comparison
This table compares the Strengths and Weaknesses of Generac Holdings Inc. and Parsons Corporation:
Generac Holdings Inc. Strengths
- Favorable debt-to-equity and debt-to-assets ratios indicate conservative leverage
- Favorable price-to-book ratio signals market confidence in asset value
Parsons Corporation Strengths
- Favorable current and quick ratios reflect solid liquidity
- Favorable weighted average cost of capital (WACC) at 2.19%
- Diversified revenue streams across Federal and Critical Infrastructure segments
- Strong global presence with significant North America and Middle East sales
Generac Holdings Inc. Weaknesses
- Unfavorable net margin, ROE, and ROIC highlight profitability and capital efficiency challenges
- Zero or unavailable liquidity ratios pose financial risk
- High price-to-earnings ratio suggests overvaluation
- Negative interest coverage signals financial strain
Parsons Corporation Weaknesses
- Unfavorable net margin, ROE, and ROIC reflect profitability pressures
- Negative interest coverage ratio indicates debt servicing challenges
- Zero dividend yield may deter income-focused investors
- Asset turnover ratios are unfavorable, limiting operational efficiency
Both companies face significant profitability and efficiency headwinds, but Parsons exhibits stronger liquidity and capital structure metrics. Generac’s weak liquidity and valuation metrics could constrain strategic flexibility. Parsons’ diversified segments and global footprint provide a more balanced foundation for growth despite profitability challenges.
The Moat Duel: Analyzing Competitive Defensibility
A structural moat is the sole shield protecting long-term profits from relentless competition’s erosion:
Generac Holdings Inc.: Cost Advantage Powerhouse
Generac leverages cost advantage by integrating efficient manufacturing with branded power solutions, reflected in stable gross margins near 38%. However, declining EBIT and net margin growth in 2025 spotlight margin pressure. New energy storage systems could deepen its moat if execution improves.
Parsons Corporation: Specialized Federal Solutions Moat
Parsons’ moat hinges on high barriers in defense and critical infrastructure contracts, contrasting Generac’s manufacturing edge. Despite shrinking revenues and very unfavorable ROIC trends, Parsons’ expanding Middle East footprint offers a growth avenue to stabilize margins and reinforce its niche.
Verdict: Cost Efficiency vs. Contractual Barriers
Generac’s cost advantage delivers stronger margin stability despite recent setbacks. Parsons faces sharper profitability erosion despite its specialized contracts. Generac currently holds the wider moat, better positioned to defend market share amid competitive headwinds.
Which stock offers better returns?
Over the past 12 months, Generac Holdings Inc. saw a strong upward price movement with accelerating gains, while Parsons Corporation experienced a steady decline, reflecting contrasting trading dynamics.
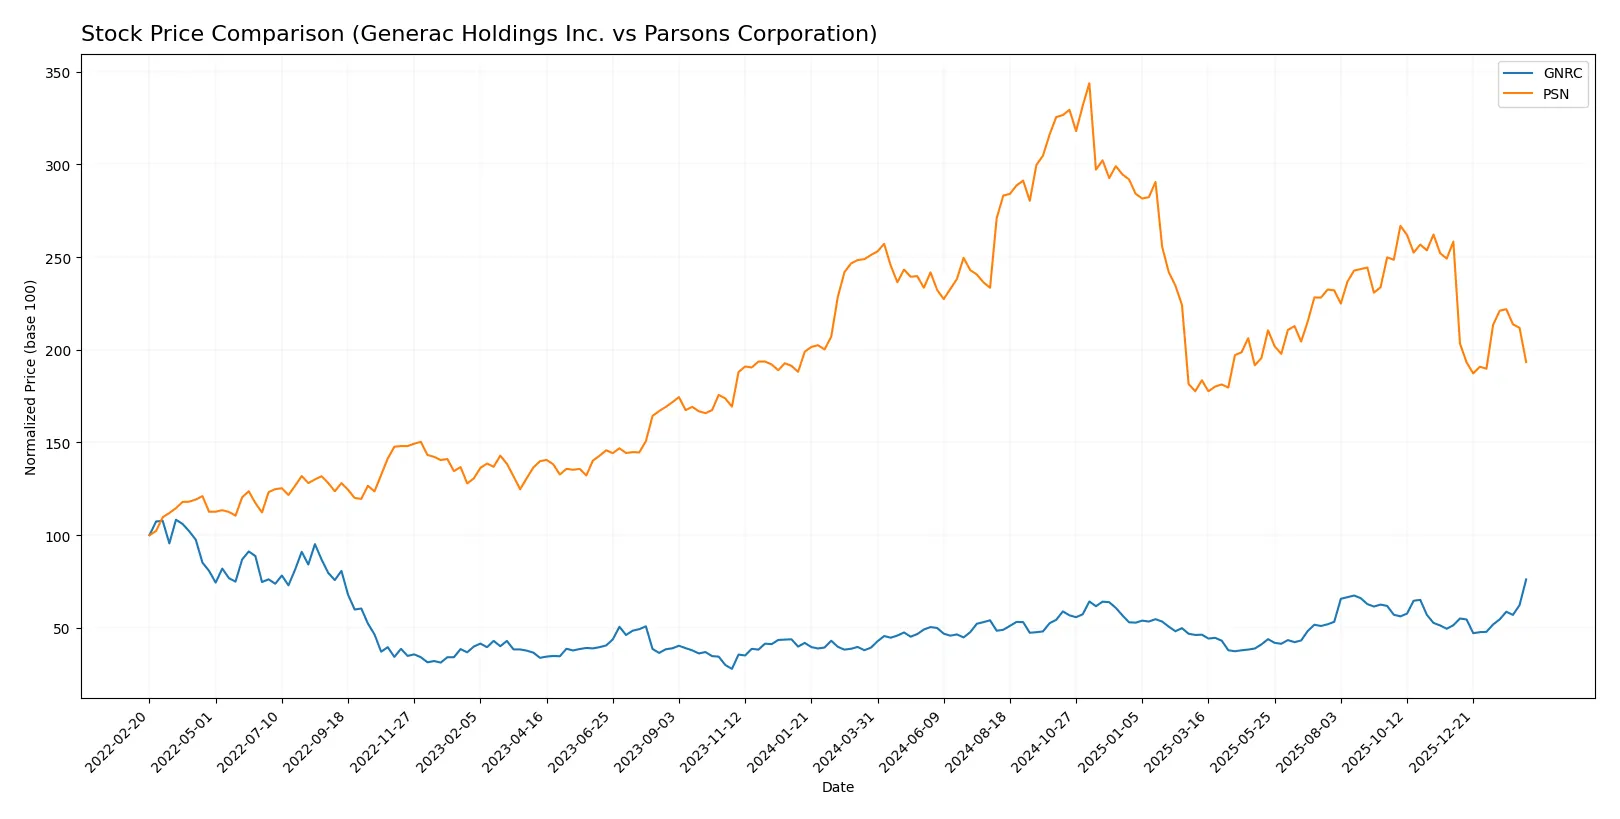
Trend Comparison
Generac Holdings Inc. shows a bullish trend with a 93.64% price increase over the past year, marked by acceleration and a high volatility of 22.77% standard deviation. The stock peaked at 224.45 and bottomed at 110.25.
Parsons Corporation exhibits a bearish trend, dropping 23.0% over the same period with deceleration and lower volatility at 13.2%. Its highest price was 112.69 and lowest 58.22.
Comparing both, Generac delivered substantially higher market performance, outperforming Parsons by a wide margin in price appreciation and momentum.
Target Prices
Analysts present a mixed but generally bullish consensus for these industrial machinery stocks.
| Company | Target Low | Target High | Consensus |
|---|---|---|---|
| Generac Holdings Inc. | 195 | 292 | 239 |
| Parsons Corporation | 78 | 104 | 87 |
Generac’s target consensus of $239 suggests upside potential versus its $224 current price. Parsons shows a wider margin, with a $87 consensus well above its $63 price.

Don’t Let Luck Decide Your Entry Point
Optimize your entry points with our advanced ProRealTime indicators. You’ll get efficient buy signals with precise price targets for maximum performance. Start outperforming now!
How do institutions grade them?
Here is a comparison of recent institutional grades for Generac Holdings Inc. and Parsons Corporation:
Generac Holdings Inc. Grades
The following table summarizes recent grades assigned by major grading companies for Generac Holdings Inc.:
| Grading Company | Action | New Grade | Date |
|---|---|---|---|
| Barclays | Maintain | Equal Weight | 2026-02-13 |
| Wells Fargo | Maintain | Overweight | 2026-02-12 |
| Guggenheim | Downgrade | Neutral | 2026-02-12 |
| Guggenheim | Maintain | Buy | 2026-02-10 |
| Barclays | Maintain | Equal Weight | 2026-01-20 |
| Canaccord Genuity | Maintain | Buy | 2026-01-13 |
| Baird | Upgrade | Outperform | 2026-01-09 |
| Citigroup | Upgrade | Buy | 2026-01-08 |
| B of A Securities | Maintain | Buy | 2026-01-07 |
| Wells Fargo | Upgrade | Overweight | 2025-12-19 |
Parsons Corporation Grades
Below is a summary of the latest grades provided by recognized grading firms for Parsons Corporation:
| Grading Company | Action | New Grade | Date |
|---|---|---|---|
| UBS | Maintain | Buy | 2026-02-12 |
| Truist Securities | Maintain | Buy | 2026-02-12 |
| Keybanc | Maintain | Overweight | 2026-02-12 |
| Barclays | Maintain | Overweight | 2026-01-23 |
| Keybanc | Maintain | Overweight | 2026-01-20 |
| UBS | Maintain | Buy | 2026-01-15 |
| Citigroup | Maintain | Buy | 2026-01-13 |
| B of A Securities | Maintain | Buy | 2025-12-30 |
| Stifel | Maintain | Buy | 2025-12-23 |
| Jefferies | Maintain | Hold | 2025-12-11 |
Which company has the best grades?
Parsons Corporation consistently receives Buy and Overweight ratings, indicating stronger institutional conviction. Generac shows a wider range from Neutral to Outperform, reflecting more varied analyst views. Investors may interpret Parsons’ steadier high grades as a signal of greater confidence among analysts.
Risks specific to each company
The following categories identify the critical pressure points and systemic threats facing both firms in the 2026 market environment:
1. Market & Competition
Generac Holdings Inc.
- Faces intense competition in power generation and energy storage markets, with margin pressures.
Parsons Corporation
- Competes in defense and infrastructure sectors, exposed to government budget cycles and contract renewals.
2. Capital Structure & Debt
Generac Holdings Inc.
- Exhibits favorable debt-to-equity ratios but poor interest coverage, signaling liquidity strain.
Parsons Corporation
- Shows moderate leverage with solid current and quick ratios, indicating better short-term financial stability.
3. Stock Volatility
Generac Holdings Inc.
- High beta of 1.81 implies significant stock price volatility and sensitivity to market swings.
Parsons Corporation
- Lower beta at 0.67 suggests more stable stock behavior versus market fluctuations.
4. Regulatory & Legal
Generac Holdings Inc.
- Subject to industrial machinery regulations and evolving energy policies impacting product lines.
Parsons Corporation
- Faces complex regulatory environments across defense and critical infrastructure, with potential legal contract risks.
5. Supply Chain & Operations
Generac Holdings Inc.
- Depends on diversified component suppliers; supply disruptions could affect manufacturing and delivery.
Parsons Corporation
- Operates globally with complex project management; supply chain delays or cost overruns can impact margins.
6. ESG & Climate Transition
Generac Holdings Inc.
- Transitioning to clean energy products but must manage environmental compliance risks.
Parsons Corporation
- Increasing focus on sustainable infrastructure projects; ESG compliance critical for securing government contracts.
7. Geopolitical Exposure
Generac Holdings Inc.
- Primarily US-focused with limited international risk but vulnerable to domestic policy shifts.
Parsons Corporation
- Broad international footprint, including Middle East exposure, raising geopolitical and operational risks.
Which company shows a better risk-adjusted profile?
Parsons Corporation’s moderate leverage, stronger liquidity ratios, and lower stock volatility offer a more balanced risk profile. Generac’s high beta and poor liquidity metrics raise caution. Parsons benefits from diversification across stable government contracts, while Generac’s competitive pressures and weak profitability metrics amplify risks. Notably, Generac’s negative interest coverage and unfavorable valuation multiples highlight financial stress, whereas Parsons maintains a safer Altman Z-Score zone and average Piotroski Score, signaling better operational resilience.
Final Verdict: Which stock to choose?
Generac Holdings Inc. wields a potent cash flow engine, driving operational resilience despite recent margin pressures. Its main point of vigilance is the declining return on invested capital, signaling caution on capital efficiency. This stock suits investors chasing aggressive growth with a tolerance for volatility and turnaround potential.
Parsons Corporation’s strategic moat lies in its stable contract backlog and operational cash flow, offering a more consistent safety profile than Generac. While growth has stalled, its balance sheet strength and steady working capital make it appealing for those favoring GARP—growth at a reasonable price—within a risk-conscious portfolio.
If you prioritize dynamic growth and can tolerate near-term profitability challenges, Generac outshines with its cash generation and market momentum. However, if you seek better stability and capital preservation, Parsons offers a safer harbor amid uncertain industry returns. Both present analytical scenarios worthy of consideration depending on your risk appetite and investment horizon.
Disclaimer: Investment carries a risk of loss of initial capital. The past performance is not a reliable indicator of future results. Be sure to understand risks before making an investment decision.
Go Further
I encourage you to read the complete analyses of Generac Holdings Inc. and Parsons Corporation to enhance your investment decisions: