Home > Comparison > Industrials > PH vs GNRC
The strategic rivalry between Parker-Hannifin Corporation and Generac Holdings Inc. shapes the trajectory of the industrial machinery sector. Parker-Hannifin, a diversified industrial and aerospace systems powerhouse, contrasts sharply with Generac’s focused power generation and energy solutions model. This analysis examines their differing capital intensities and growth prospects. Ultimately, I will determine which company’s strategy presents a superior risk-adjusted opportunity for a well-rounded investment portfolio.
Table of contents
Companies Overview
Parker-Hannifin and Generac hold pivotal roles in industrial machinery, shaping diverse sectors with distinct market approaches.
Parker-Hannifin Corporation: Industrial Motion and Control Leader
Parker-Hannifin dominates the motion and control technologies market, generating revenue through diversified industrial and aerospace segments. Its product range spans hydraulic, pneumatic, and electromechanical systems tailored for OEMs and distributors. In 2026, it strategically focuses on advancing precision control and sealing solutions for mobile, industrial, and aerospace applications, reinforcing its broad industrial footprint.
Generac Holdings Inc.: Power Generation and Energy Solutions Specialist
Generac leads in power generation equipment for residential, commercial, and industrial markets. Its revenue stems from manufacturing generators, energy storage, and outdoor power equipment. The 2026 strategy emphasizes expanding clean energy solutions and remote monitoring technologies, aiming to strengthen its position in backup power and mobile energy systems in a rapidly evolving energy landscape.
Strategic Collision: Similarities & Divergences
Both companies target industrial markets but differ fundamentally: Parker-Hannifin excels in complex motion control systems with a broad OEM base, while Generac focuses on power generation and energy storage with direct consumer and commercial channels. Their primary battleground is industrial reliability and innovation. Parker-Hannifin offers a diversified, enterprise-grade investment profile; Generac presents a growth-oriented yet more volatile proposition tied to energy trends.
Income Statement Comparison
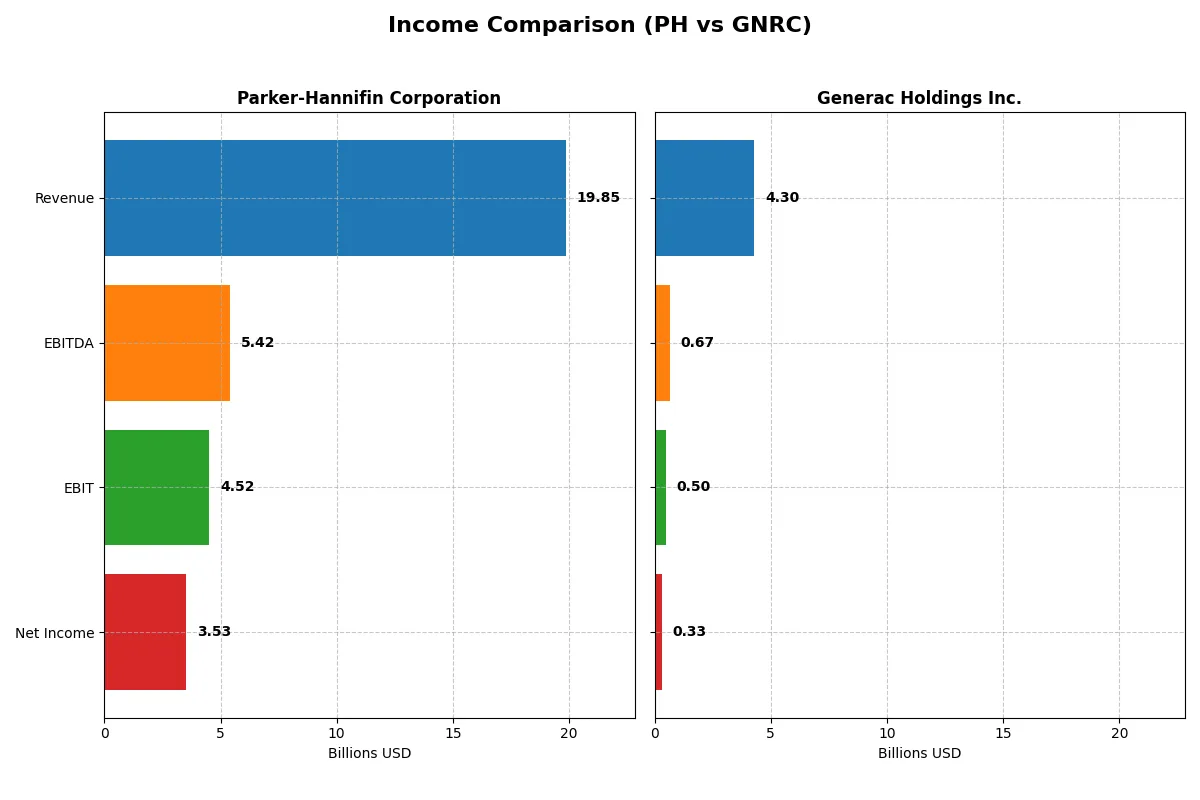
This data dissects the core profitability and scalability of both corporate engines to reveal who dominates the bottom line:
| Metric | Parker-Hannifin Corporation (PH) | Generac Holdings Inc. (GNRC) |
|---|---|---|
| Revenue | 19.85B | 4.30B |
| Cost of Revenue | 12.54B | 2.63B |
| Operating Expenses | 3.26B | 1.13B |
| Gross Profit | 7.32B | 1.67B |
| EBITDA | 5.42B | 671M |
| EBIT | 4.52B | 499M |
| Interest Expense | 409M | 90M |
| Net Income | 3.53B | 325M |
| EPS | 27.52 | 5.46 |
| Fiscal Year | 2025 | 2024 |
Income Statement Analysis: The Bottom-Line Duel
This income statement comparison reveals which company operates with superior efficiency and delivers stronger profitability under current market conditions.
Parker-Hannifin Corporation Analysis
Parker-Hannifin’s revenue edged slightly down by 0.4% in 2025 to $19.85B, yet net income surged 24.6% to $3.53B. Its gross margin remains solid at 36.85%, while net margin expanded impressively to 17.79%. The company demonstrates robust operating leverage, boosting EBIT by 10.1%, signaling strong momentum despite flat top-line growth.
Generac Holdings Inc. Analysis
Generac grew revenue 6.8% to $4.30B in 2024, with net income climbing 60% to $325M from the prior year. Its gross margin of 38.77% outperforms Parker-Hannifin, but net margin lags at 7.57%. EBIT jumped 28.7%, aided by accelerating sales, albeit with higher operating expenses diluting margin gains. The firm shows rapid growth but weaker bottom-line efficiency.
Margin Strength vs. Growth Momentum
Parker-Hannifin delivers superior profitability and margin expansion, doubling net income over five years despite stagnant revenue. Generac impresses with faster revenue and EBIT growth but suffers shrinking net margins and negative net income growth over the longer term. For investors prioritizing durable earnings quality, Parker-Hannifin’s profile offers a stronger, more consistent fundamental foundation.
Financial Ratios Comparison
These vital ratios act as a diagnostic tool to expose the underlying fiscal health, valuation premiums, and capital efficiency of the companies compared:
| Ratios | Parker-Hannifin Corporation (PH) | Generac Holdings Inc. (GNRC) |
|---|---|---|
| ROE | 25.8% | 13.0% |
| ROIC | 13.7% | 9.9% |
| P/E | 25.4 | 28.4 |
| P/B | 6.55 | 3.70 |
| Current Ratio | 1.19 | 1.97 |
| Quick Ratio | 0.71 | 0.97 |
| D/E | 0.69 | 0.59 |
| Debt-to-Assets | 32.2% | 28.9% |
| Interest Coverage | 9.93 | 5.98 |
| Asset Turnover | 0.67 | 0.84 |
| Fixed Asset Turnover | 6.76 | 5.01 |
| Payout ratio | 24.4% | 0.08% |
| Dividend yield | 0.96% | 0.003% |
| Fiscal Year | 2025 | 2024 |
Efficiency & Valuation Duel: The Vital Signs
Ratios serve as a company’s financial DNA, uncovering hidden operational strengths and risks investors must weigh carefully.
Parker-Hannifin Corporation
Parker-Hannifin posts strong profitability with a 25.8% ROE and a 17.8% net margin, signaling operational efficiency. However, its valuation appears stretched at a 25.4 P/E and 6.55 P/B, above typical sector averages. The company delivers modest dividends (0.96% yield), indicating a cautious shareholder return focus amid solid reinvestment and stable interest coverage.
Generac Holdings Inc.
Generac shows moderate profitability with a 13.0% ROE and 7.6% net margin, reflecting neutral efficiency. Its valuation is high, marked by a 28.4 P/E and 3.7 P/B, suggesting price premium risks. Generac pays no dividend, reinvesting heavily into growth and R&D. Its strong current ratio and interest coverage provide some financial stability despite neutral returns.
Premium Valuation vs. Operational Safety
Parker-Hannifin offers superior profitability but trades at a premium, raising valuation risk. Generac’s growth focus and conservative balance sheet yield lower returns but better liquidity. Investors seeking operational strength may prefer Parker-Hannifin; those favoring financial stability and reinvestment should consider Generac’s profile.
Which one offers the Superior Shareholder Reward?
I compare Parker-Hannifin (PH) and Generac Holdings (GNRC) on dividends and buybacks. PH yields ~1%, with a 24% payout ratio, well-covered by FCF at 88%. PH maintains steady dividends and a strong buyback program, supporting shareholder value. GNRC barely pays dividends, focusing on reinvesting in growth and acquisitions, with no significant buybacks. PH’s sustainable distributions and shareholder returns outperform GNRC’s reinvestment, which carries higher execution risk. In 2026, PH offers a more attractive total return profile due to reliable income and capital return strategies.
Comparative Score Analysis: The Strategic Profile
The radar chart reveals the fundamental DNA and trade-offs of Parker-Hannifin and Generac Holdings, highlighting their core financial strengths and vulnerabilities:
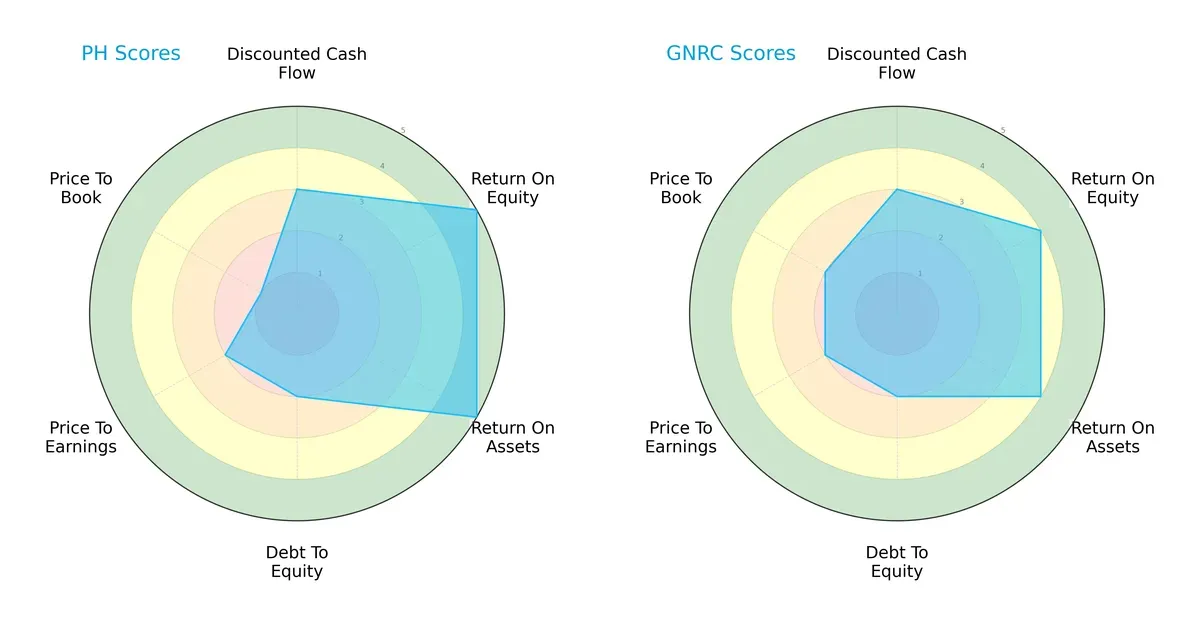
Parker-Hannifin dominates with superior ROE and ROA scores (5 vs. 4), signaling more efficient profit generation and asset utilization. Both match evenly on DCF and Debt/Equity (3 and 2, respectively), indicating similar valuation discipline and moderate leverage. Generac shows a slight edge in price-to-book, suggesting better relative valuation. Parker-Hannifin presents a more unbalanced profile, relying heavily on operational efficiency, while Generac maintains a more balanced but less potent overall footprint.
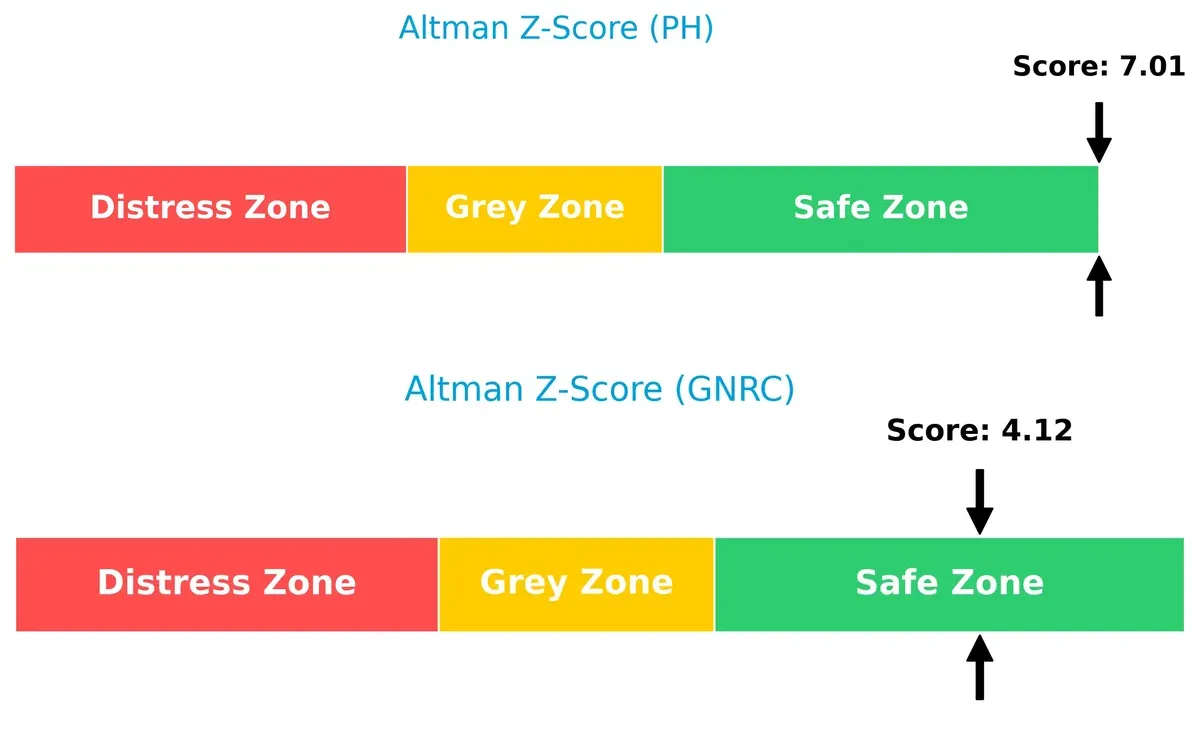
Bankruptcy Risk: Solvency Showdown
Parker-Hannifin’s Altman Z-Score of 7.0 vs. Generac’s 4.1 places both firmly in the safe zone, but PH’s higher score signals stronger resilience to economic downturns and financial distress:
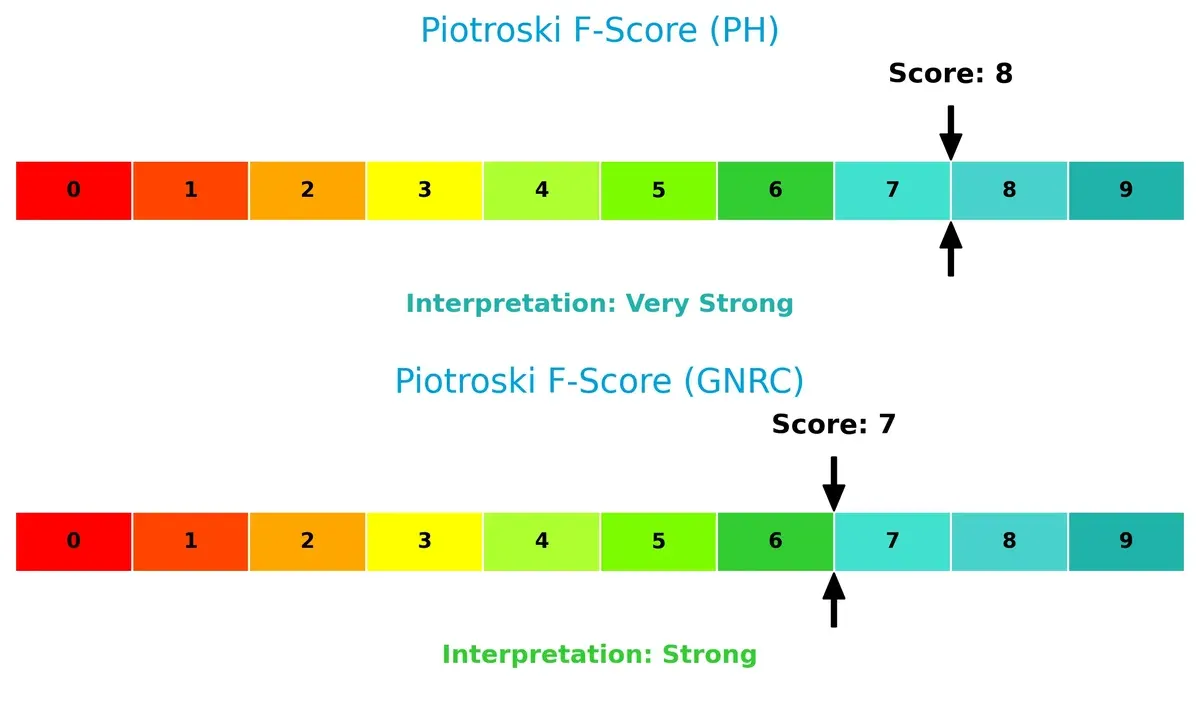
Financial Health: Quality of Operations
Parker-Hannifin scores an 8 on the Piotroski F-Score, edging out Generac’s 7. This indicates PH’s superior internal financial health and operational quality, with no red flags detected compared to GNRC’s slightly weaker profile:
How are the two companies positioned?
This section dissects PH and GNRC’s operational DNA by comparing their revenue distribution and internal strengths and weaknesses. The goal is to confront their economic moats to identify which model offers the most resilient competitive advantage today.
Revenue Segmentation: The Strategic Mix
The following visual comparison dissects how Parker-Hannifin Corporation and Generac Holdings Inc. diversify their income streams and where their primary sector bets lie:
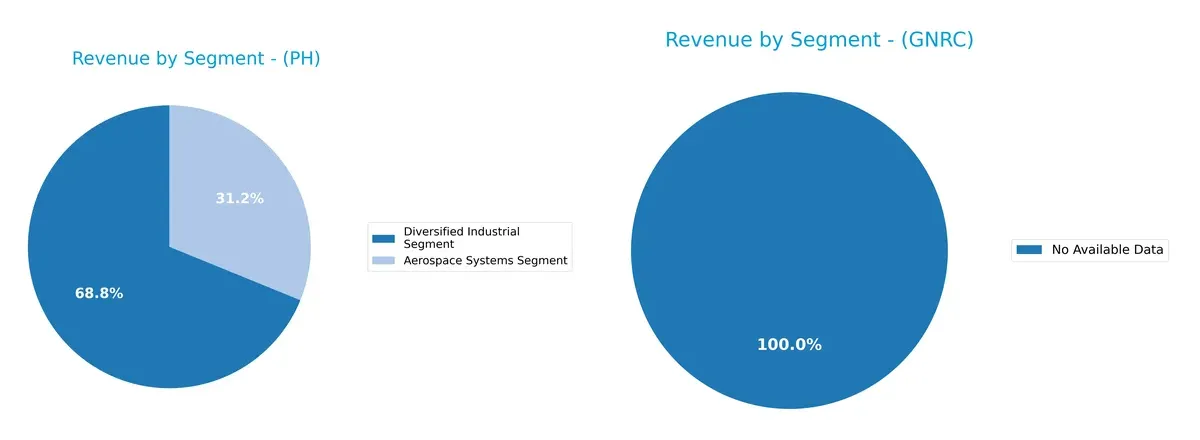
Parker-Hannifin anchors its revenue in two main segments: Diversified Industrial at $13.7B and Aerospace Systems at $6.2B in 2025. This mix reflects a balanced yet industrial-heavy focus, reducing concentration risk through sector diversity. Generac has no available data, preventing segmentation analysis. Parker-Hannifin’s strategy pivots on infrastructure dominance, leveraging broad industrial applications alongside aerospace, which supports resilience across market cycles.
Strengths and Weaknesses Comparison
This table compares the strengths and weaknesses of Parker-Hannifin Corporation (PH) and Generac Holdings Inc. (GNRC):
PH Strengths
- Strong profitability with 17.79% net margin and 25.81% ROE
- ROIC of 13.69% exceeds WACC of 9.24%
- High interest coverage at 11.04x
- Diversified revenue streams in Aerospace and Industrial segments
- Significant global presence, especially in North America and Europe
- Favorable fixed asset turnover at 6.76
GNRC Strengths
- Solid current ratio at 1.97 indicates liquidity strength
- Favorable debt-to-assets ratio at 28.88% supports financial stability
- Interest coverage of 5.56x is healthy
- Neutral ROIC at 9.89% with potential for improvement
- Efficient asset turnover at 0.84
- Favorable fixed asset turnover at 5.01
PH Weaknesses
- Unfavorable PE (25.38) and PB (6.55) ratios may signal overvaluation
- Low quick ratio at 0.71 raises liquidity concerns
- Dividend yield under 1% is unattractive for income investors
- Neutral current ratio close to minimal comfort level
- Moderate debt-to-equity at 0.69 could limit financial flexibility
GNRC Weaknesses
- Unfavorable WACC at 11.42% exceeds ROIC, indicating capital inefficiency
- Unfavorable PE (28.39) and PB (3.7) reflect valuation pressure
- Net margin and ROE are only neutral, showing limited profitability
- Zero dividend yield may deter income-focused investors
- Quick ratio near 1.0 offers limited liquidity cushion
PH demonstrates strong profitability and diversification with a balanced global footprint but faces valuation and liquidity headwinds. GNRC shows financial stability and operational efficiency but struggles with capital costs and profitability margins. Both companies exhibit clear areas for strategic focus to optimize their financial and market positions.
The Moat Duel: Analyzing Competitive Defensibility
A structural moat is the only true defense against profit erosion from competitors over time. Let’s dissect the moats of two industrial machinery players:
Parker-Hannifin Corporation: Durable Engineering & Diversification Moat
I see Parker-Hannifin’s moat rooted in its intangible assets and cost advantages, reflected in a robust 23% EBIT margin and growing ROIC above WACC by 4.4%. Its broad product portfolio and global reach stabilize margins. New aerospace and industrial markets in 2026 could deepen this moat further.
Generac Holdings Inc.: Emerging Brand & Product Innovation Moat
Generac relies on brand strength and innovation in power generation, contrasting Parker-Hannifin’s scale. Despite a favorable gross margin near 39%, its EBIT margin is weaker at 11.6%, with declining ROIC signaling value destruction. Opportunities in energy storage may boost growth but risk margin pressure.
Value Creation vs. Innovation Struggles: The Moat Verdict
Parker-Hannifin’s wider, durable moat outmatches Generac’s narrower, unstable competitive edge. PH’s superior capital efficiency and margin resilience position it better to defend market share in 2026’s industrial landscape. Generac faces significant risks sustaining profitability amid evolving markets.
Which stock offers better returns?
Over the past year, Parker-Hannifin Corporation and Generac Holdings Inc. both posted strong gains, with Parker-Hannifin showing notably higher price appreciation and accelerating momentum.
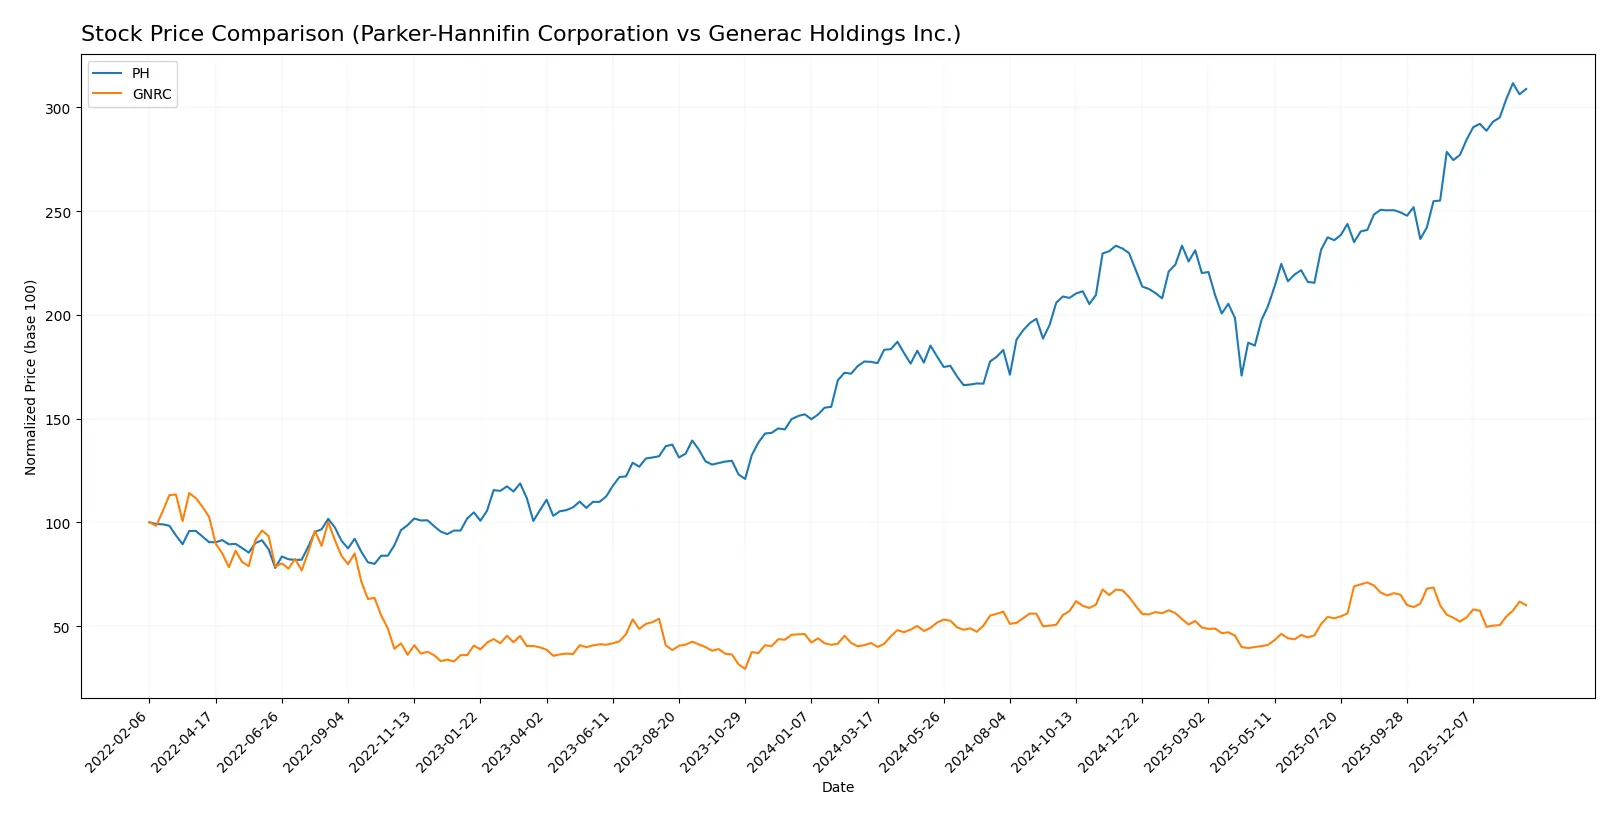
Trend Comparison
Parker-Hannifin’s stock price surged 74.16% over 12 months, signaling a bullish trend with accelerating gains and a high volatility level, peaking at 944.27 and bottoming at 503.3.
Generac Holdings’ stock rose 43.5% over the same period, also bullish with acceleration but lower volatility, reaching a high of 198.8 and a low of 110.25.
Parker-Hannifin outperformed Generac with a stronger price increase and more pronounced acceleration, delivering superior market returns in the past year.
Target Prices
Analysts show a positive outlook with solid upside potential for both Parker-Hannifin and Generac Holdings.
| Company | Target Low | Target High | Consensus |
|---|---|---|---|
| Parker-Hannifin Corporation | 825 | 1,139 | 995.46 |
| Generac Holdings Inc. | 184 | 248 | 208.13 |
The target consensus for Parker-Hannifin suggests a roughly 6% upside from the current price of 935.84. Generac’s consensus implies about 24% potential gain versus its 168.04 share price.

Don’t Let Luck Decide Your Entry Point
Optimize your entry points with our advanced ProRealTime indicators. You’ll get efficient buy signals with precise price targets for maximum performance. Start outperforming now!
How do institutions grade them?
The following tables summarize the latest grades assigned by reputable institutions for each company:
Parker-Hannifin Corporation Grades
The table below shows recent grading actions from major financial firms for Parker-Hannifin Corporation.
| Grading Company | Action | New Grade | Date |
|---|---|---|---|
| Wells Fargo | Maintain | Overweight | 2026-01-30 |
| Citigroup | Maintain | Buy | 2026-01-30 |
| JP Morgan | Maintain | Overweight | 2026-01-30 |
| Jefferies | Maintain | Buy | 2026-01-30 |
| Barclays | Maintain | Overweight | 2026-01-30 |
| Stifel | Maintain | Hold | 2026-01-30 |
| Stifel | Maintain | Hold | 2026-01-23 |
| JP Morgan | Maintain | Overweight | 2026-01-16 |
| Morgan Stanley | Maintain | Equal Weight | 2026-01-14 |
| Barclays | Maintain | Overweight | 2026-01-07 |
Generac Holdings Inc. Grades
The table below shows recent grading actions from major financial firms for Generac Holdings Inc.
| Grading Company | Action | New Grade | Date |
|---|---|---|---|
| Barclays | Maintain | Equal Weight | 2026-01-20 |
| Canaccord Genuity | Maintain | Buy | 2026-01-13 |
| Baird | Upgrade | Outperform | 2026-01-09 |
| Citigroup | Upgrade | Buy | 2026-01-08 |
| B of A Securities | Maintain | Buy | 2026-01-07 |
| Wells Fargo | Upgrade | Overweight | 2025-12-19 |
| JP Morgan | Upgrade | Overweight | 2025-12-08 |
| Citigroup | Maintain | Neutral | 2025-11-03 |
| Barclays | Maintain | Equal Weight | 2025-10-31 |
| Canaccord Genuity | Maintain | Buy | 2025-10-30 |
Which company has the best grades?
Parker-Hannifin consistently receives Overweight and Buy ratings from multiple firms, reflecting steady confidence. Generac also shows strong Buy and Overweight upgrades, with some Outperform ratings, suggesting growing institutional optimism. Investors may view these grading trends as indicators of relative analyst conviction.
Risks specific to each company
The following categories identify the critical pressure points and systemic threats facing both firms in the 2026 market environment:
1. Market & Competition
Parker-Hannifin Corporation
- Operates in diversified industrial and aerospace segments facing cyclical demand and OEM competition.
Generac Holdings Inc.
- Focused on power generation and energy storage, exposed to evolving residential and commercial energy solutions.
2. Capital Structure & Debt
Parker-Hannifin Corporation
- Moderate debt with debt-to-assets at 32.2% and strong interest coverage at 11.0x.
Generac Holdings Inc.
- Slightly lower leverage at 28.9% debt-to-assets, but interest coverage weaker at 5.6x, indicating tighter debt servicing capacity.
3. Stock Volatility
Parker-Hannifin Corporation
- Beta of 1.25 indicates moderate volatility relative to the market.
Generac Holdings Inc.
- Higher beta at 1.83 signals greater stock price sensitivity and market risk.
4. Regulatory & Legal
Parker-Hannifin Corporation
- Aerospace segment faces stringent FAA and defense regulations, raising compliance costs.
Generac Holdings Inc.
- Energy products subject to evolving environmental and safety standards, with potential regulatory uncertainty.
5. Supply Chain & Operations
Parker-Hannifin Corporation
- Complex global supply chain for diverse industrial components, vulnerable to raw material price shifts.
Generac Holdings Inc.
- Relies on specialized components for generators and batteries, with risks from component shortages and logistics.
6. ESG & Climate Transition
Parker-Hannifin Corporation
- Exposure to aerospace emissions regulations and pressure for sustainable manufacturing practices.
Generac Holdings Inc.
- Faces demand shifts towards clean energy solutions; PWRcell brand aims to address climate transition risks.
7. Geopolitical Exposure
Parker-Hannifin Corporation
- Global operations including defense contracts subject to geopolitical tensions and export controls.
Generac Holdings Inc.
- Primarily US-focused but supply chain and international sales expose it to trade policy shifts.
Which company shows a better risk-adjusted profile?
Parker-Hannifin’s most significant risk lies in its exposure to aerospace regulatory complexities and cyclical industrial demand. Generac’s key risk stems from higher stock volatility and tighter debt servicing capacity amid energy sector disruption. Parker-Hannifin’s stronger interest coverage and superior Altman Z-Score (7.0 vs. 4.1) indicate a safer financial footing. However, Generac’s focus on clean energy solutions positions it well for long-term growth despite elevated market risks. Overall, Parker-Hannifin presents a better risk-adjusted profile, supported by its robust financial health and diversified industrial presence.
Final Verdict: Which stock to choose?
Parker-Hannifin Corporation’s superpower lies in its robust capital efficiency and growing economic moat. It consistently delivers high returns on invested capital well above its cost of capital, signaling durable value creation. A point of vigilance is its stretched valuation multiples, which might temper near-term upside. This stock suits portfolios targeting aggressive growth with a tolerance for premium pricing.
Generac Holdings Inc. leverages a strategic moat rooted in its recurring revenue streams and strong operational cash flow generation. It offers a comparatively safer profile with solid liquidity and moderate leverage. However, its declining ROIC trend warns of potential profitability pressures ahead. This makes it a fit for GARP investors seeking balanced growth and reasonable risk.
If you prioritize durable value creation and high profitability, Parker-Hannifin outshines with its proven efficiency and accelerating stock momentum. However, if you seek better stability and stronger liquidity at a moderate valuation, Generac presents a compelling scenario despite its profitability headwinds. Each appeals to distinct investor profiles, underscoring the importance of aligning stock choice with personal risk appetite and strategy.
Disclaimer: Investment carries a risk of loss of initial capital. The past performance is not a reliable indicator of future results. Be sure to understand risks before making an investment decision.
Go Further
I encourage you to read the complete analyses of Parker-Hannifin Corporation and Generac Holdings Inc. to enhance your investment decisions: