Home > Comparison > Industrials > OTIS vs GNRC
The competitive dynamic between Otis Worldwide Corporation and Generac Holdings Inc. shapes the industrial machinery sector’s evolution. Otis operates as a capital-intensive leader in elevator and escalator manufacturing and servicing, while Generac focuses on high-margin power generation and energy solutions. This analysis pits steady infrastructure services against innovative energy products, aiming to identify which strategy delivers superior risk-adjusted returns for a diversified investor portfolio.
Table of contents
Companies Overview
Otis Worldwide Corporation and Generac Holdings Inc. dominate distinct niches within industrial machinery, reflecting broad market relevance.
Otis Worldwide Corporation: Leader in Vertical Transportation
Otis Worldwide Corporation dominates elevator and escalator manufacturing and servicing globally. Its core revenue stems from new equipment sales and ongoing maintenance contracts. In 2026, Otis sharpens its strategic focus on expanding modernization services, leveraging a vast network of 34,000 service mechanics to maintain competitive advantage in urban infrastructure.
Generac Holdings Inc.: Power Generation Innovator
Generac Holdings Inc. specializes in power generation and energy storage solutions for residential and commercial customers. Revenue flows from a diverse product lineup including standby generators, portable units, and clean energy systems. In 2026, Generac intensifies investment in smart energy products like remote monitoring and clean energy solutions to lead the evolving power reliability market.
Strategic Collision: Similarities & Divergences
Both companies operate in industrial machinery but diverge sharply: Otis relies on a service-heavy, installed base model, while Generac pursues product innovation with a broad energy portfolio. They clash primarily in infrastructure resilience, Otis in vertical mobility and Generac in power continuity. Their investment profiles contrast Otis’s stable service cash flow with Generac’s growth-driven tech exposure.
Income Statement Comparison
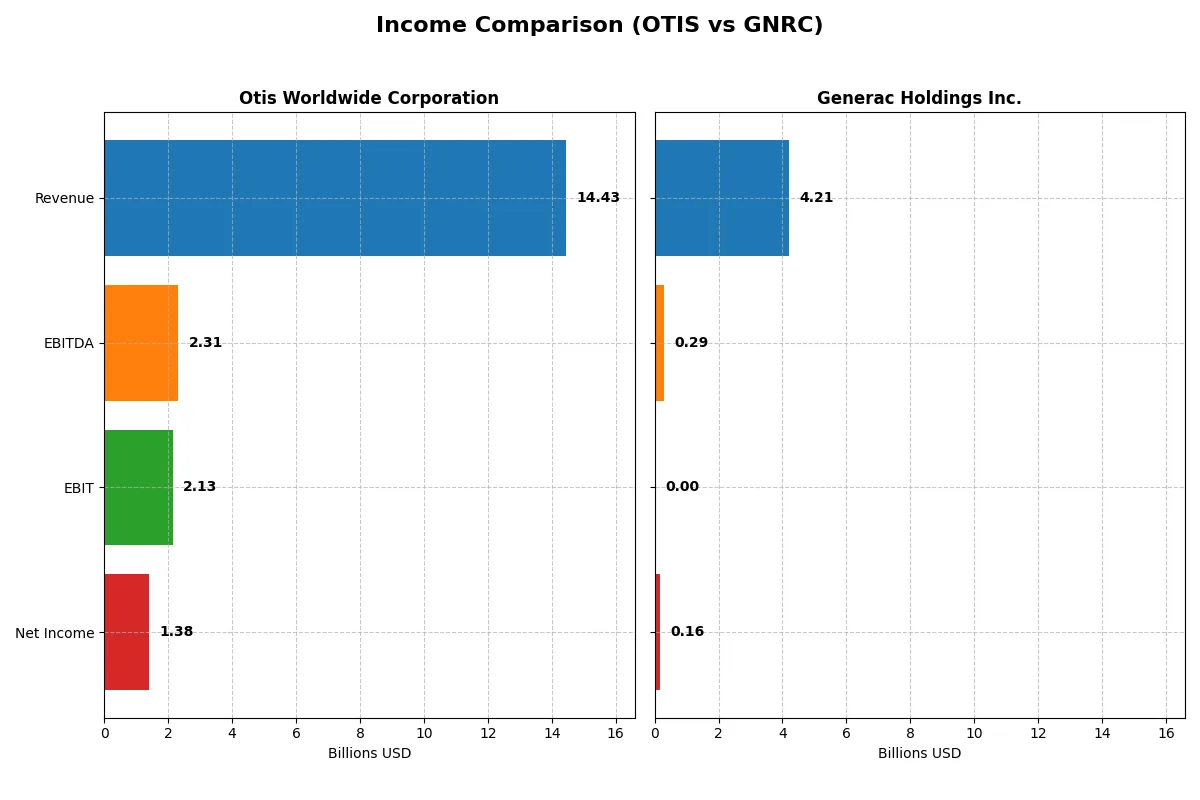
This data dissects the core profitability and scalability of both corporate engines to reveal who dominates the bottom line:
| Metric | Otis Worldwide Corporation (OTIS) | Generac Holdings Inc. (GNRC) |
|---|---|---|
| Revenue | 14.4B | 4.2B |
| Cost of Revenue | 10.1B | 2.6B |
| Operating Expenses | 2.2B | 1.3B |
| Gross Profit | 4.4B | 1.6B |
| EBITDA | 2.3B | 289M |
| EBIT | 2.1B | 0 |
| Interest Expense | 196M | 71M |
| Net Income | 1.4B | 160M |
| EPS | 3.53 | 2.73 |
| Fiscal Year | 2025 | 2025 |
Income Statement Analysis: The Bottom-Line Duel
This income statement comparison exposes the true operational efficiency and profitability momentum of two distinct corporate engines.
Otis Worldwide Corporation Analysis
Otis exhibits steady revenue growth, reaching $14.4B in 2025 with net income at $1.38B. Its gross margin holds firm at 30.3%, while net margin remains favorable at 9.6%. Despite a slight revenue growth slowdown of 1.2% last year, Otis maintains operational efficiency with improving EBIT margins and a solid EPS trajectory, signaling resilience.
Generac Holdings Inc. Analysis
Generac’s revenue shrank 2% to $4.2B in 2025, with net income plummeting 51% to $160M. Though it sustains a strong gross margin of 38.3%, the EBIT margin collapsed to zero, reflecting deteriorating operating profitability. The sharp net margin decline to 3.8% and EPS halving highlight significant margin pressures and weakening earnings momentum.
Margin Stability vs. Earnings Volatility
Otis delivers consistent margin health and steady net income growth, outperforming Generac’s revenue scale but volatile profitability. Generac’s impressive gross margins fail to translate into sustainable earnings, undermined by shrinking net margins and operating losses. Otis’s profile offers a clearer path to durable returns, favored for investors prioritizing stable cash flow generation.
Financial Ratios Comparison
These vital ratios act as a diagnostic tool to expose the underlying fiscal health, valuation premiums, and capital efficiency of the companies compared:
| Ratios | Otis Worldwide Corporation (OTIS) | Generac Holdings Inc. (GNRC) |
|---|---|---|
| ROE | -25.7% (2025) | 0% (2025) |
| ROIC | 39.6% (2025) | 0% (2025) |
| P/E | 24.8 (2025) | 50.0 (2025) |
| P/B | -6.4 (2025) | 0 (2025) |
| Current Ratio | 0.85 (2025) | 0 (2025) |
| Quick Ratio | 0.77 (2025) | 0 (2025) |
| D/E (Debt-to-Equity) | -1.62 (2025) | 0 (2025) |
| Debt-to-Assets | 82.1% (2025) | 0 (2025) |
| Interest Coverage | 10.9 (2025) | -4.1 (2025) |
| Asset Turnover | 1.35 (2025) | 0 (2025) |
| Fixed Asset Turnover | 11.13 (2025) | 0 (2025) |
| Payout Ratio | 46.7% (2025) | 0.18% (2025) |
| Dividend Yield | 1.88% (2025) | 0.004% (2025) |
| Fiscal Year | 2025 | 2025 |
Efficiency & Valuation Duel: The Vital Signs
Financial ratios serve as a company’s DNA, revealing hidden risks and operational strengths beyond surface numbers.
Otis Worldwide Corporation
Otis shows a mixed profitability profile with a negative ROE at -25.7% but a robust ROIC of 39.6%, signaling efficient capital use. Its P/E ratio of 24.85 suggests a fairly valued stock, neither cheap nor stretched. The company returns value through a modest 1.88% dividend yield, balancing shareholder payouts with reinvestment in R&D.
Generac Holdings Inc.
Generac exhibits weak core profitability, with a low net margin of 3.8% and zero recorded ROE and ROIC, indicating operational challenges. Its P/E ratio is high at 50.02, marking the stock as expensive. The absence of dividends suggests reliance on growth and R&D investments, but financial indicators point to high risk and inefficiency.
Valuation Discipline vs. Profitability Concerns
Otis offers a better balance of operational efficiency and valuation discipline compared to Generac’s stretched multiples and weak profitability. Investors prioritizing stability and capital return will find Otis’s profile more aligned with their goals, while Generac suits those willing to endure volatility for growth potential.
Which one offers the Superior Shareholder Reward?
I compare Otis Worldwide Corporation (OTIS) and Generac Holdings Inc. (GNRC) on dividend yield, payout ratio, and buyback intensity. Otis delivers a 1.88% yield with a 47% payout ratio, supported by strong free cash flow (3.67/share). It also sustains buybacks, balancing income and capital returns. Generac barely pays dividends (0.0037% yield) and retains nearly all free cash flow (7.48/share) for growth and acquisitions. Its buyback program is minimal. I view Otis’s disciplined payout and buybacks as more sustainable amid market cycles. Generac’s reinvestment promises growth but carries higher risk. For 2026, Otis offers a superior total return profile, blending income stability with capital discipline.
Comparative Score Analysis: The Strategic Profile
The radar chart reveals the core strategic DNA and trade-offs of Otis Worldwide Corporation and Generac Holdings Inc.:
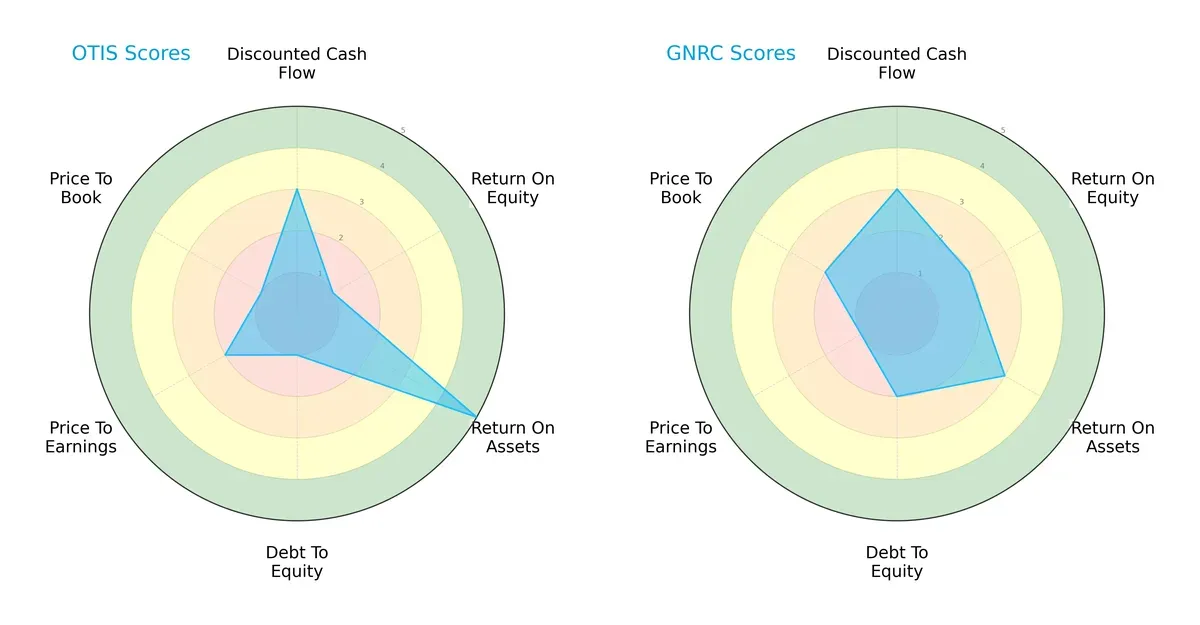
Otis excels in asset utilization (ROA score 5) but struggles with equity returns (ROE score 1) and leverage (Debt/Equity score 1). Generac shows a more balanced but moderate performance across ROE (2), ROA (3), and Debt/Equity (2). Otis relies on operational efficiency, while Generac maintains steadier financial leverage, making Generac’s profile slightly more balanced overall.
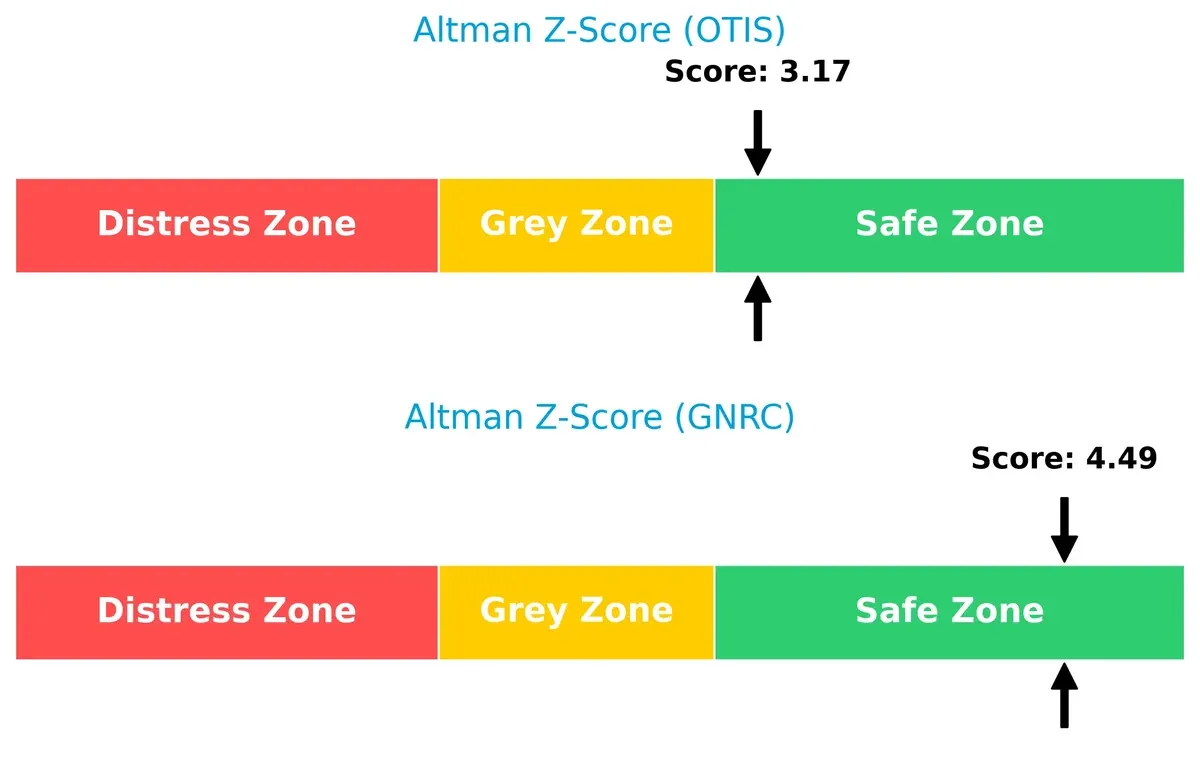
Bankruptcy Risk: Solvency Showdown
Generac’s Altman Z-Score of 4.49 significantly exceeds Otis’s 3.17, placing both in the safe zone but signaling Generac’s stronger cushion against financial distress in this cycle:
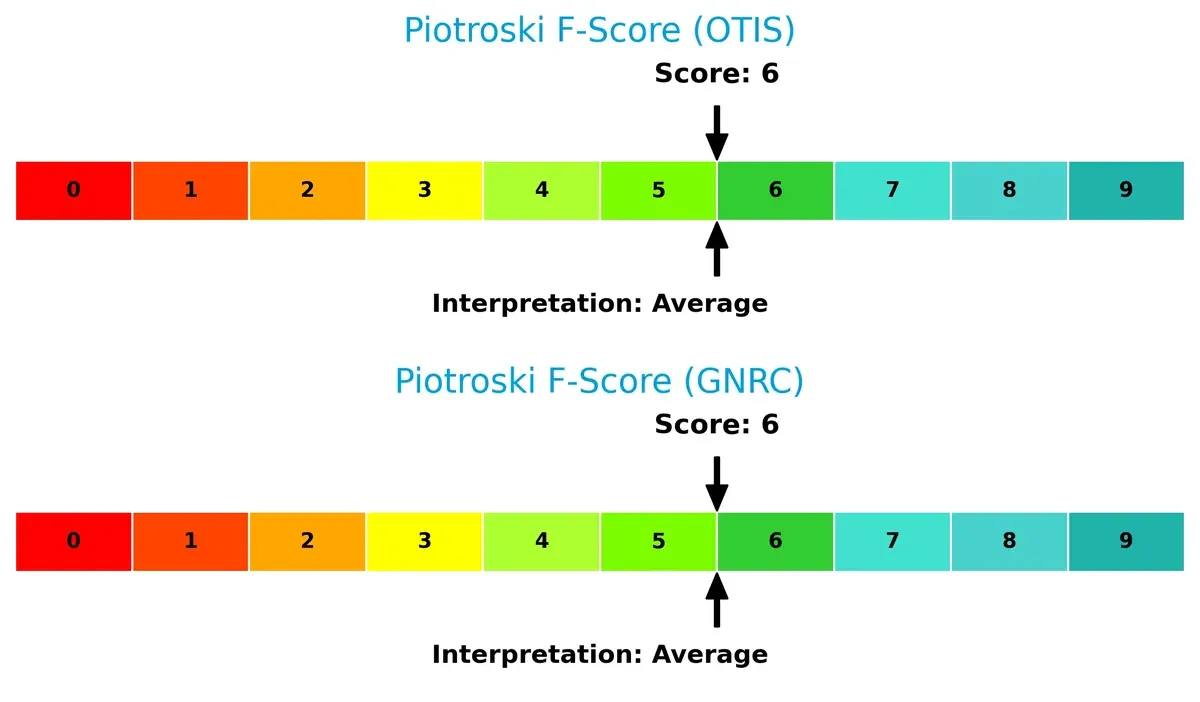
Financial Health: Quality of Operations
Both companies share an identical Piotroski F-Score of 6, indicating average financial health. Neither shows critical red flags, but both have room for improvement in operational robustness:
How are the two companies positioned?
This section dissects Otis and Generac’s operational DNA by comparing revenue distribution and internal strengths and weaknesses. The goal is to confront their economic moats and identify which model offers the most resilient and sustainable competitive advantage today.
Revenue Segmentation: The Strategic Mix
This visual comparison dissects how Otis Worldwide Corporation and Generac Holdings Inc. diversify their income streams and where their primary sector bets lie:
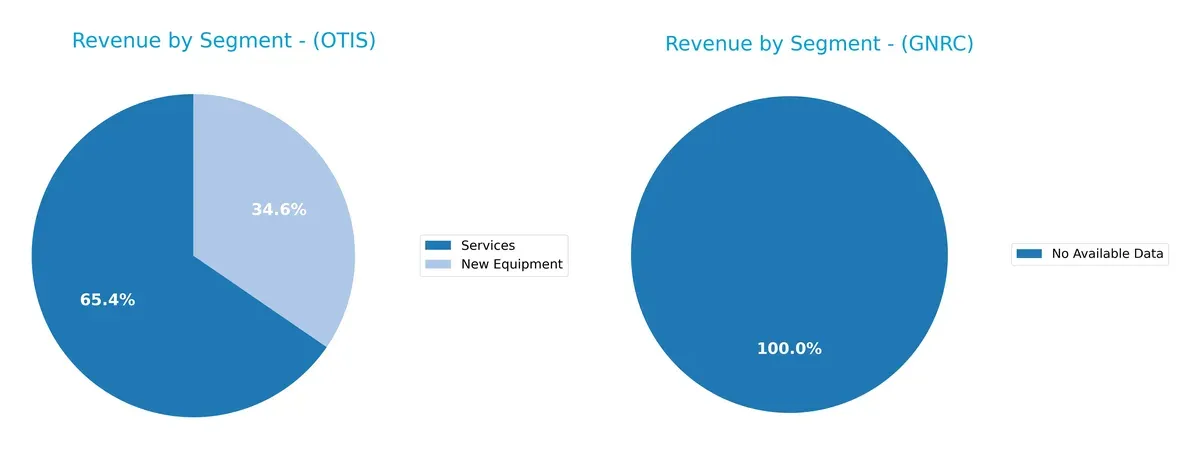
Otis leans heavily on two segments: Services anchors with $9.44B in 2025, while New Equipment adds $5B. Generac lacks available data, preventing direct comparison. Otis’s mix shows strategic balance, reducing concentration risk by combining steady service revenue with equipment sales. This blend supports infrastructure dominance and ecosystem lock-in, crucial in the industrial sector’s cyclicality. Without Generac’s data, Otis’s diversification stands unchallenged here.
Strengths and Weaknesses Comparison
This table compares the strengths and weaknesses of Otis Worldwide Corporation and Generac Holdings Inc.:
Otis Strengths
- Strong service revenue of 9.44B in 2025
- Favorable ROIC of 39.59% above WACC
- High asset and fixed asset turnover
- Favorable debt to equity and interest coverage
Generac Strengths
- Favorable price-to-book ratio
- Favorable debt to equity and debt to assets ratios
- Presence in a defined market niche
Otis Weaknesses
- Unfavorable high debt to assets of 82.14%
- Low current and quick ratios below 1
- Negative ROE at -25.67%
- Neutral net margin of 9.59% and P/E of 24.85
Generac Weaknesses
- Unfavorable zero or negative profitability ratios (ROE, ROIC, net margin)
- Unavailable WACC data increases uncertainty
- Unfavorable liquidity ratios at 0
- Negative interest coverage and turnover ratios
- High P/E of 50.02 and zero dividend yield
Otis shows operational efficiency and favorable capital returns but faces liquidity and leverage challenges. Generac struggles with profitability and liquidity, signaling financial risks that may constrain growth and capital allocation.
The Moat Duel: Analyzing Competitive Defensibility
A structural moat is the sole barrier preserving long-term profits from relentless competitive forces. Here’s how Otis and Generac defend their turf:
Otis Worldwide Corporation: Service Network & Intangible Assets Moat
Otis leverages an extensive global service network and strong brand reputation, yielding a very favorable ROIC 32% above WACC. This sustains margin stability despite modest revenue growth. Expansion in modernization services could deepen this moat in 2026.
Generac Holdings Inc.: Product Innovation Moat
Generac’s moat centers on product innovation in power generation but lacks Otis’s network scale. Its ROIC trend is sharply declining, reflecting margin pressure and operational challenges. New clean energy solutions offer growth potential but face execution risks.
Verdict: Network Scale vs. Innovation Agility
Otis’s wide and sustainable service network creates a deeper moat than Generac’s faltering innovation-driven advantage. Otis stands better equipped to defend and grow market share amid rising competitive pressures in 2026.
Which stock offers better returns?
The past 12 months show contrasting trajectories: Otis Worldwide Corporation’s price declines steadily, while Generac Holdings Inc. surges sharply, reflecting divergent market sentiments and trading momentum.
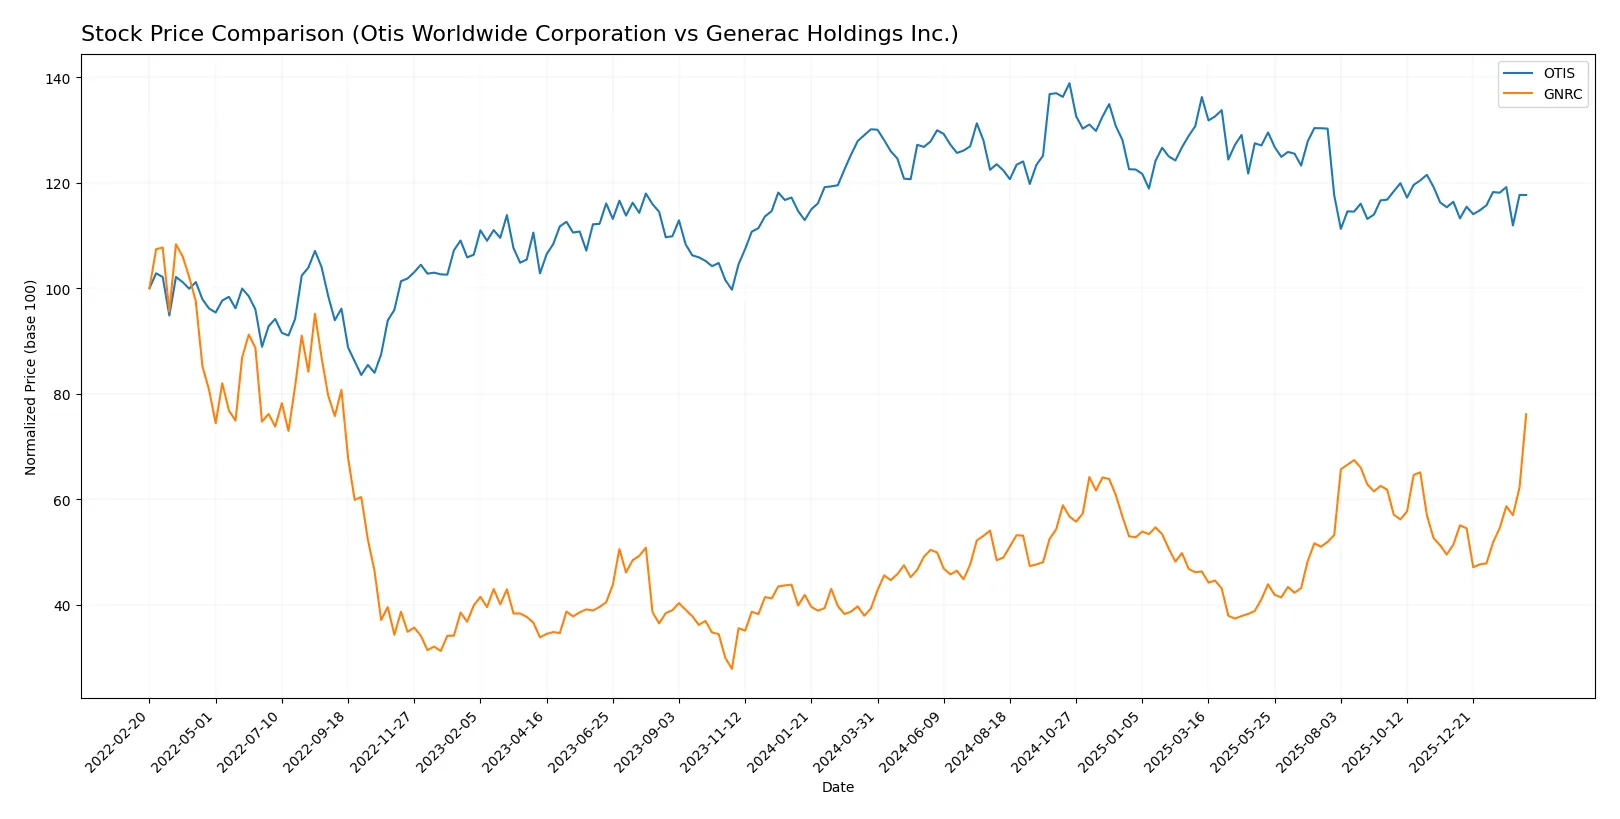
Trend Comparison
Otis Worldwide Corporation’s stock fell 9.57% over the past year, signaling a bearish trend with accelerating decline. It traded between 106.01 and 84.93, showing moderate volatility (4.89 std dev).
Generac Holdings Inc. gained 93.64% over the same period, marking a bullish trend with accelerating momentum. Its price ranged wide from 110.25 to 224.45, accompanied by high volatility (22.77 std dev).
Generac’s stock outperformed Otis decisively, delivering the highest market returns and stronger buyer dominance throughout the analyzed period.
Target Prices
Analysts present a clear consensus with defined price ranges for Otis Worldwide Corporation and Generac Holdings Inc.
| Company | Target Low | Target High | Consensus |
|---|---|---|---|
| Otis Worldwide Corporation | 92 | 109 | 97.75 |
| Generac Holdings Inc. | 195 | 292 | 238.89 |
The consensus target prices show moderate upside potential for Otis and a robust premium for Generac, both trading below their respective consensus targets.

Don’t Let Luck Decide Your Entry Point
Optimize your entry points with our advanced ProRealTime indicators. You’ll get efficient buy signals with precise price targets for maximum performance. Start outperforming now!
How do institutions grade them?
Here are the recent institutional grades for Otis Worldwide Corporation and Generac Holdings Inc.:
Otis Worldwide Corporation Grades
The table below summarizes the latest grade updates from major financial institutions for Otis Worldwide Corporation.
| Grading Company | Action | New Grade | Date |
|---|---|---|---|
| JP Morgan | Maintain | Overweight | 2026-01-16 |
| Wells Fargo | Maintain | Equal Weight | 2025-12-15 |
| Barclays | Maintain | Underweight | 2025-10-30 |
| Wolfe Research | Upgrade | Outperform | 2025-10-08 |
| RBC Capital | Maintain | Outperform | 2025-07-28 |
Generac Holdings Inc. Grades
The table below shows recent institutional grades and actions for Generac Holdings Inc.
| Grading Company | Action | New Grade | Date |
|---|---|---|---|
| Barclays | Maintain | Equal Weight | 2026-02-13 |
| Wells Fargo | Maintain | Overweight | 2026-02-12 |
| Guggenheim | Downgrade | Neutral | 2026-02-12 |
| Baird | Upgrade | Outperform | 2026-01-09 |
| Citigroup | Upgrade | Buy | 2026-01-08 |
Which company has the best grades?
Generac Holdings shows generally stronger grades with recent upgrades to Outperform and Buy from multiple firms. Otis has mixed grades, including an Underweight from Barclays. Investors may view Generac as favored by analysts, reflecting potentially greater confidence in its prospects.
Risks specific to each company
The following categories identify the critical pressure points and systemic threats facing both firms in the 2026 market environment:
1. Market & Competition
Otis Worldwide Corporation
- Operates globally with established service network, facing moderate industrial machinery competition.
Generac Holdings Inc.
- Faces intense competition in power generation and clean energy sectors; market is rapidly evolving.
2. Capital Structure & Debt
Otis Worldwide Corporation
- High debt-to-assets ratio (82.14%) signals leverage risk despite favorable interest coverage.
Generac Holdings Inc.
- Reports low or unavailable debt metrics; interest coverage is negative, indicating financial risk.
3. Stock Volatility
Otis Worldwide Corporation
- Beta near 1.0 suggests market-correlated stock volatility, relatively stable.
Generac Holdings Inc.
- Beta of 1.81 indicates high volatility, increasing investment risk.
4. Regulatory & Legal
Otis Worldwide Corporation
- Subject to industrial safety and infrastructure regulations globally; moderate legal risk.
Generac Holdings Inc.
- Faces regulatory scrutiny in emissions, energy storage, and product safety; higher compliance risk.
5. Supply Chain & Operations
Otis Worldwide Corporation
- Large service network may mitigate supply chain disruptions but depends on global logistics.
Generac Holdings Inc.
- Relies on diverse components and raw materials; supply chain volatility could impact production.
6. ESG & Climate Transition
Otis Worldwide Corporation
- Industrial machinery sector faces pressure to improve sustainability; moderate ESG risk.
Generac Holdings Inc.
- Clean energy push offers growth but requires capital-intensive transition; ESG compliance is critical.
7. Geopolitical Exposure
Otis Worldwide Corporation
- Exposure to US and China markets; geopolitical tensions could affect international sales.
Generac Holdings Inc.
- Primarily US-focused with some global sales; geopolitical risks moderate but present.
Which company shows a better risk-adjusted profile?
Otis faces significant leverage risk but benefits from stable operations and moderate volatility. Generac’s high stock volatility and unclear debt position raise red flags. Otis’s Altman Z-Score indicates safer financial health, supporting a better risk-adjusted profile. Generac’s negative interest coverage and beta above 1.8 highlight elevated risk. Recent data show Otis’s high debt-to-assets ratio as a concern, but Generac’s weak profitability and financial metrics pose greater systemic threats.
Final Verdict: Which stock to choose?
Otis Worldwide Corporation’s superpower lies in its ability to create significant value through a robust and growing return on invested capital. Its disciplined capital allocation and operational efficiency stand out. However, its weak liquidity ratios warrant vigilance. Otis fits portfolios seeking steady value creation with moderate growth—ideal for disciplined, long-term investors.
Generac Holdings Inc. benefits from a niche in power solutions with a strategic moat grounded in innovation and recurring revenue streams. Relative to Otis, it offers greater volatility and growth potential but with less financial stability. Generac suits aggressive growth portfolios willing to embrace higher risk for outsized returns.
If you prioritize capital efficiency and proven value creation, Otis is the compelling choice due to its strong moat and sustainable profitability. However, if you seek high growth and can tolerate earnings volatility, Generac offers better momentum and upside potential. Both carry distinct risk profiles that investors must weigh carefully.
Disclaimer: Investment carries a risk of loss of initial capital. The past performance is not a reliable indicator of future results. Be sure to understand risks before making an investment decision.
Go Further
I encourage you to read the complete analyses of Otis Worldwide Corporation and Generac Holdings Inc. to enhance your investment decisions: