Nordson Corporation and Generac Holdings Inc. are two prominent players in the industrial machinery sector, each driving innovation in their specialized markets—precision dispensing systems versus power generation equipment. Both companies share a focus on technological advancement and serve diverse industrial and commercial customers globally. In this article, I will analyze their strengths and risks to help you decide which stock could be the smarter addition to your investment portfolio in 2026.
Table of contents
Companies Overview
I will begin the comparison between Nordson Corporation and Generac Holdings Inc. by providing an overview of these two companies and their main differences.
Nordson Corporation Overview
Nordson Corporation engineers, manufactures, and markets systems for dispensing, applying, and controlling adhesives, coatings, and other fluids globally. It operates in two segments: Industrial Precision Solutions and Advanced Technology Solutions. Nordson’s products serve industries including packaging, semiconductor, and medical devices, emphasizing precision and automation. Founded in 1935, it is headquartered in Westlake, Ohio, with a workforce of 8,000 employees.
Generac Holdings Inc. Overview
Generac Holdings Inc. designs and sells power generation equipment and energy storage systems mainly for residential, commercial, and industrial markets worldwide. Its product range includes standby generators, portable generators, and clean energy solutions under PWRcell and PWRview brands. Established in 1959 and based in Waukesha, Wisconsin, Generac employs approximately 5,389 people and distributes through a broad dealer and retail network.
Key similarities and differences
Both companies operate in the industrial machinery sector in the US, focusing on specialized equipment. Nordson concentrates on precision fluid dispensing and coating systems, while Generac specializes in power generation and energy solutions. Nordson has a larger workforce and market cap of $14.6B versus Generac’s $8.9B, reflecting different scale and product diversification. Their business models include direct sales and distributor networks, but the end markets served and product types vary significantly.
Income Statement Comparison
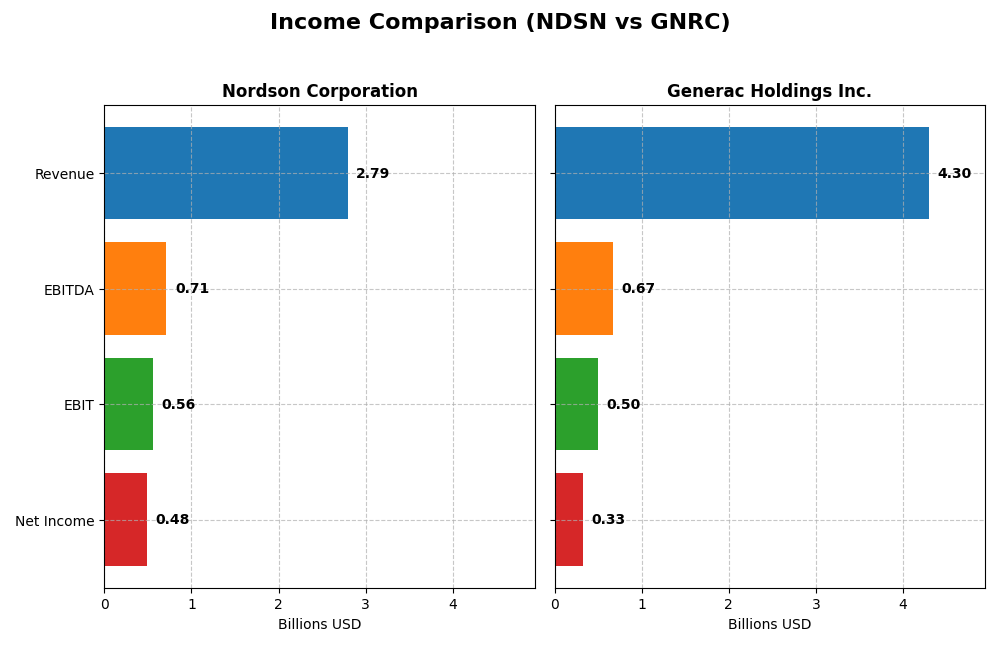
The table below presents a side-by-side comparison of the most recent full fiscal year income statement metrics for Nordson Corporation and Generac Holdings Inc.
| Metric | Nordson Corporation (NDSN) | Generac Holdings Inc. (GNRC) |
|---|---|---|
| Market Cap | 14.6B | 8.97B |
| Revenue | 2.79B | 4.30B |
| EBITDA | 712M | 671M |
| EBIT | 561M | 499M |
| Net Income | 484M | 325M |
| EPS | 8.56 | 5.46 |
| Fiscal Year | 2025 | 2024 |
Income Statement Interpretations
Nordson Corporation
Nordson Corporation’s revenue showed a steady increase from 2.36B in 2021 to 2.79B in 2025, with net income rising from 454M to 484M over the same period. Gross and net margins remained stable, albeit with a slight decline in net margin growth overall. The latest fiscal year saw revenue growth slow to 3.78%, while EBIT dropped 16.79%, indicating margin pressure despite favorable EPS growth.
Generac Holdings Inc.
Generac’s revenue expanded significantly from 2.49B in 2020 to 4.30B in 2024, with net income fluctuating, falling from 533M in 2021 to 325M in 2024. Gross margin improved markedly, and EBIT growth was strong at 28.67% in the last year. However, net margin and EPS growth declined overall, reflecting challenges in sustaining profitability despite robust top-line expansion.
Which one has the stronger fundamentals?
Both companies display favorable overall income statement evaluations with similar proportions of positive indicators. Nordson maintains higher and more stable margins with moderate revenue and net income growth, while Generac shows stronger revenue gains but weaker net income trends and margin compression. The differing margin stability and profitability trajectories highlight contrasting fundamental strengths.
Financial Ratios Comparison
Below is a comparison of key financial ratios for Nordson Corporation (NDSN) and Generac Holdings Inc. (GNRC) based on their most recent fiscal year data.
| Ratios | Nordson Corporation (2025) | Generac Holdings Inc. (2024) |
|---|---|---|
| ROE | 15.9% | 13.0% |
| ROIC | 10.5% | 9.9% |
| P/E | 27.1 | 28.4 |
| P/B | 4.31 | 3.70 |
| Current Ratio | 1.64 | 1.97 |
| Quick Ratio | 1.05 | 0.97 |
| D/E (Debt-to-Equity) | 0.69 | 0.59 |
| Debt-to-Assets | 35.4% | 28.9% |
| Interest Coverage | 7.04 | 5.98 |
| Asset Turnover | 0.47 | 0.84 |
| Fixed Asset Turnover | 4.70 | 5.01 |
| Payout Ratio | 37.0% | 0.08% |
| Dividend Yield | 1.36% | 0.003% |
Interpretation of the Ratios
Nordson Corporation
Nordson shows a generally strong financial profile with favorable net margin (17.35%), ROE (15.92%), and ROIC (10.49%), supported by solid current and quick ratios. Concerns include relatively high PE (27.1) and PB (4.31) ratios, and a low asset turnover of 0.47. Dividend yield stands at 1.36%, with stable payouts covered adequately by free cash flow, suggesting moderate shareholder returns without excessive risk.
Generac Holdings Inc.
Generac’s ratios present a more neutral stance, with moderate ROE (13.04%) and net margin (7.57%). Favorable metrics include current ratio (1.97), debt to assets (28.88%), and interest coverage (5.56), but high WACC (11.3%) and PE (28.39) ratios are unfavorable. The company does not pay dividends, likely reflecting reinvestment or growth priorities, which may appeal to investors focused on capital appreciation rather than income.
Which one has the best ratios?
Nordson’s ratios are slightly more favorable overall, showing stronger profitability and coverage metrics despite some valuation concerns. Generac balances moderate profitability with higher risk indicators and no dividend returns. Therefore, based purely on ratio analysis, Nordson exhibits a marginally better financial ratio profile compared to Generac.
Strategic Positioning
This section compares the strategic positioning of Nordson Corporation and Generac Holdings Inc., focusing on market position, key segments, and exposure to technological disruption:
Nordson Corporation
- Strong market presence with moderate competitive pressure in industrial machinery.
- Diversified segments: Industrial Precision, Advanced Technology, and Medical & Fluid Solutions drive revenue.
- Exposure to technological disruption through advanced dispensing and automated systems.
Generac Holdings Inc.
- Significant market presence but higher competitive pressure in power generation and energy equipment.
- Concentrated on power generation equipment, energy storage, and outdoor power products for varied markets.
- Faces disruption risks with energy storage innovations and remote monitoring technologies for generators.
Nordson Corporation vs Generac Holdings Inc. Positioning
Nordson’s diversified business model across precision solutions and medical technology contrasts with Generac’s focus on power generation and energy products, offering Nordson broader revenue streams but Generac potentially deeper market specialization.
Which has the best competitive advantage?
Nordson shows a slightly favorable moat with value creation despite declining profitability, while Generac’s very unfavorable moat indicates value destruction and declining returns, reflecting stronger competitive advantage for Nordson based on MOAT evaluation.
Stock Comparison
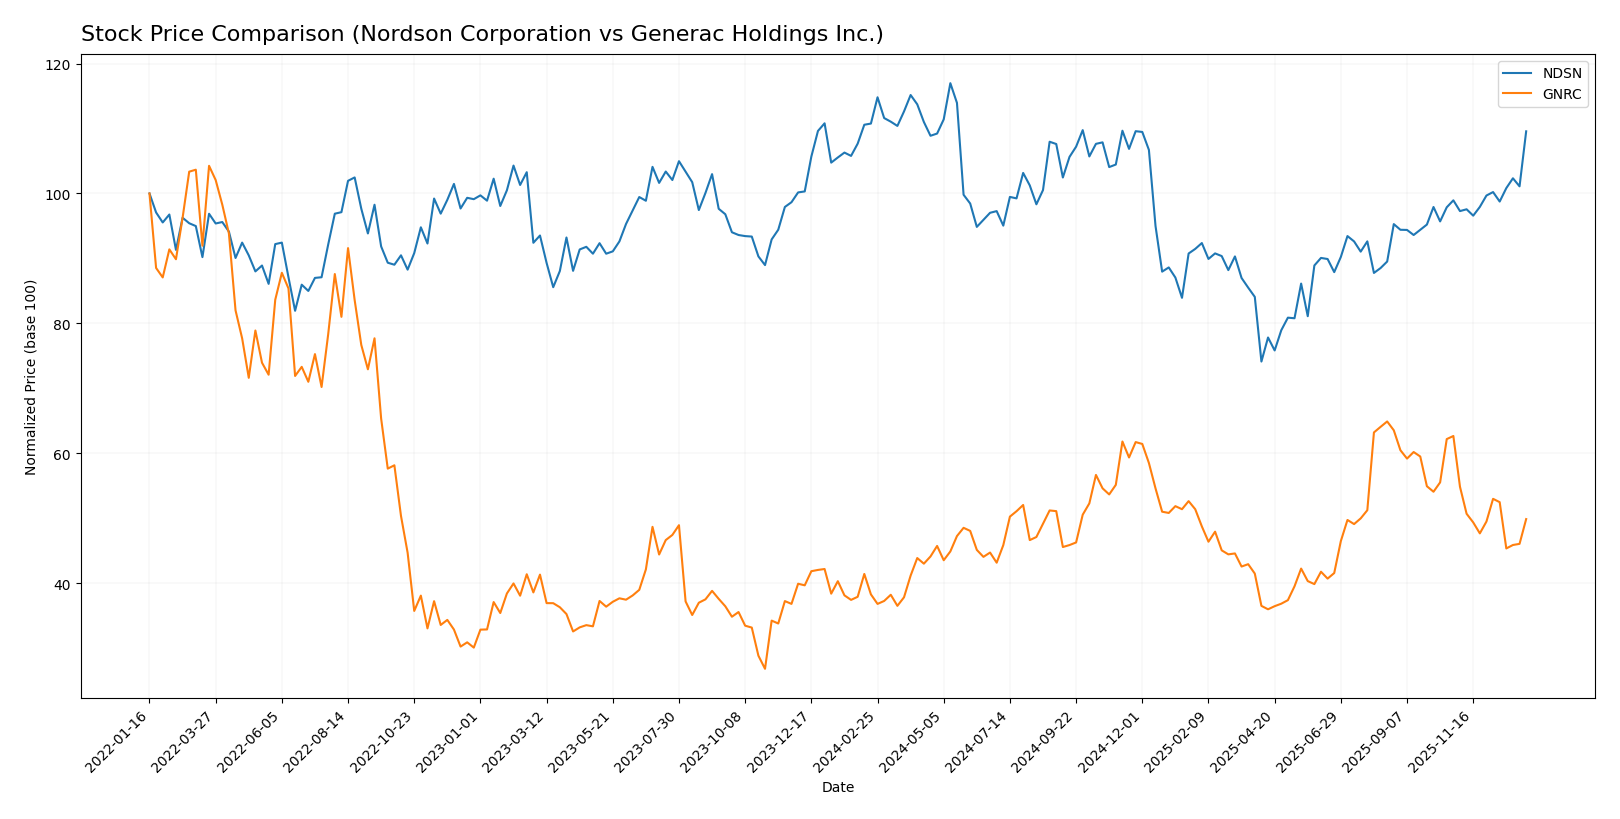
The stock price movements over the past year show contrasting dynamics, with Nordson Corporation exhibiting a slight overall decline yet strong recent gains, while Generac Holdings Inc. demonstrates a significant yearly rise despite recent downward pressure.
Trend Analysis
Nordson Corporation’s stock experienced a -1.08% decline over the past 12 months, indicating a neutral to slightly bearish trend with acceleration and notable volatility (std deviation 23.45). Recent months show a robust 10.73% price increase.
Generac Holdings Inc. posted a strong 30.27% gain over the last year, reflecting a bullish trend with deceleration and moderate volatility (std deviation 22.61). However, its recent trend reversed sharply with a -20.41% drop.
Comparing both, Generac Holdings Inc. delivered the highest market performance over the past year, despite recent short-term weakness, while Nordson showed modest losses but a positive recent rebound.
Target Prices
Analysts present a clear target price consensus for both Nordson Corporation and Generac Holdings Inc.
| Company | Target High | Target Low | Consensus |
|---|---|---|---|
| Nordson Corporation | 295 | 240 | 274.17 |
| Generac Holdings Inc. | 248 | 184 | 210 |
The target consensus for Nordson at 274.17 is moderately above its current price of 261.22, indicating modest upside potential. Generac’s consensus target at 210 suggests significant expected appreciation compared to its current 152.78 price.
Analyst Opinions Comparison
This section compares analysts’ ratings and grades for Nordson Corporation and Generac Holdings Inc.:
Rating Comparison
NDSN Rating
- Rating: Both have a “B” rating, indicating a very favorable evaluation by analysts.
- Discounted Cash Flow Score: Both scored 3, reflecting a moderate assessment of valuation based on future cash flows.
- ROE Score: Both companies have a score of 4, showing favorable profitability relative to shareholders’ equity.
- ROA Score: Both scored 4, indicating efficient asset utilization to generate earnings.
- Debt To Equity Score: Both have a score of 2, suggesting moderate financial risk with some reliance on debt.
- Overall Score: Each company received a score of 3, signifying a moderate overall financial standing.
GNRC Rating
- Rating: Both have a “B” rating, indicating a very favorable evaluation by analysts.
- Discounted Cash Flow Score: Both scored 3, reflecting a moderate assessment of valuation based on future cash flows.
- ROE Score: Both companies have a score of 4, showing favorable profitability relative to shareholders’ equity.
- ROA Score: Both scored 4, indicating efficient asset utilization to generate earnings.
- Debt To Equity Score: Both have a score of 2, suggesting moderate financial risk with some reliance on debt.
- Overall Score: Each company received a score of 3, signifying a moderate overall financial standing.
Which one is the best rated?
Based strictly on the provided data, both Nordson Corporation and Generac Holdings Inc. share identical ratings and scores across all evaluated metrics, resulting in an equal analyst rating with no clear outperformer.
Scores Comparison
The following table compares the Altman Z-Score and Piotroski Score for Nordson Corporation and Generac Holdings Inc.:
NDSN Scores
- Altman Z-Score: 4.9, indicating a safe zone status.
- Piotroski Score: 7, classified as strong financial health.
GNRC Scores
- Altman Z-Score: 3.73, indicating a safe zone status.
- Piotroski Score: 7, classified as strong financial health.
Which company has the best scores?
Both Nordson Corporation and Generac Holdings show Altman Z-Scores in the safe zone and strong Piotroski Scores of 7. Nordson has a slightly higher Altman Z-Score, suggesting marginally better financial stability based on this metric.
Grades Comparison
Below is the comparison of the latest reliable grades from recognized grading companies for both Nordson Corporation and Generac Holdings Inc.:
Nordson Corporation Grades
This table presents recent grades issued by reputable firms for Nordson Corporation:
| Grading Company | Action | New Grade | Date |
|---|---|---|---|
| DA Davidson | Maintain | Buy | 2025-12-12 |
| Baird | Maintain | Neutral | 2025-12-12 |
| DA Davidson | Maintain | Buy | 2025-12-11 |
| Keybanc | Maintain | Overweight | 2025-12-11 |
| Oppenheimer | Maintain | Outperform | 2025-08-25 |
| Baird | Maintain | Neutral | 2025-08-22 |
| Keybanc | Maintain | Overweight | 2025-07-15 |
| Baird | Maintain | Neutral | 2025-05-30 |
| Oppenheimer | Upgrade | Outperform | 2025-05-30 |
| Keybanc | Maintain | Overweight | 2025-04-08 |
The overall grading trend for Nordson Corporation is stable with mostly “Buy,” “Neutral,” and “Overweight” ratings, including an upgrade from Oppenheimer to “Outperform.”
Generac Holdings Inc. Grades
This table presents recent grades issued by reputable firms for Generac Holdings Inc.:
| Grading Company | Action | New Grade | Date |
|---|---|---|---|
| Baird | Upgrade | Outperform | 2026-01-09 |
| Citigroup | Upgrade | Buy | 2026-01-08 |
| B of A Securities | Maintain | Buy | 2026-01-07 |
| Wells Fargo | Upgrade | Overweight | 2025-12-19 |
| JP Morgan | Upgrade | Overweight | 2025-12-08 |
| Citigroup | Maintain | Neutral | 2025-11-03 |
| Barclays | Maintain | Equal Weight | 2025-10-31 |
| UBS | Maintain | Buy | 2025-10-30 |
| Canaccord Genuity | Maintain | Buy | 2025-10-30 |
| Citigroup | Maintain | Neutral | 2025-10-21 |
Generac Holdings shows a positive trend with multiple upgrades to “Buy,” “Outperform,” and “Overweight” ratings in recent months.
Which company has the best grades?
Generac Holdings Inc. has received more recent upgrades and a higher volume of “Buy” and “Outperform” ratings compared to Nordson Corporation, which has maintained a mix of “Buy,” “Neutral,” and “Overweight” grades. This suggests a comparatively stronger bullish sentiment for Generac, potentially influencing investor confidence and portfolio decisions.
Strengths and Weaknesses
Below is a comparison of key strengths and weaknesses for Nordson Corporation (NDSN) and Generac Holdings Inc. (GNRC) based on their recent financial and operational data.
| Criterion | Nordson Corporation (NDSN) | Generac Holdings Inc. (GNRC) |
|---|---|---|
| Diversification | Highly diversified across Advanced Technology Systems, Industrial Precision Solutions, and Medical and Fluid Solutions, with revenues exceeding $2.7B in 2024 | Less diversified, focused mainly on power generation products; lacks detailed product segmentation data |
| Profitability | Strong net margin of 17.35% and ROIC at 10.49%, slightly favorable profitability despite a declining ROIC trend | Moderate profitability with net margin of 7.57% and ROIC of 9.89%, but overall value destruction indicated by negative ROIC vs WACC |
| Innovation | Consistent investment in advanced technology segments, maintaining competitive edge in precision and medical fields | Innovation less clear; facing decreasing profitability and unfavorable moat status suggests challenges in sustaining competitive advantage |
| Global presence | Global operations reflected in diverse industrial and medical markets | Primarily North American market focus with limited global footprint indicated |
| Market Share | Established market share in multiple industrial niches, benefiting from steady revenue growth | Market share position weaker due to profitability pressures and value erosion |
Key takeaways: Nordson Corporation demonstrates solid diversification and profitability with a slightly favorable moat, despite some decline in ROIC. Generac Holdings struggles with value destruction and declining profitability, indicating higher investment risk. Investors should weigh Nordson’s stable operational base against Generac’s challenges in sustaining growth and profitability.
Risk Analysis
Below is a comparison of key risks for Nordson Corporation (NDSN) and Generac Holdings Inc. (GNRC) based on the most recent data available for 2025 and 2024 respectively.
| Metric | Nordson Corporation (NDSN) | Generac Holdings Inc. (GNRC) |
|---|---|---|
| Market Risk | Beta 1.025 – moderate market volatility | Beta 1.828 – higher market volatility |
| Debt level | Debt-to-Equity 0.69 (neutral), Debt-to-Assets 35.36% (neutral) | Debt-to-Equity 0.59 (neutral), Debt-to-Assets 28.88% (favorable) |
| Regulatory Risk | Moderate, industrial manufacturing with global operations | Moderate, energy products with evolving energy regulations |
| Operational Risk | Industrial machinery complexity, supply chain dependencies | Power generation equipment, seasonal demand fluctuations |
| Environmental Risk | Moderate, manufacturing impact and compliance | Moderate, energy product emissions and sustainability focus |
| Geopolitical Risk | Moderate, global sales exposure | Moderate, global sales exposure and supply chain |
Nordson’s risk is moderated by stable debt levels and diversified industrial exposure, with market risk near average. Generac faces higher market volatility and regulatory risks due to energy sector dynamics, but benefits from lower leverage. The most impactful risks for both are market volatility and operational challenges tied to supply chains and regulatory environments. Both companies remain financially stable, in the safe zone for bankruptcy risk, but investors should monitor energy policy changes affecting Generac closely.
Which Stock to Choose?
Nordson Corporation (NDSN) shows a slightly favorable financial profile with stable income growth, favorable profitability ratios such as a 17.35% net margin and 15.92% ROE, moderate debt levels, and a very favorable overall rating. Its ROIC exceeds WACC by 2.5%, indicating value creation despite a declining trend.
Generac Holdings Inc. (GNRC) has demonstrated favorable income growth with a 6.79% revenue increase and strong recent earnings growth, though its profitability ratios are neutral to moderate, including a 7.57% net margin and 13.04% ROE. The company carries moderate debt and holds a very favorable rating but shows a negative ROIC minus WACC, signaling value destruction.
Considering these factors, investors prioritizing stable profitability and value creation might find NDSN’s profile more aligned with their goals, while those favoring growth potential and recent earnings acceleration could interpret GNRC as attractive despite its value challenges. Both companies carry risks that merit careful evaluation aligned with individual investment profiles.
Disclaimer: Investment carries a risk of loss of initial capital. The past performance is not a reliable indicator of future results. Be sure to understand risks before making an investment decision.
Go Further
I encourage you to read the complete analyses of Nordson Corporation and Generac Holdings Inc. to enhance your investment decisions: