In the dynamic industrial machinery sector, Generac Holdings Inc. and Kadant Inc. stand out as influential players with distinct yet overlapping market footprints. Generac specializes in power generation and energy storage solutions, while Kadant focuses on engineered systems for industrial processing and material handling. Both companies innovate to meet evolving industrial demands, making their comparison essential. Join me as we analyze which company offers the most compelling investment opportunity in 2026.
Table of contents
Companies Overview
I will begin the comparison between Generac Holdings Inc. and Kadant Inc. by providing an overview of these two companies and their main differences.
Generac Holdings Inc. Overview
Generac Holdings Inc. designs, manufactures, and sells power generation equipment, energy storage systems, and related power products for residential, commercial, and industrial markets worldwide. The company’s portfolio includes standby generators, portable generators, outdoor power equipment, and clean energy solutions. Founded in 1959 and headquartered in Waukesha, Wisconsin, Generac serves its customers through a broad distribution network including dealers, retailers, and e-commerce platforms.
Kadant Inc. Overview
Kadant Inc. supplies technologies and engineered systems globally, operating through three segments: Flow Control, Industrial Processing, and Material Handling. Its products include fluid-handling systems, industrial machinery, automation systems, and biodegradable absorbent granules. Founded in 1991 and based in Westford, Massachusetts, Kadant serves industries such as packaging, tissue, wood products, and alternative fuels, focusing on equipment and consumables for specialized industrial processes.
Key similarities and differences
Both Generac and Kadant operate in the industrial machinery sector and serve diverse industrial markets with engineered products. Generac focuses on power generation and energy systems primarily for residential and commercial use, while Kadant specializes in process equipment and systems for industrial manufacturing and material handling. Generac’s products emphasize power solutions and outdoor equipment, whereas Kadant’s offerings center on fluid control, industrial processing, and material handling technologies.
Income Statement Comparison
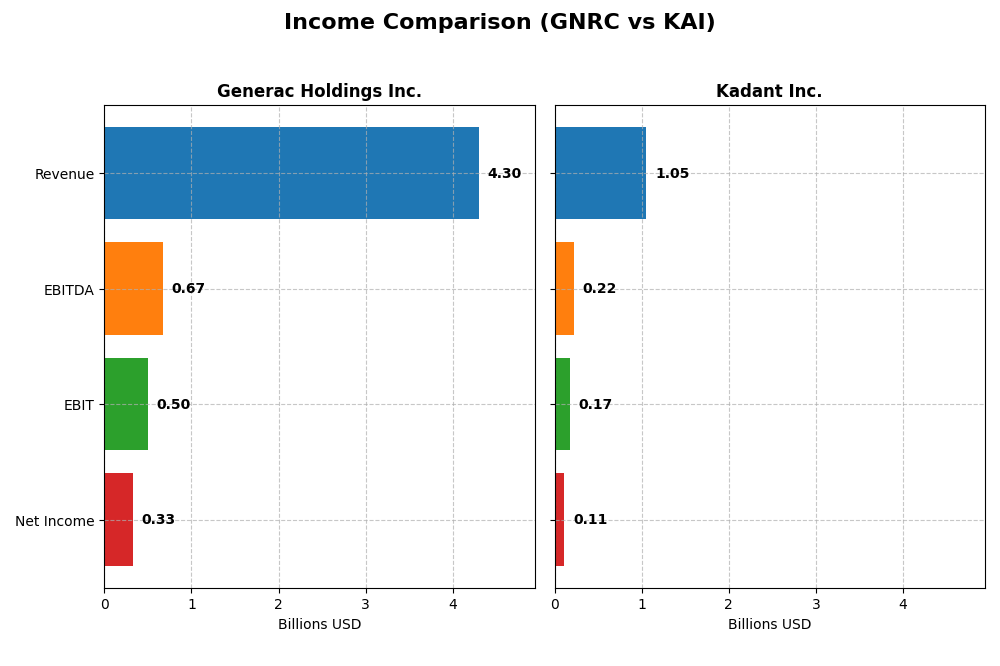
This table compares the key income statement metrics for Generac Holdings Inc. and Kadant Inc. for the most recent fiscal year, 2024.
| Metric | Generac Holdings Inc. (GNRC) | Kadant Inc. (KAI) |
|---|---|---|
| Market Cap | 8.97B | 3.76B |
| Revenue | 4.30B | 1.05B |
| EBITDA | 671M | 223M |
| EBIT | 499M | 173M |
| Net Income | 325M | 112M |
| EPS | 5.46 | 9.51 |
| Fiscal Year | 2024 | 2024 |
Income Statement Interpretations
Generac Holdings Inc.
Generac’s revenue grew by 6.8% in 2024, following a robust 72.9% increase over five years, while net income declined by 6.9% over the same period. Margins remain favorable with a 38.8% gross margin and 7.6% net margin, though net margin and EPS have contracted overall. The latest year saw earnings surge with a 50% rise in net margin and a 65% jump in EPS, signaling improved profitability despite moderate revenue growth.
Kadant Inc.
Kadant demonstrated consistent revenue growth, rising nearly 10% in 2024 and 65.9% over five years. Net income doubled in this timeframe, with net margin improving by 21.9%. Margins are strong, with a 44.3% gross margin and 10.6% net margin in 2024. However, recent net margin and EPS declined slightly by 12.6% and 4.2%, respectively, despite continued revenue gains, suggesting margin pressure in the latest fiscal year.
Which one has the stronger fundamentals?
Both companies exhibit favorable income statement fundamentals with solid margins and growth over the period. Generac’s latest year showed marked profitability improvements but overall net income and margins declined over five years. Kadant’s revenue and net income grew steadily with improving margins long-term, though recent margin contractions pose caution. Kadant’s higher and more stable margins reflect comparatively stronger fundamentals.
Financial Ratios Comparison
The table below presents a side-by-side comparison of key financial ratios for Generac Holdings Inc. (GNRC) and Kadant Inc. (KAI) based on their most recent fiscal year data for 2024.
| Ratios | Generac Holdings Inc. (GNRC) | Kadant Inc. (KAI) |
|---|---|---|
| ROE | 13.0% | 13.2% |
| ROIC | 9.9% | 10.1% |
| P/E | 28.4 | 36.9 |
| P/B | 3.70 | 4.86 |
| Current Ratio | 1.97 | 2.31 |
| Quick Ratio | 0.97 | 1.55 |
| D/E | 0.59 | 0.38 |
| Debt-to-Assets | 28.9% | 22.6% |
| Interest Coverage | 6.0 | 8.6 |
| Asset Turnover | 0.84 | 0.74 |
| Fixed Asset Turnover | 5.01 | 6.18 |
| Payout Ratio | 0.08% | 13.1% |
| Dividend Yield | 0.003% | 0.36% |
Interpretation of the Ratios
Generac Holdings Inc.
Generac’s financial ratios present a mixed picture with a neutral overall stance. While current ratio and interest coverage are favorable, indicating decent liquidity and debt service capacity, valuation metrics like P/E and P/B ratios are unfavorable, suggesting the stock might be overvalued. The company does not pay dividends, reflecting a possible reinvestment strategy or focus on growth.
Kadant Inc.
Kadant exhibits stronger financial ratios overall, with a favorable global evaluation. Key strengths include solid net margin, return on invested capital, and liquidity ratios, alongside a manageable debt level and strong fixed asset turnover. The company pays dividends with a modest yield of 0.36%, balancing shareholder returns with financial stability, despite some unfavorable valuation metrics.
Which one has the best ratios?
Kadant displays a more favorable ratio profile, with a majority of its financial metrics rated positively, reflecting better profitability, liquidity, and capital efficiency. Generac’s ratios are more mixed, with notable weaknesses in valuation and dividend yield. Therefore, Kadant currently holds the advantage in terms of financial ratios.
Strategic Positioning
This section compares the strategic positioning of Generac Holdings Inc. and Kadant Inc., including market position, key segments, and exposure to technological disruption:
Generac Holdings Inc.
- Leading in power generation equipment with strong competitive pressure in industrial machinery.
- Diverse product range: residential, commercial generators, energy storage, and power equipment.
- Exposure to technological disruption through clean energy solutions like PWRcell and remote monitoring.
Kadant Inc.
- Competes in industrial machinery with moderate competitive pressure, focused on engineered systems.
- Focused on Flow Control, Industrial Processing, and Material Handling segments.
- Limited explicit exposure to technological disruption mentioned in flow and material handling systems.
Generac Holdings Inc. vs Kadant Inc. Positioning
Generac’s strategy is diversified across power generation and energy storage, serving multiple markets. Kadant concentrates on engineered systems in specific industrial segments, providing focused but less diversified exposure. Generac’s breadth contrasts with Kadant’s specialized niche approach.
Which has the best competitive advantage?
Kadant shows a slightly favorable moat with growing profitability, indicating improving competitive positioning. Generac displays a very unfavorable moat with declining ROIC, suggesting challenges in sustaining competitive advantage despite diversification.
Stock Comparison
The stock price movements of Generac Holdings Inc. and Kadant Inc. over the past 12 months reveal contrasting trends, with Generac showing significant gains but recent weakening, while Kadant exhibits a longer-term decline with signs of recent recovery.

Trend Analysis
Generac Holdings Inc. experienced a bullish trend over the past year with a 30.27% price increase, though the trend shows deceleration and significant volatility with a 22.61 std deviation. Recent months indicate a bearish correction of -20.41%.
Kadant Inc. posted a bearish trend over the last 12 months with a -5.86% price decrease, but its trend is accelerating amid high volatility (34.44 std deviation). The recent period shows a 9.69% bullish rebound.
Comparing both companies, Generac delivered the highest market performance over the full year despite recent weakness, whereas Kadant’s overall decline was partially offset by recent gains.
Target Prices
The current analyst consensus presents optimistic price targets for both Generac Holdings Inc. and Kadant Inc.
| Company | Target High | Target Low | Consensus |
|---|---|---|---|
| Generac Holdings Inc. | 248 | 184 | 210 |
| Kadant Inc. | 410 | 275 | 342.5 |
Analysts expect Generac’s stock to rise significantly from its current price of $152.78, indicating strong growth potential. Kadant’s targets also suggest upside from its current $319.22, reflecting positive market sentiment.
Analyst Opinions Comparison
This section compares analysts’ ratings and grades for Generac Holdings Inc. and Kadant Inc.:
Rating Comparison
Generac Holdings Inc. Rating
- Rating: B, classified as Very Favorable by analysts.
- Discounted Cash Flow Score: 3, indicating a Moderate level of valuation based on future cash flow projections.
- Return on Equity Score: 4, a Favorable score showing efficient profit generation from shareholders’ equity.
- Return on Assets Score: 4, Favorable, reflecting effective asset utilization to generate earnings.
- Debt To Equity Score: 2, Moderate, indicating moderate financial risk due to debt levels.
- Overall Score: 3, Moderate, summarizing the company’s financial standing.
Kadant Inc. Rating
- Rating: B, also classified as Very Favorable.
- Discounted Cash Flow Score: 3, showing a Moderate valuation level as well.
- Return on Equity Score: 3, a Moderate score for equity profit efficiency.
- Return on Assets Score: 4, also Favorable for asset efficiency.
- Debt To Equity Score: 3, Moderate, suggesting a slightly higher financial leverage.
- Overall Score: 3, Moderate, reflecting a similar overall financial status.
Which one is the best rated?
Both companies share the same overall rating of B and Moderate overall scores. Generac has higher scores in Return on Equity and lower Debt to Equity, suggesting slightly better efficiency and financial risk profile compared to Kadant.
Scores Comparison
Here is a comparison of the Altman Z-Score and Piotroski Score for Generac Holdings Inc. and Kadant Inc.:
Generac Scores
- Altman Z-Score: 3.73, indicating a safe zone for bankruptcy risk.
- Piotroski Score: 7, reflecting strong financial health.
Kadant Scores
- Altman Z-Score: 5.59, indicating a safe zone for bankruptcy risk.
- Piotroski Score: 7, reflecting strong financial health.
Which company has the best scores?
Kadant has a higher Altman Z-Score than Generac, placing it deeper in the safe zone. Both companies share the same Piotroski Score, indicating similar financial strength.
Grades Comparison
Here is the grades comparison for Generac Holdings Inc. and Kadant Inc.:
Generac Holdings Inc. Grades
The table summarizes recent reliable grades from established grading companies for Generac Holdings Inc.:
| Grading Company | Action | New Grade | Date |
|---|---|---|---|
| Baird | Upgrade | Outperform | 2026-01-09 |
| Citigroup | Upgrade | Buy | 2026-01-08 |
| B of A Securities | Maintain | Buy | 2026-01-07 |
| Wells Fargo | Upgrade | Overweight | 2025-12-19 |
| JP Morgan | Upgrade | Overweight | 2025-12-08 |
| Citigroup | Maintain | Neutral | 2025-11-03 |
| Barclays | Maintain | Equal Weight | 2025-10-31 |
| UBS | Maintain | Buy | 2025-10-30 |
| Canaccord Genuity | Maintain | Buy | 2025-10-30 |
| Citigroup | Maintain | Neutral | 2025-10-21 |
Generac shows an upward trend with multiple recent upgrades and a consensus rating of “Buy.”
Kadant Inc. Grades
The table presents reliable grades from recognized grading companies for Kadant Inc.:
| Grading Company | Action | New Grade | Date |
|---|---|---|---|
| Barrington Research | Maintain | Outperform | 2025-10-30 |
| Barrington Research | Maintain | Outperform | 2025-10-29 |
| Barrington Research | Maintain | Outperform | 2025-10-27 |
| Barrington Research | Maintain | Outperform | 2025-10-10 |
| Barrington Research | Maintain | Outperform | 2025-09-23 |
| DA Davidson | Maintain | Neutral | 2025-08-04 |
| Barrington Research | Maintain | Outperform | 2025-07-30 |
| Barrington Research | Maintain | Outperform | 2025-07-29 |
| Barrington Research | Maintain | Outperform | 2025-05-01 |
| DA Davidson | Maintain | Neutral | 2025-05-01 |
Kadant’s grades are stable, predominantly “Outperform,” with a consensus rating of “Hold.”
Which company has the best grades?
Generac Holdings Inc. has received more recent upgrades and a stronger consensus rating (“Buy”) compared to Kadant Inc.’s stable but less positive consensus (“Hold”). This difference may influence investor perception regarding growth potential and risk appetite.
Strengths and Weaknesses
Below is a comparative table summarizing the key strengths and weaknesses of Generac Holdings Inc. (GNRC) and Kadant Inc. (KAI) based on their recent financial performance and market position.
| Criterion | Generac Holdings Inc. (GNRC) | Kadant Inc. (KAI) |
|---|---|---|
| Diversification | Moderate product focus on power systems; less diversified product lines | More diversified with Capital and Parts & Consumables segments contributing steadily |
| Profitability | Neutral net margin at 7.57%; ROIC below WACC indicating value destruction | Higher net margin at 10.59%; ROIC above WACC with growing profitability |
| Innovation | Limited recent innovation reported; declining ROIC trend | Demonstrates innovation with steady growth in ROIC and product development |
| Global presence | Strong in North America with moderate international exposure | Expanding global footprint, especially in industrial segments |
| Market Share | Established market player but facing margin pressure | Growing market share supported by robust financial metrics |
In summary, Kadant shows a slightly favorable competitive position with improving profitability and diversification, whereas Generac struggles with value destruction and declining returns, signaling caution for investors.
Risk Analysis
Below is a comparative table of key risks for Generac Holdings Inc. (GNRC) and Kadant Inc. (KAI) based on the most recent available data (2024-2026):
| Metric | Generac Holdings Inc. (GNRC) | Kadant Inc. (KAI) |
|---|---|---|
| Market Risk | High beta (1.83) indicates elevated volatility and sensitivity to market swings. | Moderate beta (1.25) suggests lower market volatility risk. |
| Debt level | Debt-to-equity ratio moderate at 0.59; manageable leverage. | Lower debt-to-equity ratio at 0.38; stronger balance sheet. |
| Regulatory Risk | Exposure to energy and industrial regulations; moderate risk due to expanding clean energy solutions. | Moderate regulatory exposure in industrial and environmental sectors. |
| Operational Risk | Complex product lines and global distribution increase operational complexity. | Diverse segments but with focused industrial processing and material handling. |
| Environmental Risk | Transition to clean energy products may mitigate environmental risk but also entails adaptation costs. | Involvement with biodegradable products reduces environmental risk. |
| Geopolitical Risk | U.S.-based with global distribution; moderate exposure to trade and geopolitical tensions. | Primarily U.S. operations with some global reach; moderate geopolitical exposure. |
The most impactful and likely risks for GNRC stem from its higher market volatility and operational complexity amid evolving energy regulations. For KAI, debt levels are more conservative, and environmental risk is lower due to its product mix, although market risk remains moderate. Both companies maintain solid financial health, with Altman Z-scores in the safe zone, reducing bankruptcy concerns.
Which Stock to Choose?
Generac Holdings Inc. (GNRC) shows a favorable income statement with 7.57% net margin and positive growth in revenue and EPS over one year, yet its overall net income and margin trends are unfavorable. Financial ratios present a neutral rating, with balanced strengths and weaknesses, moderate debt, and a very favorable overall rating. However, its economic moat is very unfavorable due to declining ROIC below WACC, indicating value destruction.
Kadant Inc. (KAI) demonstrates favorable income metrics, including a 10.59% net margin and strong growth in net income and EPS over the overall period, despite some recent margin contraction. Its financial ratios are mostly favorable, reflecting low debt and strong liquidity, with a slightly favorable moat signaled by increasing ROIC though still below WACC. The company holds a very favorable rating with sound financial scores.
Considering the ratings and income evaluations, KAI might appear more appealing for investors seeking improving profitability and solid financial health, while GNRC could be viewed as riskier given its declining economic moat. Risk-tolerant investors focused on growth might find GNRC’s recent income improvements noteworthy, whereas those prioritizing stability and financial strength may lean toward KAI’s favorable ratios and improving profitability.
Disclaimer: Investment carries a risk of loss of initial capital. The past performance is not a reliable indicator of future results. Be sure to understand risks before making an investment decision.
Go Further
I encourage you to read the complete analyses of Generac Holdings Inc. and Kadant Inc. to enhance your investment decisions: