Generac Holdings Inc. and JBT Marel Corporation are two prominent players in the industrial machinery sector, each carving a niche with distinct product lines and innovation strategies. Generac focuses on power generation and energy storage solutions, while JBT Marel leads in food and beverage processing technologies. Their market overlap and commitment to technological advancement make them compelling candidates for comparison. In this article, I will help you identify which company presents the most attractive investment opportunity.
Table of contents
Companies Overview
I will begin the comparison between Generac Holdings Inc. and JBT Marel Corporation by providing an overview of these two companies and their main differences.
Generac Holdings Inc. Overview
Generac Holdings Inc. designs, manufactures, and sells power generation equipment and energy storage systems for residential, light commercial, and industrial markets worldwide. The company offers a wide range of products including standby generators, portable generators, outdoor power equipment, and clean energy solutions. Founded in 1959 and headquartered in Waukesha, Wisconsin, Generac operates in the industrial machinery sector with a market cap of approximately 8.97B USD.
JBT Marel Corporation Overview
JBT Marel Corporation provides technology solutions primarily to the food and beverage industry across global regions including North America, Europe, and Asia Pacific. Its offerings cover processing, packaging, and material handling systems for diverse markets such as poultry, pharmaceuticals, and fast-moving consumer goods. Incorporated in 1994 and based in Chicago, Illinois, JBT Marel is also in the industrial machinery sector with a market cap near 8.11B USD.
Key similarities and differences
Both companies operate in the industrial machinery sector and serve global markets, yet their business models differ significantly. Generac focuses on power generation and outdoor equipment targeting residential and commercial sectors, while JBT Marel specializes in automation and processing technologies for food, beverage, and health industries. Generac’s product range centers on energy solutions, whereas JBT Marel emphasizes technology-driven processing and packaging systems.
Income Statement Comparison
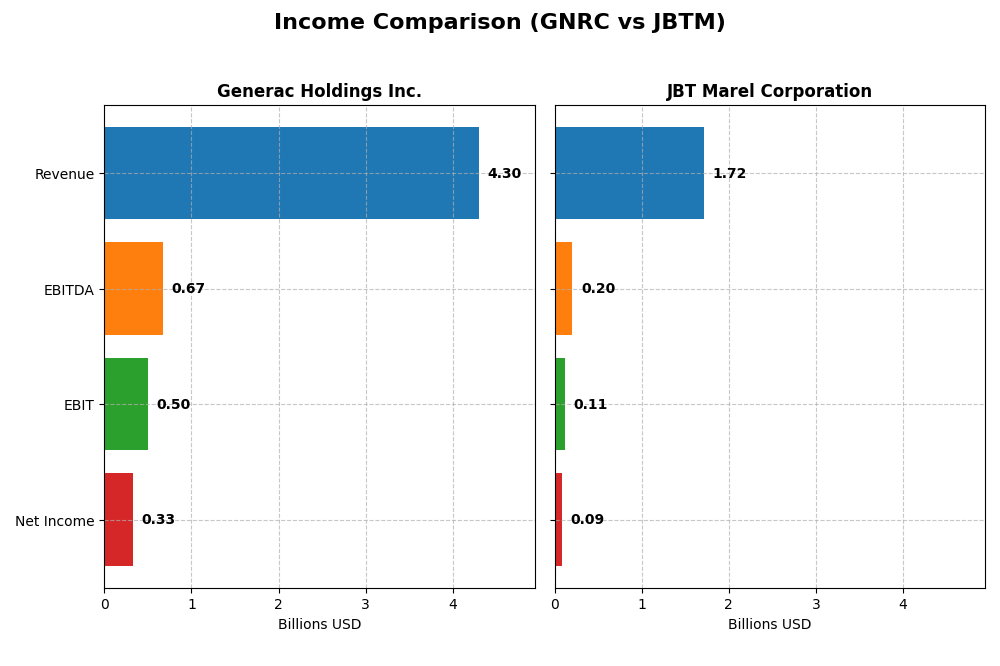
This table presents a factual comparison of key income statement metrics for Generac Holdings Inc. and JBT Marel Corporation based on their most recent fiscal year data for 2024.
| Metric | Generac Holdings Inc. | JBT Marel Corporation |
|---|---|---|
| Market Cap | 8.97B | 8.11B |
| Revenue | 4.30B | 1.72B |
| EBITDA | 671M | 204M |
| EBIT | 499M | 115M |
| Net Income | 325M | 85M |
| EPS | 5.46 | 2.67 |
| Fiscal Year | 2024 | 2024 |
Income Statement Interpretations
Generac Holdings Inc.
Generac’s revenue showed a generally positive trend from 2020 to 2024, increasing from $2.49B to $4.30B, reflecting a 72.9% growth overall. Net income, however, declined by 6.9% over the same period, indicating some margin pressure. In 2024, gross and EBIT margins improved favorably, with net margin growth close to 50%, signaling stronger profitability despite modest revenue growth of 6.8%.
JBT Marel Corporation
JBT Marel’s revenue was relatively flat, dropping slightly by 0.7% from $1.73B in 2020 to $1.72B in 2024. Net income decreased significantly by 21.5%, accompanied by declines in net margin and EPS. The 2024 fiscal year showed a 3.1% revenue increase but sharp deteriorations in EBIT (-35.3%) and net margin (-85.8%), reflecting profitability challenges despite stable gross margins.
Which one has the stronger fundamentals?
Generac demonstrates stronger fundamentals with favorable gross, EBIT, and net margins, supported by double-digit EBIT growth and improved profitability in 2024. In contrast, JBT Marel faces unfavorable trends in net income, margin contraction, and EPS decline over the period, coupled with negative EBIT growth last year. Overall, Generac’s income statement reflects more robust operational performance and margin resilience.
Financial Ratios Comparison
The table below presents the key financial ratios for Generac Holdings Inc. (GNRC) and JBT Marel Corporation (JBTM) based on their most recent fiscal year 2024 data.
| Ratios | Generac Holdings Inc. (GNRC) | JBT Marel Corporation (JBTM) |
|---|---|---|
| ROE | 13.04% | 5.53% |
| ROIC | 9.89% | 3.65% |
| P/E | 28.39 | 47.63 |
| P/B | 3.70 | 2.63 |
| Current Ratio | 1.97 | 3.48 |
| Quick Ratio | 0.97 | 3.04 |
| D/E (Debt to Equity) | 0.59 | 0.81 |
| Debt-to-Assets | 28.88% | 36.68% |
| Interest Coverage | 5.98 | 6.10 |
| Asset Turnover | 0.84 | 0.50 |
| Fixed Asset Turnover | 5.01 | 7.34 |
| Payout Ratio | 0.08% | 15.34% |
| Dividend Yield | 0.003% | 0.32% |
Interpretation of the Ratios
Generac Holdings Inc.
Generac displays a balanced ratio profile with favorable current and debt-to-assets ratios, indicating solid short-term liquidity and moderate leverage. However, valuation metrics like PE and PB ratios are unfavorable, suggesting the stock may be overvalued. The company does not pay dividends, reflecting a possible reinvestment strategy or prioritization of growth and R&D.
JBT Marel Corporation
JBT Marel shows weaker profitability ratios with low net margin, ROE, and ROIC, signaling operational challenges. The cost of capital (WACC) is favorable, but valuation remains stretched with a high PE ratio. The company pays a modest dividend with a low yield, which may burden cash flow; share buybacks or growth investments might be prioritized instead.
Which one has the best ratios?
Generac’s ratios are generally neutral with a good balance of liquidity and leverage but face valuation concerns. JBT Marel’s profitability and valuation ratios are less favorable, despite stronger liquidity measures. Overall, Generac holds a more neutral stance, while JBT Marel’s profile is slightly unfavorable based on the 2024 financial metrics.
Strategic Positioning
This section compares the strategic positioning of Generac Holdings Inc. and JBT Marel Corporation, including Market position, Key segments, and exposure to disruption:
Generac Holdings Inc.
- Strong presence in power generation equipment amid industrial machinery sector competition.
- Diverse product range including residential, commercial, industrial power solutions and outdoor equipment.
- Moderate exposure through integration of clean energy and remote monitoring systems.
JBT Marel Corporation
- Established technology provider for food and beverage processing globally.
- Focused on food processing, packaging, and automated material handling across multiple industries.
- Technology-driven solutions with potential disruption from automation and processing innovation.
Generac Holdings Inc. vs JBT Marel Corporation Positioning
Generac exhibits a more diversified product portfolio across power generation and outdoor equipment, supporting multiple market segments. JBT Marel concentrates on high-tech food and beverage processing solutions, offering specialized industry exposure with broader geographic reach.
Which has the best competitive advantage?
Both companies show very unfavorable MOAT evaluations with declining ROIC trends, indicating value destruction and weak competitive advantages based on capital efficiency and profitability metrics.
Stock Comparison
The stock price movements of Generac Holdings Inc. and JBT Marel Corporation over the past year reveal distinct bullish trends with contrasting recent performance dynamics and trading volume patterns.
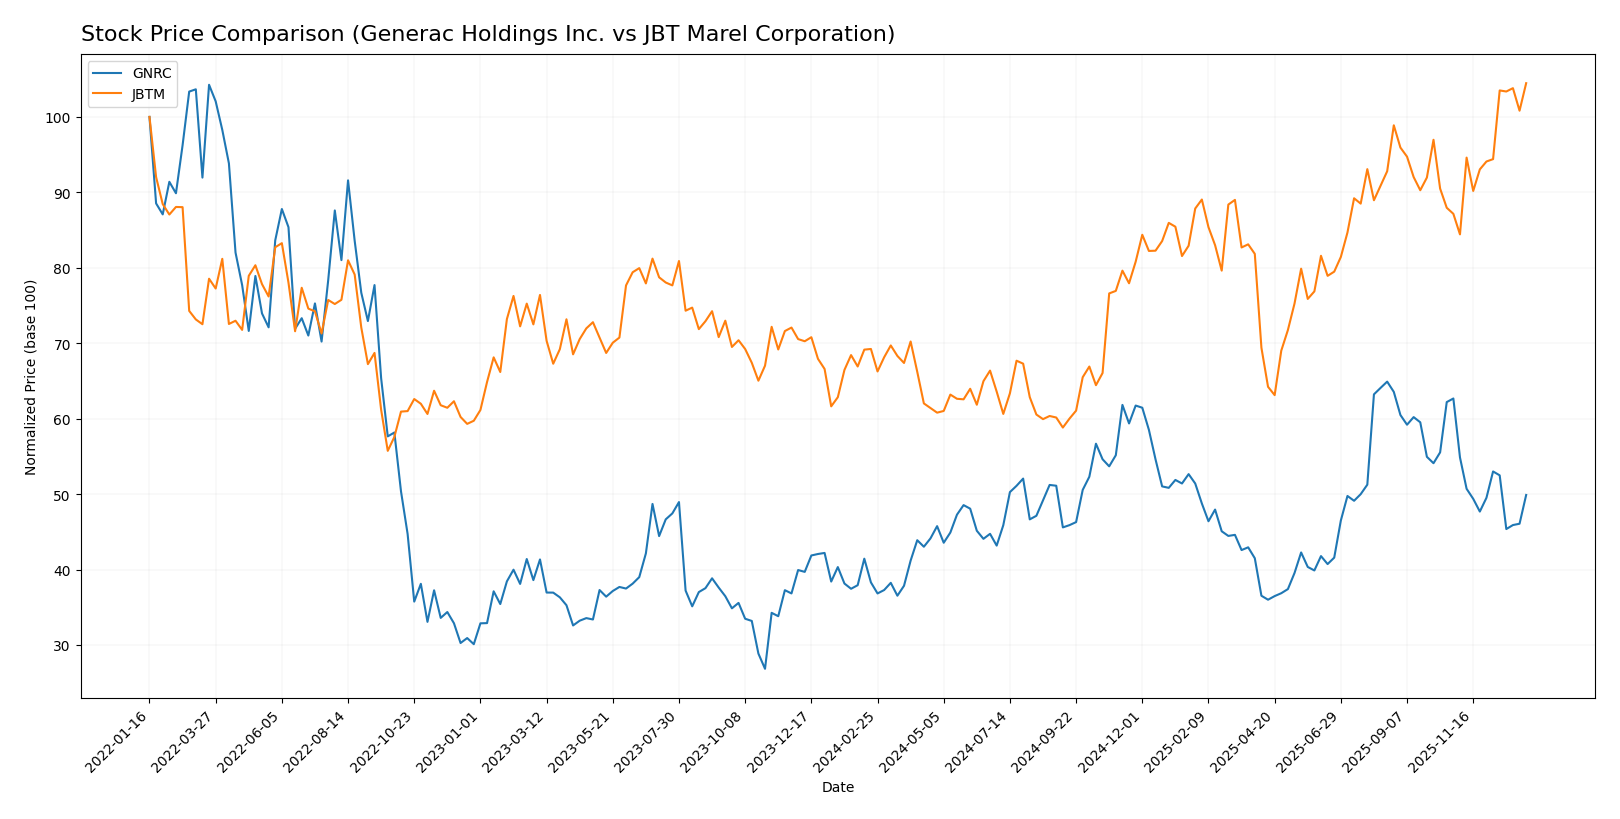
Trend Analysis
Generac Holdings Inc. exhibited a bullish trend over the past 12 months with a 30.27% price increase, though recent months show a decelerating trend and a 20.41% price decline accompanied by seller dominance. JBT Marel Corporation posted a stronger bullish trend with a 50.89% rise, accelerating further recently with a 19.87% gain and increased buyer dominance. Comparing both stocks, JBT Marel Corporation delivered the highest market performance over the year, maintaining momentum while Generac’s trend slowed and reversed recently.
Target Prices
Analysts show a cautiously optimistic consensus on target prices for Generac Holdings Inc. and JBT Marel Corporation.
| Company | Target High | Target Low | Consensus |
|---|---|---|---|
| Generac Holdings Inc. | 248 | 184 | 210 |
| JBT Marel Corporation | 180 | 169 | 174.5 |
The consensus target prices for Generac Holdings Inc. and JBT Marel Corporation are significantly above their current stock prices of $152.78 and $156.04, respectively, indicating expected upside potential.
Analyst Opinions Comparison
This section compares analysts’ ratings and grades for Generac Holdings Inc. and JBT Marel Corporation:
Rating Comparison
GNRC Rating
- Rating: B, considered Very Favorable by analysts.
- Discounted Cash Flow Score: 3, indicating Moderate value based on cash flow projections.
- Return on Equity Score: 4, showing Favorable profit generation efficiency.
- Return on Assets Score: 4, reflecting Favorable asset utilization.
- Debt To Equity Score: 2, a Moderate level of financial risk.
- Overall Score: 3, categorized as Moderate overall financial standing.
JBTM Rating
- Rating: C, also considered Very Favorable.
- Discounted Cash Flow Score: 3, similarly Moderate valuation.
- Return on Equity Score: 1, indicating Very Unfavorable efficiency.
- Return on Assets Score: 1, showing Very Unfavorable asset use.
- Debt To Equity Score: 2, also Moderate financial risk.
- Overall Score: 2, also Moderate but lower than GNRC.
Which one is the best rated?
Based strictly on provided data, GNRC holds a higher overall score and stronger Return on Equity and Assets scores compared to JBTM, which shows weaker profitability metrics despite similar debt levels.
Scores Comparison
Here is a comparison of the financial health scores for Generac Holdings Inc. and JBT Marel Corporation:
GNRC Scores
- Altman Z-Score: 3.73, indicating a safe zone with low bankruptcy risk.
- Piotroski Score: 7, classified as strong financial health.
JBTM Scores
- Altman Z-Score: 1.75, placing the company in the distress zone with high bankruptcy risk.
- Piotroski Score: 2, considered very weak financial health.
Which company has the best scores?
Based on the provided scores, Generac Holdings Inc. has significantly better financial health indicators than JBT Marel Corporation, with a safe zone Altman Z-Score and a strong Piotroski Score, compared to JBTM’s distress zone and very weak Piotroski Score.
Grades Comparison
The grades comparison for Generac Holdings Inc. and JBT Marel Corporation is as follows:
Generac Holdings Inc. Grades
Here are the recent grades assigned to Generac Holdings Inc. by reputable grading companies:
| Grading Company | Action | New Grade | Date |
|---|---|---|---|
| Baird | Upgrade | Outperform | 2026-01-09 |
| Citigroup | Upgrade | Buy | 2026-01-08 |
| B of A Securities | Maintain | Buy | 2026-01-07 |
| Wells Fargo | Upgrade | Overweight | 2025-12-19 |
| JP Morgan | Upgrade | Overweight | 2025-12-08 |
| Citigroup | Maintain | Neutral | 2025-11-03 |
| Barclays | Maintain | Equal Weight | 2025-10-31 |
| UBS | Maintain | Buy | 2025-10-30 |
| Canaccord Genuity | Maintain | Buy | 2025-10-30 |
| Citigroup | Maintain | Neutral | 2025-10-21 |
Generac’s grades show a positive trend with multiple upgrades to Buy, Outperform, and Overweight ratings from major firms.
JBT Marel Corporation Grades
Here are the recent grades assigned to JBT Marel Corporation by reputable grading companies:
| Grading Company | Action | New Grade | Date |
|---|---|---|---|
| Jefferies | Upgrade | Buy | 2025-12-10 |
| William Blair | Upgrade | Outperform | 2025-08-06 |
JBT Marel’s grades indicate recent upgrades, moving from Hold and Market Perform to Buy and Outperform ratings.
Which company has the best grades?
Generac Holdings Inc. has received more numerous and consistent Buy and Outperform grades compared to JBT Marel Corporation, which has fewer but positive upgrades. This broader analyst support for Generac may suggest stronger market confidence, potentially impacting investor sentiment and portfolio decisions.
Strengths and Weaknesses
The table below summarizes the key strengths and weaknesses of Generac Holdings Inc. (GNRC) and JBT Marel Corporation (JBTM) based on recent financial and strategic data.
| Criterion | Generac Holdings Inc. (GNRC) | JBT Marel Corporation (JBTM) |
|---|---|---|
| Diversification | Moderate, focused on power generation | Moderate, focused on industrial tech |
| Profitability | Neutral net margin (7.57%), ROIC below WACC, shedding value | Unfavorable net margin (4.98%), ROIC below WACC, shedding value |
| Innovation | Moderate fixed asset turnover (5.01), some operational efficiency | High fixed asset turnover (7.34), good innovation efficiency |
| Global presence | Strong, reflected in asset turnover and debt management | Strong, but less efficient asset use noted |
| Market Share | Stable, but challenged by declining ROIC and high valuation (PE 28.39) | Smaller market share, higher valuation (PE 47.63), declining profitability |
Key takeaways: Both companies face challenges with profitability and value creation, showing declining ROIC trends and unfavorable economic moats. Generac shows better liquidity and debt management, while JBT Marel demonstrates higher operational efficiency but struggles more with margins and valuation. Caution is advised when considering these stocks for investment.
Risk Analysis
The table below summarizes key risks for Generac Holdings Inc. (GNRC) and JBT Marel Corporation (JBTM) based on their latest financial and operational profiles from 2024.
| Metric | Generac Holdings Inc. (GNRC) | JBT Marel Corporation (JBTM) |
|---|---|---|
| Market Risk | High beta (1.83) indicates higher volatility and sensitivity to market swings | Moderate beta (1.00), closer to market average volatility |
| Debt level | Moderate debt-to-assets (28.9%), interest coverage favorable at 5.56x | Higher debt-to-assets (36.7%), interest coverage favorable at 5.92x |
| Regulatory Risk | Moderate, subject to industrial and energy equipment regulations | Moderate, with exposure to global food safety and manufacturing standards |
| Operational Risk | Neutral asset turnover, diverse product lines reduce risk | Lower asset turnover (0.5), complexity of global operations increases risk |
| Environmental Risk | Exposure to energy and emissions regulations, growing clean energy focus | Exposure through food processing and packaging environmental impact |
| Geopolitical Risk | Primarily US-based but with global sales; moderate exposure | Global footprint across multiple continents increases geopolitical risk |
In synthesis, Generac faces higher market volatility risk due to its beta and slightly better debt management, while JBTM exhibits signs of financial distress indicated by its low Altman Z-score (1.75) and weak Piotroski score (2), suggesting higher bankruptcy risk. Generac’s product diversification and stronger financial stability make it less risky overall, whereas JBTM’s global operations and weaker profitability metrics increase its operational and geopolitical uncertainties. Investors should weigh these factors carefully against their risk tolerance.
Which Stock to Choose?
Generac Holdings Inc. (GNRC) shows a favorable income statement with strong gross and EBIT margins and positive revenue growth of 6.79% in 2024. Its financial ratios are balanced with some favorable metrics, including a current ratio of 1.97 and moderate debt levels, though valuation ratios like P/E are less attractive. The company’s rating is very favorable (B), supported by solid scores and a safe-zone Altman Z-Score, despite a very unfavorable MOAT due to declining ROIC below WACC.
JBT Marel Corporation (JBTM) presents an unfavorable income evolution overall, with declining revenue and profitability metrics and weaker financial ratios, including lower returns and a higher P/E. Its rating is less favorable (C), with very weak Piotroski and Altman scores indicating financial distress. However, JBTM maintains a low net debt to EBITDA ratio and some favorable liquidity ratios, though its MOAT is also very unfavorable with a declining ROIC.
For investors prioritizing financial stability and a favorable income statement, GNRC might appear more attractive given its better margins, rating, and scores despite some valuation concerns. Conversely, those with a higher risk tolerance interested in growth potential might see JBTM’s recent price acceleration and lower debt as opportunities, though its financial health signals caution. The choice could depend on the investor’s risk profile and preference for stability versus potential growth.
Disclaimer: Investment carries a risk of loss of initial capital. The past performance is not a reliable indicator of future results. Be sure to understand risks before making an investment decision.
Go Further
I encourage you to read the complete analyses of Generac Holdings Inc. and JBT Marel Corporation to enhance your investment decisions: