Home > Comparison > Industrials > IR vs GNRC
The strategic rivalry between Ingersoll Rand Inc. and Generac Holdings Inc. shapes the Industrial Machinery sector’s evolution. Ingersoll Rand operates as a diversified industrial technologies powerhouse with broad global reach. Generac focuses on power generation and energy storage, targeting residential and light commercial markets with innovation-driven solutions. This analysis pits industrial diversification against specialized growth to identify which path offers superior risk-adjusted returns for a resilient, diversified portfolio.
Table of contents
Companies Overview
Ingersoll Rand and Generac Holdings stand as key players in the industrial machinery market with distinct market footprints.
Ingersoll Rand Inc.: Industrial Powerhouse with Diverse Technology Portfolio
Ingersoll Rand dominates in industrial machinery, generating revenue from air, fluid, and energy technologies. It focuses on mission-critical equipment across varied sectors, including medical and agriculture. In 2026, its strategy centers on expanding precision and science technologies to deepen market penetration and enhance aftermarket services.
Generac Holdings Inc.: Leader in Power Generation Solutions
Generac specializes in power generation equipment for residential and commercial markets. It drives revenue through generators, energy storage, and outdoor power products. Its 2026 strategy emphasizes clean energy solutions and smart monitoring systems to capture growing demand for reliable backup and sustainable power.
Strategic Collision: Similarities & Divergences
Both companies compete in industrial machinery yet differ in focus: Ingersoll Rand targets broad industrial applications, while Generac pursues energy resilience and clean tech. The battle for market share unfolds in power and energy services. Their investment profiles contrast sharply—Ingersoll Rand offers diversified industrial exposure, Generac leans on innovation in energy and residential power.
Income Statement Comparison
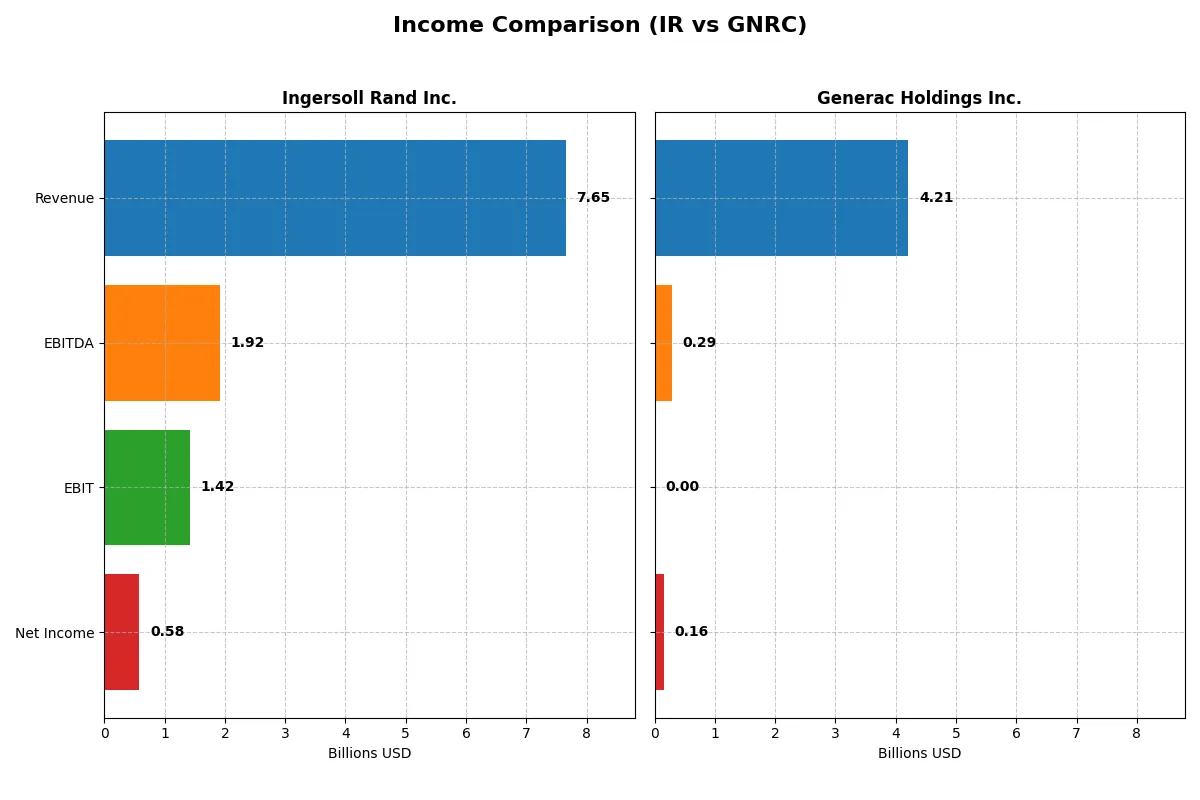
This data dissects the core profitability and scalability of both corporate engines to reveal who dominates the bottom line:
| Metric | Ingersoll Rand Inc. (IR) | Generac Holdings Inc. (GNRC) |
|---|---|---|
| Revenue | 7.65B | 4.21B |
| Cost of Revenue | 4.70B | 2.60B |
| Operating Expenses | 1.53B | 1.32B |
| Gross Profit | 2.95B | 1.61B |
| EBITDA | 1.92B | 289M |
| EBIT | 1.42B | 0 |
| Interest Expense | 254M | 71M |
| Net Income | 581M | 160M |
| EPS | 1.46 | 2.73 |
| Fiscal Year | 2025 | 2025 |
Income Statement Analysis: The Bottom-Line Duel
This income statement comparison reveals which company runs the more efficient and profitable corporate engine in 2025.
Ingersoll Rand Inc. Analysis
Ingersoll Rand shows steady revenue growth from 5.15B in 2021 to 7.65B in 2025, with net income peaking at 839M in 2024 before declining to 581M in 2025. Its gross margin remains healthy around 38.5%, while net margin dipped to 7.6% in 2025. Despite a slight profit contraction last year, operational efficiency and favorable interest expense underpin solid momentum.
Generac Holdings Inc. Analysis
Generac’s revenue grew moderately from 3.74B in 2021 to 4.3B in 2024 but slipped 2% to 4.21B in 2025. Net income dropped sharply from 533M in 2021 to 160M in 2025, halving its net margin to 3.8%. Gross margin holds near 38%, but EBIT margin collapsed to zero in 2025, signaling significant operational challenges and eroding profitability.
Margin Strength vs. Profit Stability
Ingersoll Rand clearly outperforms Generac in profitability and margin resilience. IR’s consistent gross and net margins, coupled with positive net income growth over five years, contrast with GNRC’s steep earnings decline and margin erosion. For investors prioritizing stable profits and operational efficiency, Ingersoll Rand presents the stronger fundamental profile.
Financial Ratios Comparison
These vital ratios act as a diagnostic tool to expose the underlying fiscal health, valuation premiums, and capital efficiency of the companies analyzed:
| Ratios | Ingersoll Rand Inc. (IR) | Generac Holdings Inc. (GNRC) |
|---|---|---|
| ROE | 5.8% | 13.0% |
| ROIC | 6.4% | 9.9% |
| P/E | 54.2 | 50.0 |
| P/B | 3.1 | 3.7 |
| Current Ratio | 2.06 | 1.97 |
| Quick Ratio | 1.49 | 0.97 |
| D/E | 0.47 | 0.59 |
| Debt-to-Assets | 26.1% | 28.9% |
| Interest Coverage | 5.58 | 5.98 |
| Asset Turnover | 0.42 | 0.84 |
| Fixed Asset Turnover | 8.22 | 5.01 |
| Payout ratio | 5.5% | 0.18% |
| Dividend yield | 0.10% | 0.004% |
| Fiscal Year | 2025 | 2025 |
Efficiency & Valuation Duel: The Vital Signs
Financial ratios act as a company’s DNA, exposing hidden risks and revealing operational strengths and weaknesses.
Ingersoll Rand Inc.
Ingersoll Rand shows modest profitability with a 5.76% ROE and a neutral 7.6% net margin. Its valuation appears stretched, highlighted by a high 54.2 P/E and a 3.13 P/B ratio. The firm returns minimal dividends (0.1% yield) and seems to prioritize balance sheet strength over aggressive shareholder payouts.
Generac Holdings Inc.
Generac suffers from zero ROE and ROIC, signaling profitability challenges, alongside a low 3.8% net margin. Its P/E of 50.0 also flags an expensive valuation, while its zero dividend yield and unfavorable liquidity ratios raise concerns. Generac’s capital structure appears less transparent, with several key metrics unavailable or unfavorable.
Premium Valuation vs. Operational Safety
Ingersoll Rand offers a better balance of operational safety and valuation discipline despite stretched multiples. Generac’s lack of profitability and incomplete ratios heighten risk. Investors favoring steady, measured returns might lean toward Ingersoll Rand, while those seeking turnaround potential face greater uncertainty with Generac.
Which one offers the Superior Shareholder Reward?
I observe that Ingersoll Rand (IR) maintains a modest dividend yield near 0.10%, with a low payout ratio around 5%, reflecting strong free cash flow coverage above 89%. IR complements dividends with disciplined buybacks, enhancing total shareholder return sustainably. Conversely, Generac (GNRC) pays a negligible dividend under 0.01% and shows minimal payout ratios but prioritizes reinvestment, evidenced by higher capex and variable free cash flow. GNRC’s buyback activity is less consistent, raising sustainability concerns. I conclude IR offers a superior total return profile in 2026 due to balanced income and capital return, underpinned by robust cash flow and prudent capital allocation.
Comparative Score Analysis: The Strategic Profile
The radar chart reveals the fundamental DNA and trade-offs of both Ingersoll Rand Inc. and Generac Holdings Inc., highlighting their financial strengths and weaknesses:
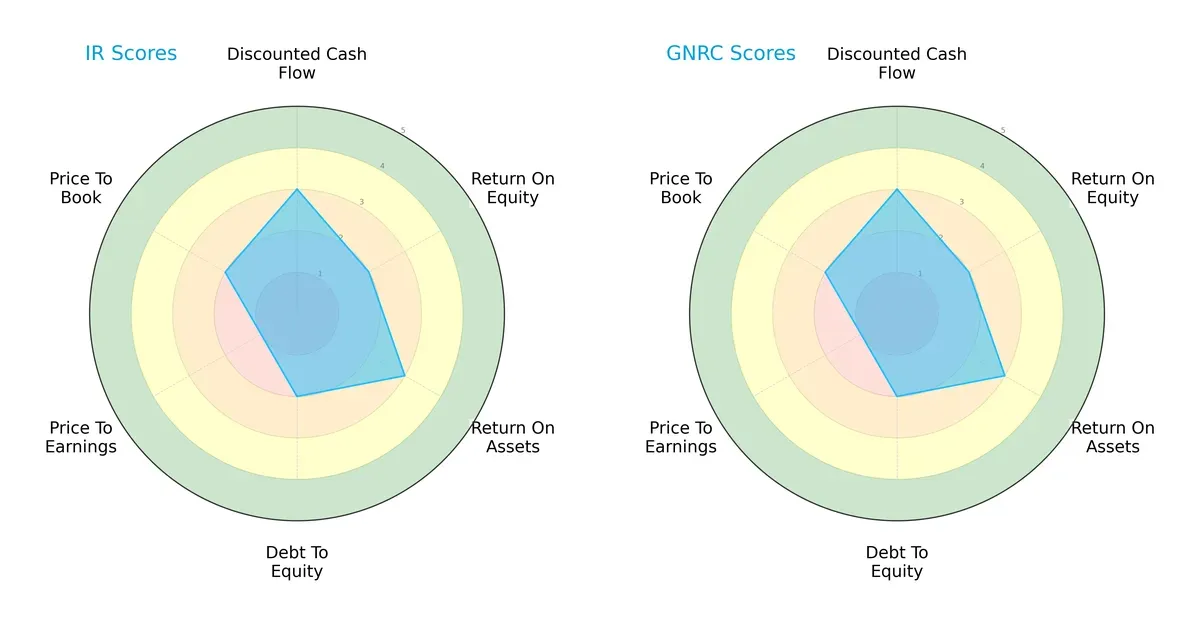
Both companies share identical scores across DCF (3), ROE (2), ROA (3), Debt/Equity (2), and Valuation metrics (PE:1, PB:2). This symmetry indicates neither firm holds a distinct strategic edge. Their profiles reflect moderate cash flow prospects but challenged profitability and leverage metrics, suggesting balanced yet cautious investment cases without a standout advantage.
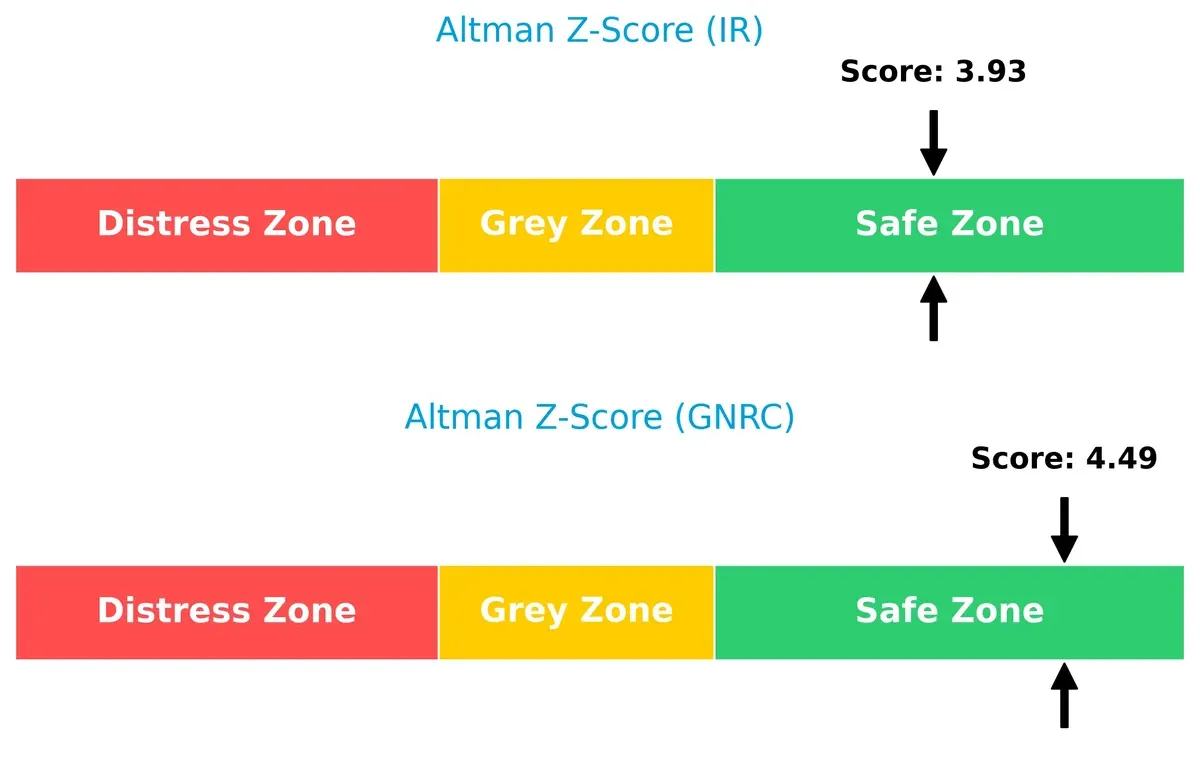
Bankruptcy Risk: Solvency Showdown
The Altman Z-Scores show Generac Holdings (4.49) slightly outperforms Ingersoll Rand (3.93), both comfortably in the safe zone, implying strong solvency and low bankruptcy risk through this cycle:
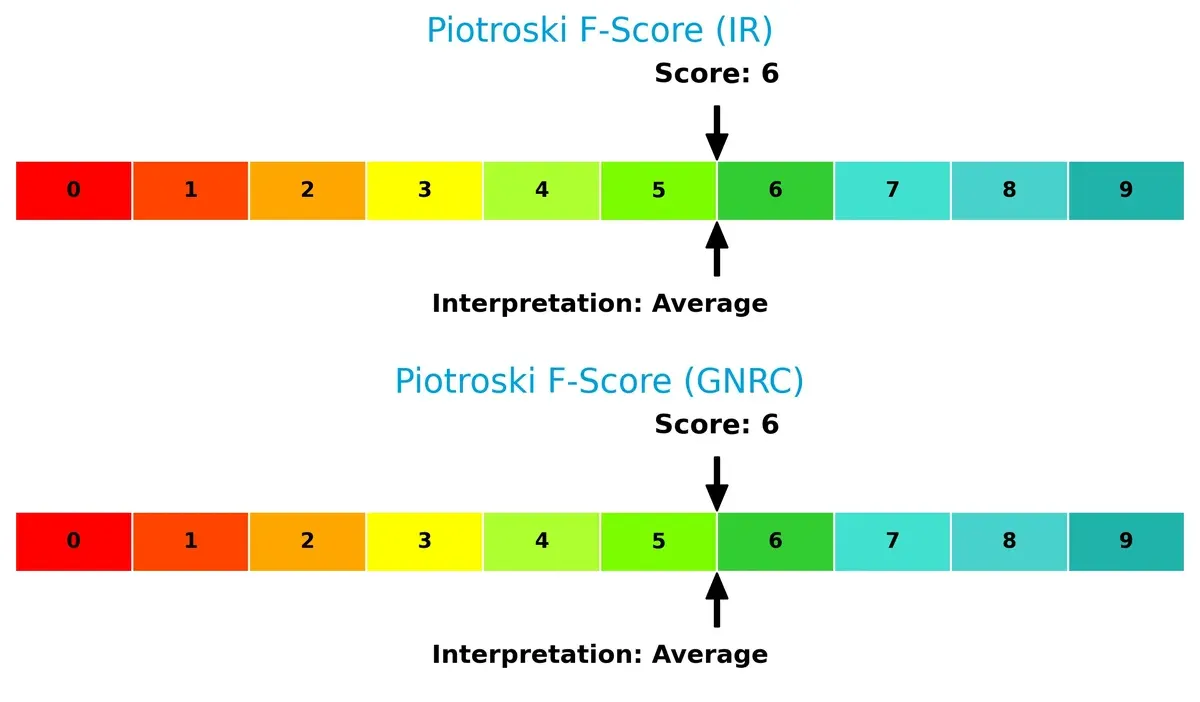
Financial Health: Quality of Operations
Both companies score a 6 on the Piotroski F-Score, indicating average financial health with no glaring red flags. This parity suggests neither firm currently exhibits superior operational quality or internal financial controls:
How are the two companies positioned?
This section dissects the operational DNA of IR and GNRC by comparing their revenue distribution by segment alongside their internal strengths and weaknesses. The goal is to confront their economic moats and determine which model delivers the most resilient, sustainable competitive advantage today.
Revenue Segmentation: The Strategic Mix
This visual comparison dissects how Ingersoll Rand and Generac diversify their income streams and where their primary sector bets lie:
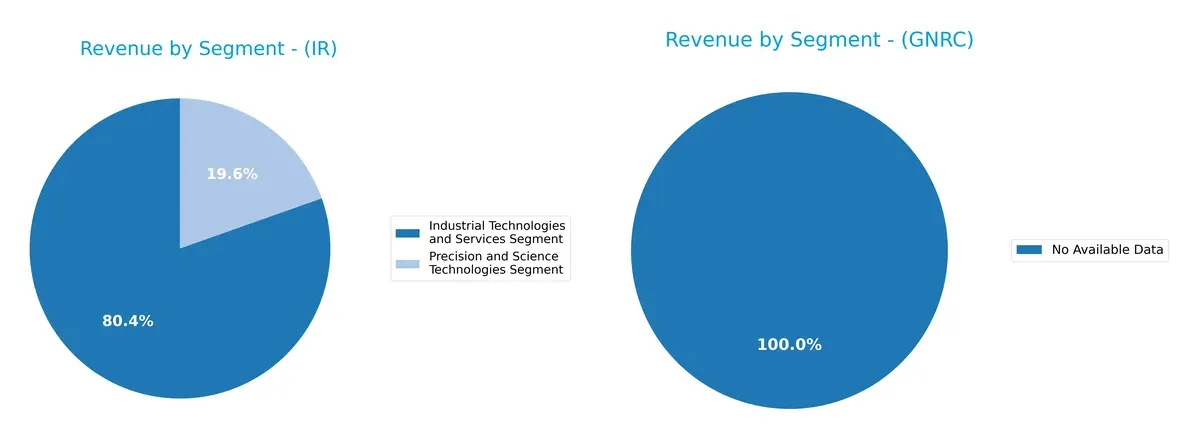
Ingersoll Rand leans heavily on its Industrial Technologies and Services segment, generating $5.8B in 2024, dwarfing its $1.4B Precision and Science Technologies segment. This concentration anchors its strategy in industrial infrastructure, implying strength but also concentration risk. Generac lacks available segmentation data, preventing direct comparison. Ingersoll Rand’s focused mix suggests ecosystem lock-in but less diversification than ideal in volatile markets.
Strengths and Weaknesses Comparison
This table compares the strengths and weaknesses of Ingersoll Rand Inc. (IR) and Generac Holdings Inc. (GNRC):
IR Strengths
- Diversified revenue streams across Industrial Technologies and Precision segments
- Strong geographic presence in Americas, Asia Pacific, and EMEA
- Favorable liquidity ratios: current ratio 2.06, quick ratio 1.49
- Low leverage with debt-to-assets at 26.15%
- Positive interest coverage at 5.58
GNRC Strengths
- Favorable price-to-book ratio indicating undervaluation
- Low debt levels with debt-to-assets at 0%
- No leverage risk as debt/equity ratio stands at 0%
- Some retained capital flexibility due to low debt
IR Weaknesses
- Unfavorable return on equity at 5.76%, below WACC of 9.2%
- High price-to-earnings ratio at 54.24, implying expensive valuation
- Low net margin at 7.6%, only neutral profitability
- Asset turnover low at 0.42, indicating suboptimal asset use
- Minimal dividend yield at 0.1%
GNRC Weaknesses
- Poor profitability metrics with zero net margin, ROE, and ROIC
- Unfavorable liquidity ratios: current and quick ratios at 0
- Negative interest coverage indicating financial distress
- High percentage of unfavorable financial ratios (71.43%)
- No revenue diversification data available
Ingersoll Rand shows solid diversification, liquidity, and geographic reach but struggles with profitability and valuation metrics. Generac exhibits financial weakness, lack of profitability, and liquidity concerns, though it maintains low leverage. These contrasts highlight strategic challenges and financial health differences between the two firms.
The Moat Duel: Analyzing Competitive Defensibility
A structural moat is the only reliable shield protecting long-term profits from relentless competition erosion. Let’s dissect the competitive fortresses of Ingersoll Rand and Generac:
Ingersoll Rand Inc.: Diversified Industrial Intangible Asset Moat
Ingersoll Rand leverages strong intangible assets across industrial and precision technologies, reflected in stable 18.5% EBIT margins and growing ROIC despite slight value erosion. Expansion in Asia Pacific and EMEA deepens its moat into 2026.
Generac Holdings Inc.: Residential Power Generation Network Moat
Generac’s moat hinges on network effects in residential power solutions. Yet, its declining ROIC trend and zero EBIT margin reveal weakening defensibility. Market disruptions and clean energy pivots present risks and growth opportunities alike.
Industrial Intangibles vs. Residential Networks: Which Moat Holds Stronger?
Ingersoll Rand’s broader industrial footprint and improving profitability suggest a deeper moat than Generac’s narrowing residential network. I see Ingersoll Rand better equipped to defend market share amid evolving industrial demands.
Which stock offers better returns?
Over the past year, both stocks showed significant price appreciation, with Generac Holdings far outpacing Ingersoll Rand, reflecting strong buyer dominance and accelerated upward momentum.
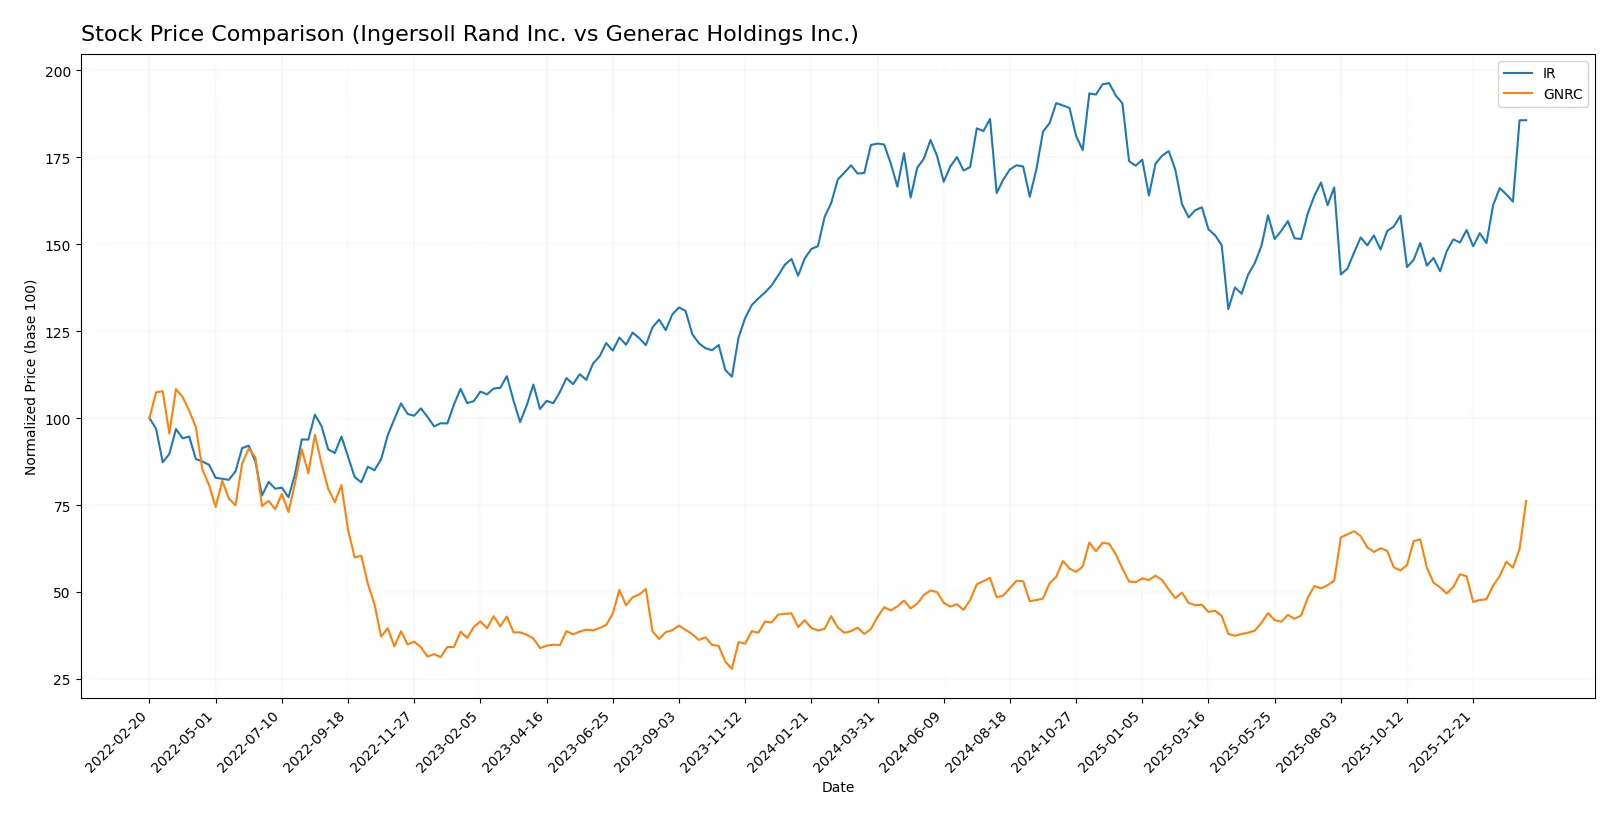
Trend Comparison
Ingersoll Rand’s stock rose 4.0% over 12 months, showing a bullish trend with accelerating gains and a moderate volatility of 8.19%. The price ranged between 69.7 and 104.17.
Generac Holdings surged 93.6% in the same period, marking a strong bullish trend with acceleration and higher volatility of 22.77%. Its price fluctuated from 110.25 to 224.45.
Generac’s stock delivered substantially higher returns and stronger momentum than Ingersoll Rand, dominating the market performance over the past year.
Target Prices
Analysts present a clear bullish consensus for Ingersoll Rand Inc. and Generac Holdings Inc.
| Company | Target Low | Target High | Consensus |
|---|---|---|---|
| Ingersoll Rand Inc. | 87 | 100 | 93 |
| Generac Holdings Inc. | 195 | 292 | 238.89 |
Ingersoll Rand’s target consensus of 93 slightly undercuts its current price near 98.5, suggesting a possible modest pullback. Generac’s consensus target of 239 exceeds its current 224.45 price, indicating analyst optimism for further upside.

Don’t Let Luck Decide Your Entry Point
Optimize your entry points with our advanced ProRealTime indicators. You’ll get efficient buy signals with precise price targets for maximum performance. Start outperforming now!
How do institutions grade them?
Ingersoll Rand Inc. Grades
Here are the recent grades assigned to Ingersoll Rand Inc. by major institutions:
| Grading Company | Action | New Grade | Date |
|---|---|---|---|
| Stifel | Maintain | Hold | 2026-01-23 |
| Citigroup | Maintain | Buy | 2026-01-12 |
| Wells Fargo | Maintain | Overweight | 2026-01-07 |
| Stifel | Maintain | Hold | 2025-12-16 |
| Citigroup | Maintain | Buy | 2025-12-08 |
| Citigroup | Maintain | Buy | 2025-11-03 |
| Baird | Maintain | Outperform | 2025-11-03 |
| Stifel | Maintain | Hold | 2025-10-20 |
| Wells Fargo | Maintain | Overweight | 2025-10-06 |
| Morgan Stanley | Maintain | Equal Weight | 2025-08-13 |
Generac Holdings Inc. Grades
These are the latest grades for Generac Holdings Inc. as evaluated by various firms:
| Grading Company | Action | New Grade | Date |
|---|---|---|---|
| Barclays | Maintain | Equal Weight | 2026-02-13 |
| Wells Fargo | Maintain | Overweight | 2026-02-12 |
| Guggenheim | Downgrade | Neutral | 2026-02-12 |
| Guggenheim | Maintain | Buy | 2026-02-10 |
| Barclays | Maintain | Equal Weight | 2026-01-20 |
| Canaccord Genuity | Maintain | Buy | 2026-01-13 |
| Baird | Upgrade | Outperform | 2026-01-09 |
| Citigroup | Upgrade | Buy | 2026-01-08 |
| B of A Securities | Maintain | Buy | 2026-01-07 |
| Wells Fargo | Upgrade | Overweight | 2025-12-19 |
Which company has the best grades?
Generac Holdings Inc. shows a stronger upgrade trend with multiple recent upgrades to Outperform and Buy. Ingersoll Rand maintains steady Buy and Hold ratings. Investors might see Generac as having more upward momentum in analyst sentiment.
Risks specific to each company
The following categories identify critical pressure points and systemic threats facing both firms in the 2026 market environment:
1. Market & Competition
Ingersoll Rand Inc.
- Operates in diverse industrial segments with strong brand portfolio but faces intense global machinery competition.
Generac Holdings Inc.
- Focused on power generation and energy storage, highly exposed to residential and commercial market cyclicality.
2. Capital Structure & Debt
Ingersoll Rand Inc.
- Maintains moderate leverage (D/E 0.47) with healthy interest coverage (5.58x), indicating solid debt management.
Generac Holdings Inc.
- Displays negligible debt reported but negative interest coverage and financial ratios suggest potential liquidity issues.
3. Stock Volatility
Ingersoll Rand Inc.
- Beta of 1.31 implies moderate sensitivity to market swings, reflecting relative stability in cyclicals.
Generac Holdings Inc.
- Beta of 1.81 signals higher volatility and greater risk exposure to market fluctuations.
4. Regulatory & Legal
Ingersoll Rand Inc.
- Operates globally, exposed to varied regulatory environments but with solid compliance track record.
Generac Holdings Inc.
- Faces regulatory scrutiny in energy storage and emissions standards, with evolving compliance costs.
5. Supply Chain & Operations
Ingersoll Rand Inc.
- Complex supply chain across multiple regions; operational scale aids resilience but geopolitical tensions pose risks.
Generac Holdings Inc.
- More concentrated supply chain; reliant on specialized components with risks from supply disruptions.
6. ESG & Climate Transition
Ingersoll Rand Inc.
- Invests in energy-efficient technologies; faces pressure to meet rising ESG standards in industrial sectors.
Generac Holdings Inc.
- Growing focus on clean energy solutions (PWRcell), but transition risks and capital intensity remain challenges.
7. Geopolitical Exposure
Ingersoll Rand Inc.
- Broad geographic footprint reduces country-specific risk but increases exposure to global trade tensions.
Generac Holdings Inc.
- Primarily US-based operations limit international risks but heighten vulnerability to domestic policy shifts.
Which company shows a better risk-adjusted profile?
Ingersoll Rand’s primary risk lies in cyclical market competition and moderate leverage, but strong liquidity and diversified operations mitigate these threats. Generac confronts critical liquidity and operational risks, amplified by high stock volatility and lack of clear debt management. I observe Ingersoll Rand offers a superior risk-adjusted profile, supported by a safer Altman Z-Score and more balanced financial ratios. Generac’s negative interest coverage and zero current ratios raise significant red flags amid a volatile market environment.
Final Verdict: Which stock to choose?
Ingersoll Rand Inc. stands out with its robust operational efficiency and solid liquidity, reflecting a reliable cash machine in industrial equipment. Its slight value destruction, indicated by ROIC trailing WACC, is a point of vigilance. This stock suits investors seeking stable income with moderate growth, fitting a core or conservative growth portfolio.
Generac Holdings Inc. leverages a strategic moat rooted in its resilient brand and recurring aftermarket demand, which underpins its revenue base. Despite weaker profitability and a declining ROIC trend, it offers more aggressive growth potential with notably volatile price action. This stock fits growth-at-a-reasonable-price (GARP) investors comfortable with higher risk.
If you prioritize steady cash generation and operational resilience, Ingersoll Rand is the compelling choice due to its favorable liquidity and improving profitability trends. However, if you seek higher growth with a tolerance for earnings volatility, Generac offers superior upside potential, albeit with weaker margin stability and financial metrics.
Disclaimer: Investment carries a risk of loss of initial capital. The past performance is not a reliable indicator of future results. Be sure to understand risks before making an investment decision.
Go Further
I encourage you to read the complete analyses of Ingersoll Rand Inc. and Generac Holdings Inc. to enhance your investment decisions: