In the dynamic world of software infrastructure, Gen Digital Inc. and Wix.com Ltd. stand out as influential players driving innovation. Gen Digital specializes in cybersecurity solutions, while Wix.com excels in cloud-based website development platforms. Their overlapping focus on empowering digital experiences makes them ideal candidates for comparison. In this article, I will analyze both companies to help you decide which one holds the most promising investment potential.
Table of contents
Companies Overview
I will begin the comparison between Gen Digital Inc. and Wix.com Ltd. by providing an overview of these two companies and their main differences.
Gen Digital Inc. Overview
Gen Digital Inc. provides cybersecurity solutions aimed at protecting consumers across multiple regions including the US, Europe, and Asia Pacific. The company’s offerings include Norton 360, LifeLock identity protection, VPN services, and privacy tools designed to safeguard devices and personal information from online threats. Founded in 1982 and based in Tempe, Arizona, Gen Digital operates within the software infrastructure industry with a market cap of approximately 16.1B USD.
Wix.com Ltd. Overview
Wix.com Ltd. develops a cloud-based platform that allows users worldwide to create websites and web applications with drag-and-drop tools and AI-driven features. Its product suite includes website editors, payment solutions, customer engagement tools, and a marketplace for applications. Incorporated in 2006 and headquartered in Tel Aviv, Israel, Wix serves over 222M registered users and holds a market cap near 4.5B USD in the software infrastructure sector.
Key similarities and differences
Both Gen Digital and Wix operate in the technology sector focusing on software infrastructure, but their business models target different needs: Gen Digital emphasizes cybersecurity and privacy protection services, while Wix focuses on website creation and digital business tools. Gen Digital’s customer base is primarily consumers seeking cyber safety, whereas Wix caters to individuals and businesses requiring online presence and commerce solutions. Their global reach and market caps also differ, reflecting their distinct market positions.
Income Statement Comparison
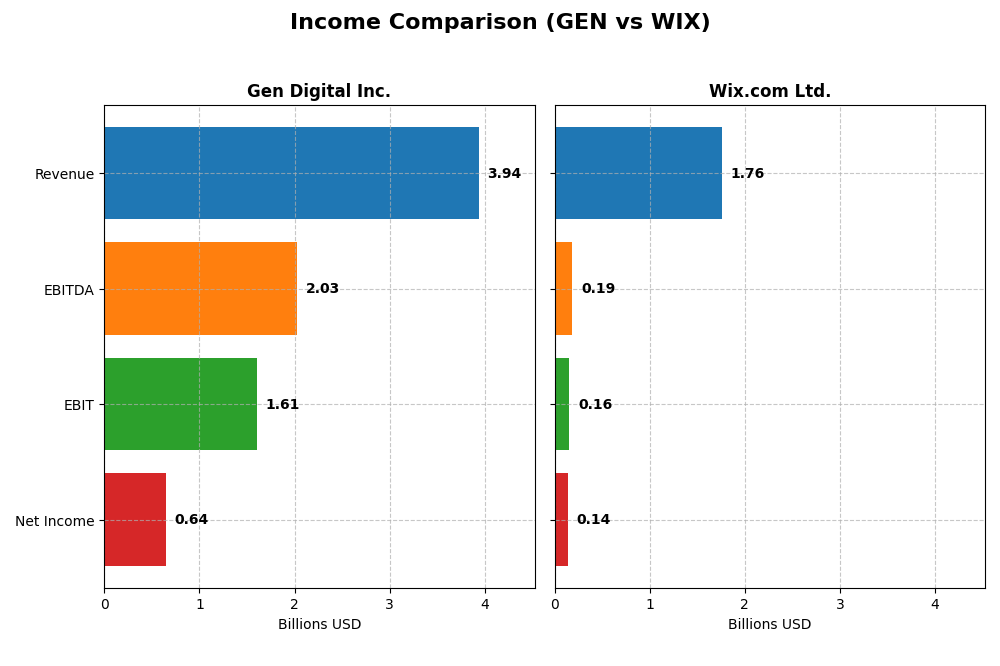
This table presents a side-by-side comparison of key income statement metrics for the most recent fiscal year of Gen Digital Inc. and Wix.com Ltd., providing a clear view of their financial performance.
| Metric | Gen Digital Inc. (GEN) | Wix.com Ltd. (WIX) |
|---|---|---|
| Market Cap | 16.1B | 4.5B |
| Revenue | 3.94B | 1.76B |
| EBITDA | 2.03B | 186M |
| EBIT | 1.61B | 155M |
| Net Income | 643M | 138M |
| EPS | 1.04 | 2.49 |
| Fiscal Year | 2025 | 2024 |
Income Statement Interpretations
Gen Digital Inc.
Gen Digital Inc. exhibited steady revenue growth from $2.55B in 2021 to $3.94B in 2025, with net income fluctuating but ultimately rising from $554M to $643M. Gross and EBIT margins remained favorable, around 80% and 41% respectively, though interest expenses were high at nearly 15%. The latest year showed moderate revenue growth of 3.55% and a strong 44% EBIT increase, indicating improved operational efficiency.
Wix.com Ltd.
Wix.com Ltd. demonstrated significant revenue growth from $984M in 2020 to $1.76B in 2024, with net income improving markedly from a loss of $167M to a profit of $138M. Gross margin was solid at 68%, while EBIT margin remained modest at 8.8%. The most recent year featured a 12.7% revenue increase and a dramatic 269% net margin growth, reflecting a strong operational turnaround and expanding profitability.
Which one has the stronger fundamentals?
Both companies show favorable income statement trends, but Wix.com stands out with higher overall growth rates in revenue and net income, as well as a more substantial improvement in net margin and EPS. Gen Digital maintains stronger margins but faces elevated interest expenses. Wix’s financials suggest a more robust growth trajectory, whereas Gen Digital exhibits consistency with some margin pressures.
Financial Ratios Comparison
The table below presents a side-by-side comparison of key financial ratios for Gen Digital Inc. (GEN) and Wix.com Ltd. (WIX) based on their most recent fiscal year data.
| Ratios | Gen Digital Inc. (2025) | Wix.com Ltd. (2024) |
|---|---|---|
| ROE | 28.3% | -1.76% |
| ROIC | 7.77% | 9.13% |
| P/E | 25.4 | 86.2 |
| P/B | 7.19 | -151.35 |
| Current Ratio | 0.51 | 0.84 |
| Quick Ratio | 0.51 | 0.84 |
| D/E (Debt-to-Equity) | 3.66 | -12.31 |
| Debt-to-Assets | 53.7% | 50.7% |
| Interest Coverage | 2.79 | 25.92 |
| Asset Turnover | 0.25 | 0.92 |
| Fixed Asset Turnover | 36.1 | 3.33 |
| Payout ratio | 48.7% | 0% |
| Dividend yield | 1.92% | 0% |
Interpretation of the Ratios
Gen Digital Inc.
Gen Digital shows strong profitability with a favorable net margin of 16.34% and a robust ROE of 28.34%, although its ROIC is neutral at 7.77%. Concerns include a low current ratio of 0.51, high debt-to-equity of 3.66, and unfavorable P/E and P/B ratios. The company pays dividends with a modest 1.92% yield, supported by a reasonable payout, yet leverage and liquidity pose risks to sustainability.
Wix.com Ltd.
Wix.com presents mixed ratios with a neutral net margin of 7.86% and ROIC at 9.13%, but a deeply negative ROE of -175.57%. Its capital structure benefits from favorable debt-to-equity, though debt-to-assets is unfavorable. Liquidity is slightly weak with a 0.84 current ratio. Wix does not pay dividends, prioritizing reinvestment and R&D, evident in high expense ratios, reflecting growth focus over shareholder payouts.
Which one has the best ratios?
Both companies have a similar proportion of favorable ratios (28.57%) and a slightly unfavorable overall assessment. Gen Digital excels in profitability and shareholder returns but struggles with liquidity and leverage. Wix shows stable operational metrics but suffers from negative returns on equity and no dividends. Neither stands out decisively, each with distinct strengths and weaknesses.
Strategic Positioning
This section compares the strategic positioning of Gen Digital Inc. and Wix.com Ltd., including market position, key segments, and exposure to technological disruption:
Gen Digital Inc.
- Large market cap 16B with moderate beta, facing competitive pressure in cybersecurity software.
- Key segments include Cyber Safety (3.9B in 2025) and Identity Protection services.
- Exposed to cybersecurity technological advances and privacy solutions, evolving threat landscape.
Wix.com Ltd.
- Smaller market cap 4.5B, higher beta, competing in cloud-based website creation platforms.
- Key segments are Creative Subscriptions (1.3B) and Business Solutions.
- Exposed to cloud technology, AI-driven website building, and online business automation.
Gen Digital Inc. vs Wix.com Ltd. Positioning
Gen Digital operates a diversified cyber safety and identity protection portfolio, offering broad consumer coverage worldwide. Wix focuses on a more concentrated cloud-based platform for website creation and business tools, targeting primarily online entrepreneurs and SMBs.
Which has the best competitive advantage?
Both companies are shedding value relative to their cost of capital. Gen Digital shows a declining ROIC trend, indicating worsening profitability, while Wix demonstrates improving ROIC despite still being slightly unfavorable, suggesting a potential emerging competitive advantage.
Stock Comparison
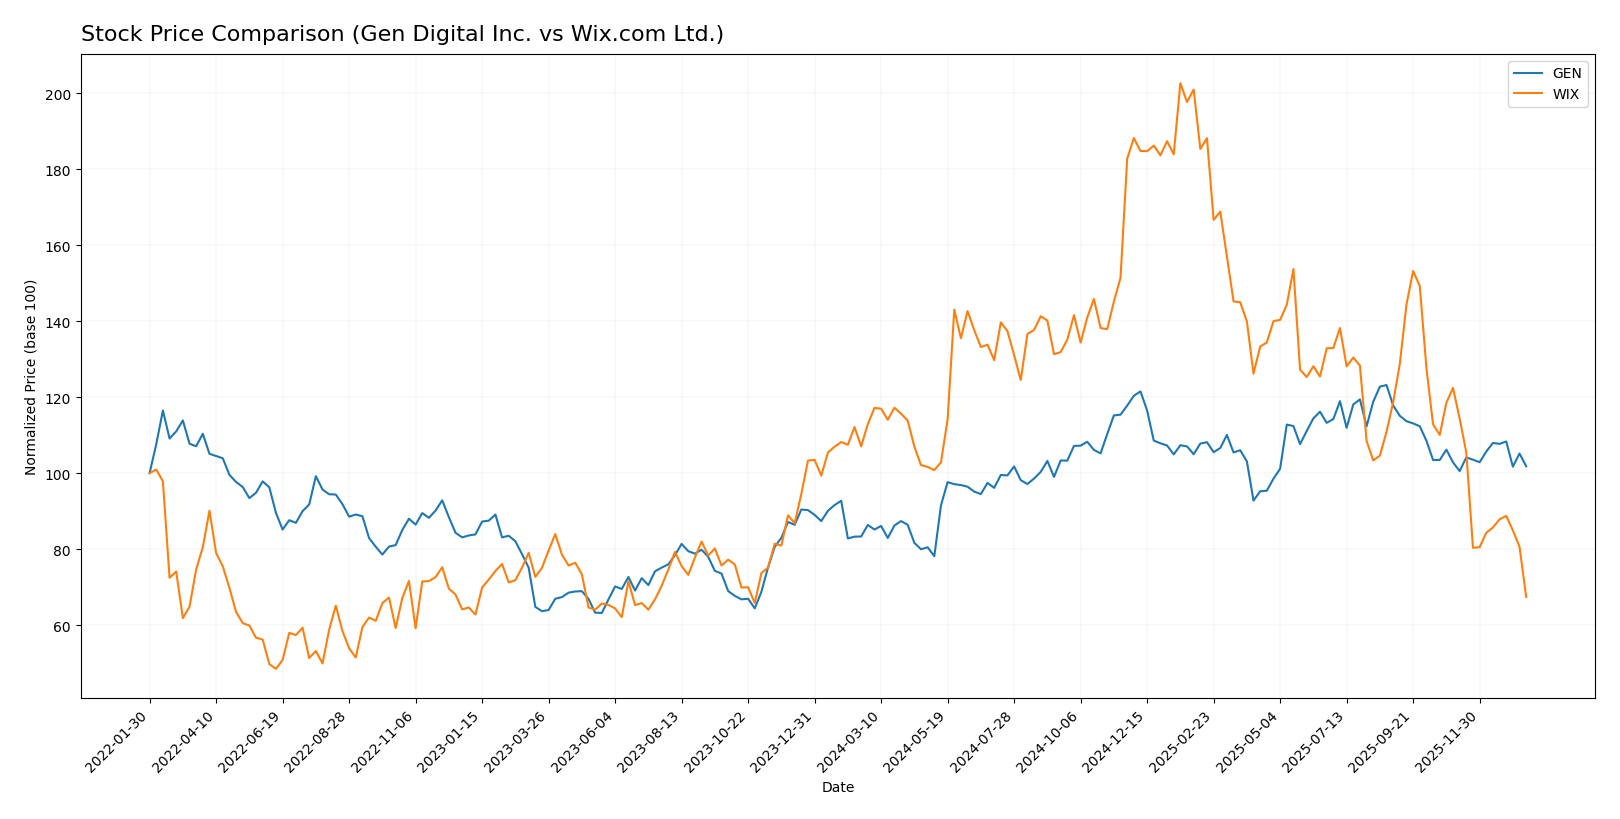
The stock price chart highlights significant divergence in performance between Gen Digital Inc. and Wix.com Ltd. over the past year, with Gen showing steady gains and Wix experiencing substantial declines.
Trend Analysis
Gen Digital Inc. exhibited a bullish trend over the past 12 months with a 17.89% price increase, though the uptrend is decelerating; volatility measured by a 2.59 std deviation and a price range from 20.03 to 31.58 was observed.
Wix.com Ltd. faced a bearish trend, declining 40.28% over the same period with high volatility (34.39 std deviation) and decelerating losses; its stock fell from a high of 240.89 to a low of 80.16.
Comparatively, Gen Digital Inc. delivered the highest market performance with a positive return, whereas Wix.com Ltd. showed a significant negative price movement over the analyzed 12-month period.
Target Prices
The current analyst consensus indicates promising upside potential for both Gen Digital Inc. and Wix.com Ltd.
| Company | Target High | Target Low | Consensus |
|---|---|---|---|
| Gen Digital Inc. | 32 | 31 | 31.5 |
| Wix.com Ltd. | 210 | 70 | 160.27 |
Gen Digital’s target consensus at $31.5 suggests a moderate upside from its current price of $26.1. Wix.com’s wide target range and consensus at $160.27 imply strong growth expectations compared to its current price near $80.16.
Analyst Opinions Comparison
This section compares analysts’ ratings and financial scores for Gen Digital Inc. and Wix.com Ltd.:
Rating Comparison
Gen Digital Inc. Rating
- Rating: B, assessed as Very Favorable by analysts.
- Discounted Cash Flow Score: 5, indicating a very favorable valuation based on future cash flows.
- ROE Score: 5, showing very efficient profit generation from equity.
- ROA Score: 3, a moderate ability to generate earnings from assets.
- Debt To Equity Score: 1, indicating very unfavorable financial risk due to high leverage.
- Overall Score: 3, a moderate overall financial standing.
Wix.com Ltd. Rating
- Rating: C, also considered Very Favorable.
- Discounted Cash Flow Score: 3, suggesting a moderate valuation.
- ROE Score: 1, reflecting very unfavorable profit generation efficiency.
- ROA Score: 4, a favorable utilization of assets for earnings.
- Debt To Equity Score: 1, also showing very unfavorable financial risk.
- Overall Score: 2, a moderate but lower overall standing than Gen.
Which one is the best rated?
Based strictly on the provided data, Gen Digital holds a higher rating (B vs. C) and stronger scores in discounted cash flow and return on equity, while Wix shows a better return on assets score. Overall, Gen is better rated in most key financial metrics.
Scores Comparison
The comparison of financial scores between Gen Digital Inc. and Wix.com Ltd. is as follows:
Gen Scores
- Altman Z-Score: 1.25, indicating financial distress zone with high bankruptcy risk.
- Piotroski Score: 6, considered average financial strength.
Wix Scores
- Altman Z-Score: 1.83, placing the company in the grey zone with moderate bankruptcy risk.
- Piotroski Score: 6, also showing average financial strength.
Which company has the best scores?
Wix.com Ltd. has a slightly better Altman Z-Score, placing it in the grey zone versus Gen’s distress zone. Both have the same Piotroski Score, reflecting equal average financial strength.
Grades Comparison
This section compares the grading data from recognized financial institutions for Gen Digital Inc. and Wix.com Ltd.:
Gen Digital Inc. Grades
The table below presents recent grades from leading financial analysts for Gen Digital Inc.:
| Grading Company | Action | New Grade | Date |
|---|---|---|---|
| RBC Capital | Maintain | Sector Perform | 2025-11-07 |
| Evercore ISI Group | Maintain | Outperform | 2025-11-07 |
| Morgan Stanley | Maintain | Equal Weight | 2025-09-02 |
| Barclays | Maintain | Equal Weight | 2025-08-08 |
| Wells Fargo | Maintain | Overweight | 2025-08-08 |
| RBC Capital | Maintain | Sector Perform | 2025-08-08 |
| Barclays | Maintain | Equal Weight | 2025-07-14 |
| RBC Capital | Maintain | Sector Perform | 2025-05-07 |
| Morgan Stanley | Maintain | Equal Weight | 2025-04-16 |
| RBC Capital | Maintain | Sector Perform | 2025-01-31 |
Overall, Gen Digital’s grades predominantly indicate a stable outlook with mostly “Sector Perform” and “Equal Weight” ratings, suggesting moderate confidence and balanced risk.
Wix.com Ltd. Grades
Below is a summary of recent grades from reputable financial firms for Wix.com Ltd.:
| Grading Company | Action | New Grade | Date |
|---|---|---|---|
| Morgan Stanley | Maintain | Overweight | 2026-01-15 |
| Wells Fargo | Maintain | Overweight | 2025-12-19 |
| Cantor Fitzgerald | Maintain | Overweight | 2025-12-11 |
| Wells Fargo | Maintain | Overweight | 2025-11-20 |
| Barclays | Maintain | Overweight | 2025-11-20 |
| Citizens | Maintain | Market Outperform | 2025-11-20 |
| Citigroup | Maintain | Buy | 2025-11-20 |
| Scotiabank | Maintain | Sector Outperform | 2025-11-20 |
| Needham | Maintain | Buy | 2025-11-20 |
| Evercore ISI Group | Maintain | Outperform | 2025-11-20 |
Wix.com Ltd. shows a strong consensus with mostly “Overweight,” “Buy,” and “Outperform” ratings, reflecting a generally positive outlook and confidence among analysts.
Which company has the best grades?
Wix.com Ltd. has received notably higher and more bullish grades compared to Gen Digital Inc., with multiple “Buy” and “Overweight” ratings versus Gen Digital’s predominant “Sector Perform” and “Equal Weight” grades. This divergence could influence investors seeking growth potential versus stability.
Strengths and Weaknesses
Below is a comparative overview of key strengths and weaknesses for Gen Digital Inc. (GEN) and Wix.com Ltd. (WIX) based on the most recent financial and strategic data.
| Criterion | Gen Digital Inc. (GEN) | Wix.com Ltd. (WIX) |
|---|---|---|
| Diversification | Strong in Cyber Safety with $3.9B revenue in 2025; limited legacy business | Focused on Business Solutions and Creative Subscription, steady growth in both segments |
| Profitability | Net margin 16.34%, ROE 28.34%; PE 25.36 (unfavorable) | Lower net margin 7.86%, negative ROE, high PE 86.21 (unfavorable) |
| Innovation | Declining ROIC trend, value destroying overall | Growing ROIC trend, improving profitability despite current value destruction |
| Global presence | Large global cybersecurity footprint | International SaaS platform with expanding user base |
| Market Share | Significant in cybersecurity market | Strong position in website creation and business solutions market |
Key takeaways: Gen Digital offers solid profitability and a dominant position in cybersecurity, but its declining ROIC and unfavorable valuation metrics signal caution. Wix shows potential with improving capital efficiency and innovation, though profitability and valuation remain challenges. Both require careful risk assessment before investment.
Risk Analysis
Below is a comparative table highlighting key risk factors for Gen Digital Inc. (GEN) and Wix.com Ltd. (WIX) based on the latest available data for 2025 and 2024 respectively:
| Metric | Gen Digital Inc. (GEN) | Wix.com Ltd. (WIX) |
|---|---|---|
| Market Risk | Beta 1.08, moderate volatility | Beta 1.42, higher volatility |
| Debt Level | High debt-to-equity 3.66 (unfavorable), debt/assets 53.66% | Negative debt-to-equity (-12.31, favorable), debt/assets 50.7% (unfavorable) |
| Regulatory Risk | Moderate, operates globally with cyber safety products subject to privacy laws | Moderate, cloud services subject to data regulation in multiple jurisdictions |
| Operational Risk | Moderate, cybersecurity product delivery and service continuity critical | Moderate, cloud platform uptime and software development key |
| Environmental Risk | Low, software industry with minimal direct impact | Low, predominantly digital services |
| Geopolitical Risk | Moderate, US-based but global operations | Moderate to high, Israeli base with international exposure |
Gen Digital faces significant financial risk due to its high leverage and moderate liquidity issues, despite strong profitability and cash flow metrics. Wix shows higher market volatility and weaker profitability indicators, with some financial stability concerns as per its Z-score in the grey zone. Both companies navigate regulatory and geopolitical challenges inherent in global technology sectors.
Which Stock to Choose?
Gen Digital Inc. (GEN) shows stable income growth with a favorable global income statement evaluation and solid profitability metrics including a 28.34% ROE. However, it faces high debt levels and several unfavorable financial ratios, resulting in a slightly unfavorable overall ratio assessment but a very favorable rating.
Wix.com Ltd. (WIX) experienced stronger revenue and net income growth with a highly favorable income statement evaluation. Despite some profitability challenges reflected in negative ROE and moderate debt concerns, its financial ratios are slightly unfavorable overall, and it holds a very favorable rating but shows a distressed Altman Z-Score in the grey zone.
Investors focused on growth might find WIX’s strong income growth and improving profitability appealing, whereas those prioritizing profitability and rating stability may view GEN’s consistent returns and very favorable rating as more attractive. Both stocks show some financial risks, so assessment depends on individual risk tolerance and investment strategy.
Disclaimer: Investment carries a risk of loss of initial capital. The past performance is not a reliable indicator of future results. Be sure to understand risks before making an investment decision.
Go Further
I encourage you to read the complete analyses of Gen Digital Inc. and Wix.com Ltd. to enhance your investment decisions: