VeriSign, Inc. and Gen Digital Inc. are two prominent players in the software infrastructure sector, each shaping the digital landscape with distinct yet overlapping services. VeriSign secures critical internet domains, ensuring stable online navigation, while Gen Digital focuses on comprehensive cybersecurity solutions for consumers worldwide. This comparison will explore their market positions, innovation approaches, and growth potential to help you decide which company holds the most promise for your investment portfolio.
Table of contents
Companies Overview
I will begin the comparison between VeriSign and Gen Digital by providing an overview of these two companies and their main differences.
VeriSign Overview
VeriSign, Inc. operates as a key provider of domain name registry services and internet infrastructure, supporting recognized domain names worldwide. The company focuses on ensuring the security, stability, and resiliency of internet infrastructure, including operating root zone and authoritative resolution services for .com and .net domains. VeriSign is headquartered in Reston, Virginia, and employs approximately 929 people.
Gen Digital Overview
Gen Digital Inc. delivers cyber safety solutions for consumers across multiple regions, offering products like Norton 360 and LifeLock identity theft protection. Its services encompass malware protection, VPN, privacy monitoring, and online reputation management. Founded in 1982 and based in Tempe, Arizona, Gen Digital employs around 3,400 people and markets its offerings through retailers, telecom providers, and e-commerce platforms.
Key similarities and differences
Both VeriSign and Gen Digital operate in the software infrastructure sector, focusing on internet security and protection. VeriSign specializes in domain registry and internet infrastructure services, whereas Gen Digital provides consumer-oriented cybersecurity products and identity protection. VeriSign’s business model centers on internet infrastructure stability, while Gen Digital emphasizes comprehensive cyber safety solutions and privacy management for individual users.
Income Statement Comparison
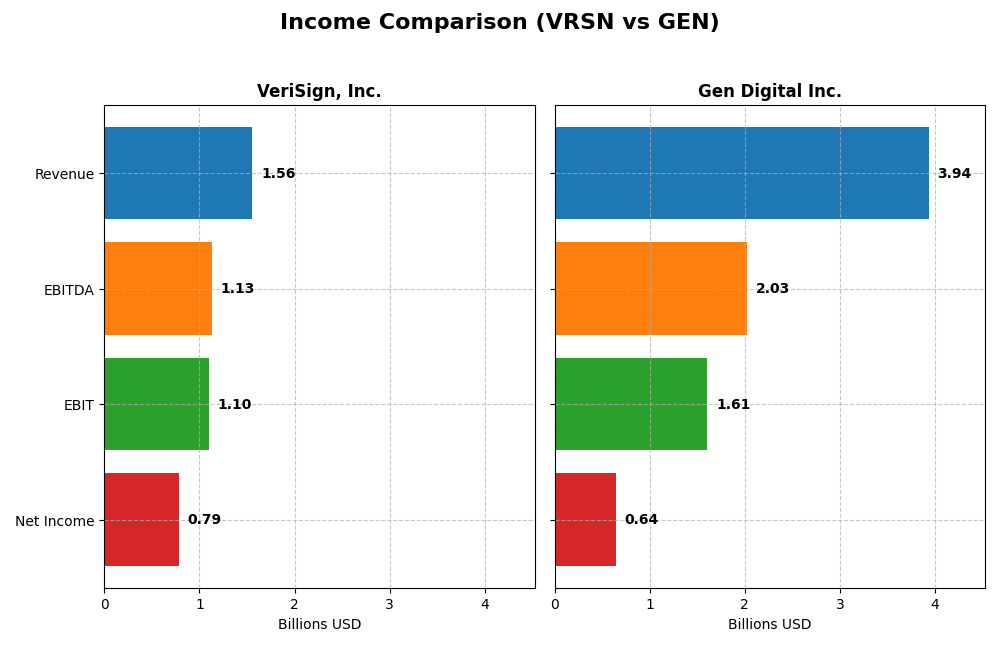
This table compares the key income statement metrics for VeriSign, Inc. and Gen Digital Inc. for their most recent fiscal years, providing a snapshot of their financial performance.
| Metric | VeriSign, Inc. (2024) | Gen Digital Inc. (2025) |
|---|---|---|
| Market Cap | 23.1B | 16.1B |
| Revenue | 1.56B | 3.94B |
| EBITDA | 1.13B | 2.03B |
| EBIT | 1.10B | 1.61B |
| Net Income | 786M | 643M |
| EPS | 8.01 | 1.04 |
| Fiscal Year | 2024 | 2025 |
Income Statement Interpretations
VeriSign, Inc.
VeriSign’s revenue increased steadily from $1.27B in 2020 to $1.56B in 2024, showing a 23.11% growth over five years. Net income, however, slightly declined by 3.58% overall, with a net margin decrease of 21.68%. In 2024, revenue growth slowed to 4.31%, net margin contracted by 7.87%, but gross and operating margins remained strong and favorable.
Gen Digital Inc.
Gen Digital’s revenue rose sharply from $2.55B in 2021 to $3.94B in 2025, marking a 54.25% growth. Net income grew by 16.06% over the period, with a moderate net margin decline of 24.76%. The most recent year saw 3.55% revenue growth and a 44% EBIT increase, reflecting improved operational efficiency despite an unfavorable interest expense ratio.
Which one has the stronger fundamentals?
Both companies present favorable income statement evaluations, with Gen Digital showing stronger revenue and net income growth, supported by significant EBIT expansion. VeriSign maintains higher margins and lower interest expenses, but net margin trends are less favorable. Gen’s higher interest costs are a concern, while VeriSign’s margin erosion signals potential pressure.
Financial Ratios Comparison
Below is a comparison of key financial ratios for VeriSign, Inc. and Gen Digital Inc. based on their most recent fiscal year data.
| Ratios | VeriSign, Inc. (2024) | Gen Digital Inc. (2025) |
|---|---|---|
| ROE | -40.1% | 28.3% |
| ROIC | 4.51% | 7.77% (calculated as Return on Invested Capital 7.8%) |
| P/E | 25.8 | 25.4 |
| P/B | -10.4 | 7.19 |
| Current Ratio | 0.43 | 0.51 |
| Quick Ratio | 0.43 | 0.51 |
| D/E | -0.92 | 3.66 |
| Debt-to-Assets | 128% | 54% |
| Interest Coverage | 14.1 | 2.79 |
| Asset Turnover | 1.11 | 0.25 |
| Fixed Asset Turnover | 6.66 | 36.1 |
| Payout ratio | 0 | 48.7% |
| Dividend yield | 0% | 1.92% |
Interpretation of the Ratios
VeriSign, Inc.
VeriSign shows a mix of strong and weak financial ratios in 2024, with favorable net margin (50.45%) and return on invested capital (451.0%), but an unfavorable return on equity (-40.13%) and low liquidity ratios (current ratio 0.43). Its dividend yield is zero, indicating no dividend payments; this may reflect a reinvestment strategy or other capital allocation priorities.
Gen Digital Inc.
Gen Digital’s 2025 ratios reveal moderate strength, including a favorable net margin (16.34%) and return on equity (28.34%), but weaknesses in leverage (debt to equity 3.66) and asset turnover (0.25). The company pays a dividend with a 1.92% yield, but payout sustainability appears neutral, reflecting balanced shareholder returns and financial constraints.
Which one has the best ratios?
VeriSign’s ratios are globally more favorable (57.14% positive) despite some liquidity concerns, while Gen Digital displays higher leverage and weaker asset efficiency, leading to a slightly unfavorable overall ratio opinion. VeriSign’s strong profitability and capital returns contrast with Gen Digital’s mixed performance and moderate dividend yield.
Strategic Positioning
This section compares the strategic positioning of VeriSign and Gen Digital, including Market position, Key segments, and Exposure to technological disruption:
VeriSign, Inc.
- Dominates domain name registry with .com, .net; limited direct competition in root zone services.
- Focused on internet infrastructure and domain registry services supporting global e-commerce.
- Operates critical internet root servers; technological disruption risk is low due to infrastructure role.
Gen Digital Inc.
- Competes in consumer cybersecurity with broad global presence; faces competitive pressure in digital safety market.
- Diverse cyber safety products including identity protection, VPN, and privacy solutions driving revenue growth.
- High exposure to rapid cybersecurity innovations and evolving online threats requiring continuous product updates.
VeriSign vs Gen Digital Positioning
VeriSign has a concentrated focus on domain registry and internet infrastructure with a defensible niche, while Gen Digital pursues a diversified product portfolio in consumer cybersecurity. VeriSign’s positioning benefits from critical infrastructure control, whereas Gen Digital faces ongoing innovation demands.
Which has the best competitive advantage?
VeriSign demonstrates a very favorable moat with growing ROIC, indicating strong value creation and durable competitive advantage. Gen Digital shows a very unfavorable moat with declining ROIC, suggesting value destruction and weaker competitive positioning.
Stock Comparison
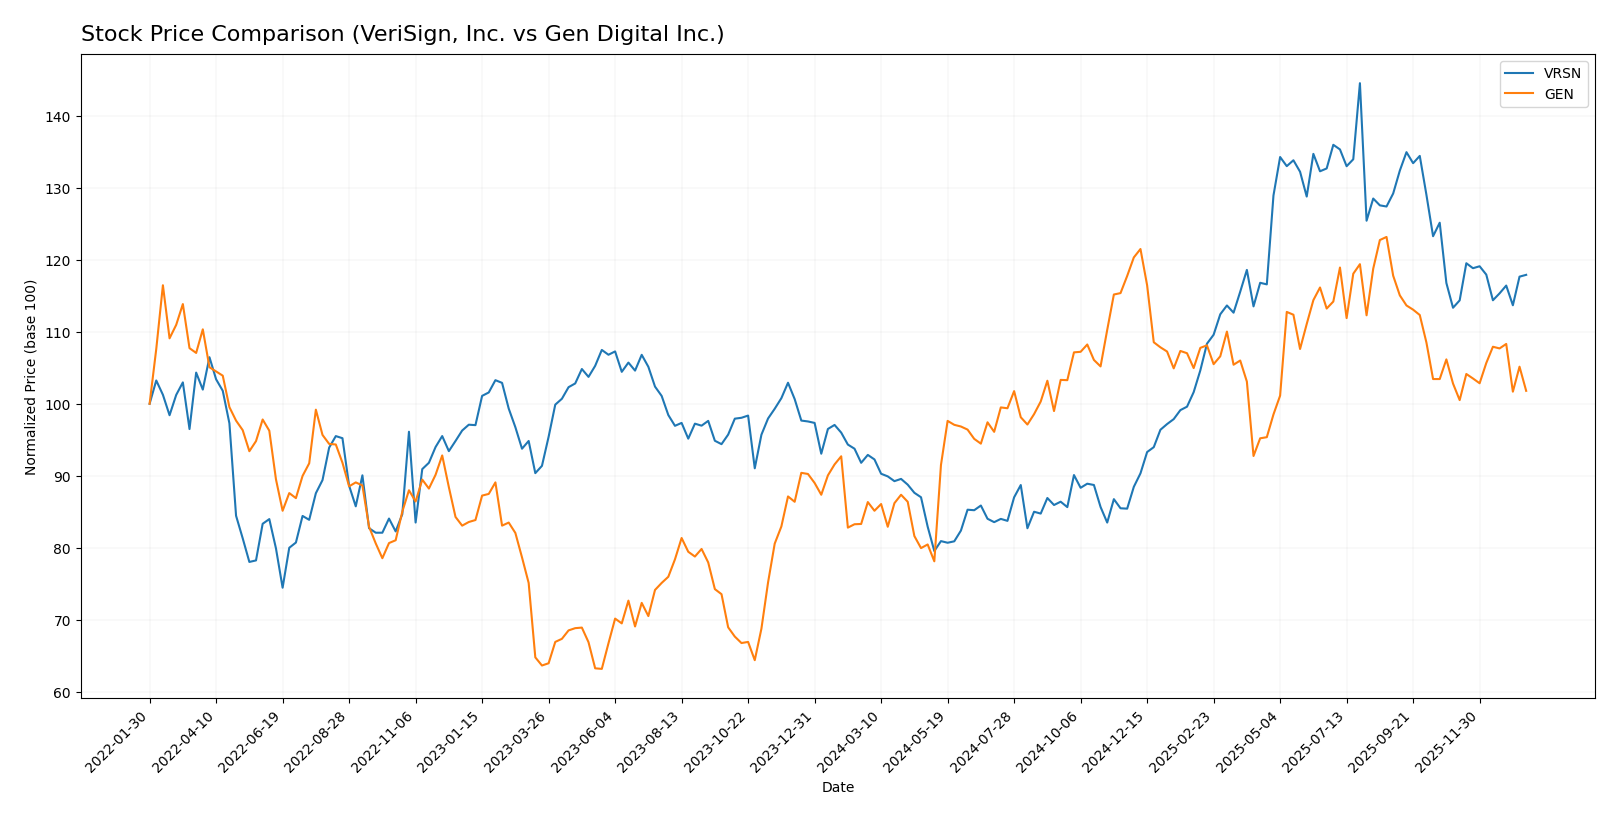
The stock price chart below illustrates significant bullish trends for both VeriSign, Inc. and Gen Digital Inc. over the past 12 months, with VeriSign showing higher volatility and a decelerating upward momentum.
Trend Analysis
VeriSign, Inc. experienced a 26.92% price increase over the past year, indicating a bullish trend with decelerating momentum and notable price volatility, ranging from 168.32 to 305.79.
Gen Digital Inc. posted a 17.89% gain in the same period, also bullish but with lower volatility and deceleration in price rise, fluctuating between 20.03 and 31.58.
Comparatively, VeriSign outperformed Gen Digital over the past year, delivering the highest market performance with stronger price appreciation and greater volatility.
Target Prices
The current analyst target price consensus shows a positive outlook for VeriSign, Inc. and Gen Digital Inc.
| Company | Target High | Target Low | Consensus |
|---|---|---|---|
| VeriSign, Inc. | 325 | 325 | 325 |
| Gen Digital Inc. | 32 | 31 | 31.5 |
Analysts expect VeriSign’s stock to appreciate significantly from its current price of $249.47, suggesting strong confidence. Gen Digital’s target consensus at $31.5 also indicates potential upside from its $26.10 current price.
Analyst Opinions Comparison
This section compares analysts’ ratings and financial scores for VeriSign, Inc. and Gen Digital Inc.:
Rating Comparison
VeriSign, Inc. Rating
- Rating: B- indicating a very favorable overall evaluation.
- Discounted Cash Flow Score: 4, assessed as favorable.
- ROE Score: 1, marked as very unfavorable.
- ROA Score: 5, regarded as very favorable.
- Debt To Equity Score: 1, classified as very unfavorable.
- Overall Score: 2, categorized as moderate.
Gen Digital Inc. Rating
- Rating: B indicating a very favorable overall evaluation.
- Discounted Cash Flow Score: 5, considered very favorable.
- ROE Score: 5, rated very favorable.
- ROA Score: 3, viewed as moderate.
- Debt To Equity Score: 1, classified as very unfavorable.
- Overall Score: 3, categorized as moderate.
Which one is the best rated?
Based on the data, Gen Digital Inc. holds a higher rating of B versus VeriSign’s B-, with stronger scores in discounted cash flow and return on equity. Both share similar moderate overall scores and unfavorable debt to equity ratings.
Scores Comparison
Here is a comparison of VeriSign and Gen Digital scores:
VRSN Scores
- Altman Z-Score: -4.67, in distress zone, high bankruptcy risk
- Piotroski Score: 8, very strong financial health
GEN Scores
- Altman Z-Score: 1.25, in distress zone, moderate bankruptcy risk
- Piotroski Score: 6, average financial health
Which company has the best scores?
VeriSign has a much lower Altman Z-Score, indicating higher bankruptcy risk, but a stronger Piotroski Score showing better financial strength compared to Gen Digital’s moderate scores in both metrics.
Grades Comparison
Here is a comparison of the recent grades for VeriSign, Inc. and Gen Digital Inc.:
VeriSign, Inc. Grades
The following table summarizes recent grades assigned to VeriSign, Inc. by reputable grading companies.
| Grading Company | Action | New Grade | Date |
|---|---|---|---|
| JP Morgan | Maintain | Neutral | 2026-01-06 |
| Baird | Maintain | Outperform | 2025-07-01 |
| Baird | Maintain | Outperform | 2025-04-25 |
| Baird | Maintain | Outperform | 2025-04-01 |
| Citigroup | Maintain | Buy | 2025-02-04 |
| Citigroup | Maintain | Buy | 2025-01-03 |
| Baird | Upgrade | Outperform | 2024-12-09 |
| Baird | Maintain | Neutral | 2024-06-27 |
| Baird | Maintain | Neutral | 2024-04-26 |
| Citigroup | Maintain | Buy | 2024-04-02 |
VeriSign’s grades have generally trended toward Outperform and Buy ratings, with multiple maintenance actions and one upgrade from Neutral to Outperform.
Gen Digital Inc. Grades
The table below presents the latest grades for Gen Digital Inc. from established grading companies.
| Grading Company | Action | New Grade | Date |
|---|---|---|---|
| RBC Capital | Maintain | Sector Perform | 2025-11-07 |
| Evercore ISI Group | Maintain | Outperform | 2025-11-07 |
| Morgan Stanley | Maintain | Equal Weight | 2025-09-02 |
| Barclays | Maintain | Equal Weight | 2025-08-08 |
| Wells Fargo | Maintain | Overweight | 2025-08-08 |
| RBC Capital | Maintain | Sector Perform | 2025-08-08 |
| Barclays | Maintain | Equal Weight | 2025-07-14 |
| RBC Capital | Maintain | Sector Perform | 2025-05-07 |
| Morgan Stanley | Maintain | Equal Weight | 2025-04-16 |
| RBC Capital | Maintain | Sector Perform | 2025-01-31 |
Gen Digital’s grades consistently range from Sector Perform to Outperform, with most ratings maintained and no recent upgrades or downgrades.
Which company has the best grades?
VeriSign, Inc. has received stronger and more positive grades overall, including multiple Outperform and Buy ratings, compared to Gen Digital Inc.’s predominantly Sector Perform and Equal Weight grades. This suggests a more favorable analyst outlook for VeriSign, which may influence investor sentiment and portfolio decisions.
Strengths and Weaknesses
Below is a comparative overview of key strengths and weaknesses of VeriSign, Inc. (VRSN) and Gen Digital Inc. (GEN) based on their latest financial and strategic data.
| Criterion | VeriSign, Inc. (VRSN) | Gen Digital Inc. (GEN) |
|---|---|---|
| Diversification | Limited product diversification, focused on domain name services | More diversified with strong Cyber Safety and Identity Protection segments |
| Profitability | Very high profitability with 50.45% net margin, strong ROIC (451%) | Moderate profitability, 16.34% net margin, ROIC slightly above WACC (7.77%) |
| Innovation | Durable competitive advantage with growing ROIC and high asset turnover | Innovation challenges indicated by declining ROIC and mixed ratio performance |
| Global presence | Strong global presence via internet infrastructure services | Global footprint supported by cybersecurity offerings but less dominant |
| Market Share | Leader in domain name registry market with durable moat | Significant market share in consumer cybersecurity but facing competitive pressures |
In summary, VeriSign displays a strong economic moat with exceptional profitability and efficient capital use, though its focus is narrower. Gen Digital shows diversification strength but struggles with profitability and value creation, posing higher risks for investors.
Risk Analysis
Below is a comparative table summarizing key risk factors for VeriSign, Inc. (VRSN) and Gen Digital Inc. (GEN) based on their most recent financial and operational data.
| Metric | VeriSign, Inc. (VRSN) | Gen Digital Inc. (GEN) |
|---|---|---|
| Market Risk | Beta 0.77 (lower volatility) | Beta 1.08 (moderate volatility) |
| Debt level | Debt-to-assets 128.08% (high) | Debt-to-assets 53.66% (moderate) |
| Regulatory Risk | Moderate; operates critical domain infrastructure | Moderate; cybersecurity industry subject to data regulations |
| Operational Risk | Low; stable infrastructure services | Moderate; product security and service delivery reliance |
| Environmental Risk | Low; tech infrastructure company | Low; software-focused operations |
| Geopolitical Risk | Moderate; global internet dependencies | Moderate; global cybersecurity market exposure |
The most likely and impactful risks are VeriSign’s high debt level and Gen Digital’s elevated leverage combined with moderate operational risks. VeriSign’s distressed Altman Z-score signals financial caution despite strong profitability, while Gen Digital’s moderate Altman score reflects some financial vulnerability. Both companies face regulatory and geopolitical risks inherent to their technology sectors.
Which Stock to Choose?
VeriSign, Inc. (VRSN) shows a favorable income evolution with 23.11% revenue growth overall, strong profitability indicated by a 50.45% net margin, but a negative return on equity at -40.13%. Its debt profile is mixed, with a favorable debt-to-equity ratio but unfavorable debt-to-assets, and it holds a very favorable moat rating due to a high ROIC exceeding WACC.
Gen Digital Inc. (GEN) also displays favorable income trends, with 54.25% revenue growth overall and positive profitability metrics including a 16.34% net margin and 28.34% ROE. However, its debt levels are relatively high, reflected by an unfavorable debt-to-equity ratio, and it suffers from a very unfavorable moat rating given its declining ROIC below WACC.
For investors focused on durable competitive advantages and efficient capital use, VeriSign’s very favorable moat and strong income quality might appear more attractive. Conversely, those prioritizing growth and higher return on equity may find Gen Digital’s financial performance and moderate rating more aligned with their profile, despite its higher leverage and weaker moat status.
Disclaimer: Investment carries a risk of loss of initial capital. The past performance is not a reliable indicator of future results. Be sure to understand risks before making an investment decision.
Go Further
I encourage you to read the complete analyses of VeriSign, Inc. and Gen Digital Inc. to enhance your investment decisions: