In today’s rapidly evolving technology landscape, choosing the right company to invest in requires careful analysis. Gen Digital Inc. and StoneCo Ltd. both operate within the software infrastructure industry but serve distinct markets—cybersecurity and fintech, respectively. Their innovative approaches to securing digital environments and enabling electronic commerce highlight growth opportunities. This article will help you evaluate which company stands out as the most compelling investment choice in 2026.
Table of contents
Companies Overview
I will begin the comparison between Gen Digital Inc. and StoneCo Ltd. by providing an overview of these two companies and their main differences.
Gen Digital Inc. Overview
Gen Digital Inc. specializes in providing cyber safety solutions across multiple regions including the US, Canada, Latin America, Europe, and Asia Pacific. The company offers a broad range of products such as Norton 360, Norton Secure VPN, LifeLock identity protection, and Avira Security. It focuses on protecting consumers from online threats through subscription services and partners with retailers, telecom providers, and e-commerce platforms. Gen Digital is headquartered in Tempe, Arizona, with a market cap of $16B.
StoneCo Ltd. Overview
StoneCo Ltd. delivers financial technology solutions to merchants and partners primarily in Brazil, supporting electronic commerce across in-store, online, and mobile channels. It operates through Stone Hubs and a direct sales force, serving about 1.77M clients including small and medium businesses, marketplaces, and e-commerce platforms. Founded in 2000 and based in the Cayman Islands, StoneCo has a market cap of $3.9B and emphasizes hyper-local sales and technology integration.
Key similarities and differences
Both companies operate in the technology sector focusing on infrastructure software but serve different markets and industries. Gen Digital provides cybersecurity and identity protection services globally, primarily targeting consumers, whereas StoneCo offers fintech solutions mainly to Brazilian merchants and businesses. Gen Digital’s business model is subscription-based with a global consumer reach, while StoneCo emphasizes localized sales and service for electronic commerce within a regional market.
Income Statement Comparison
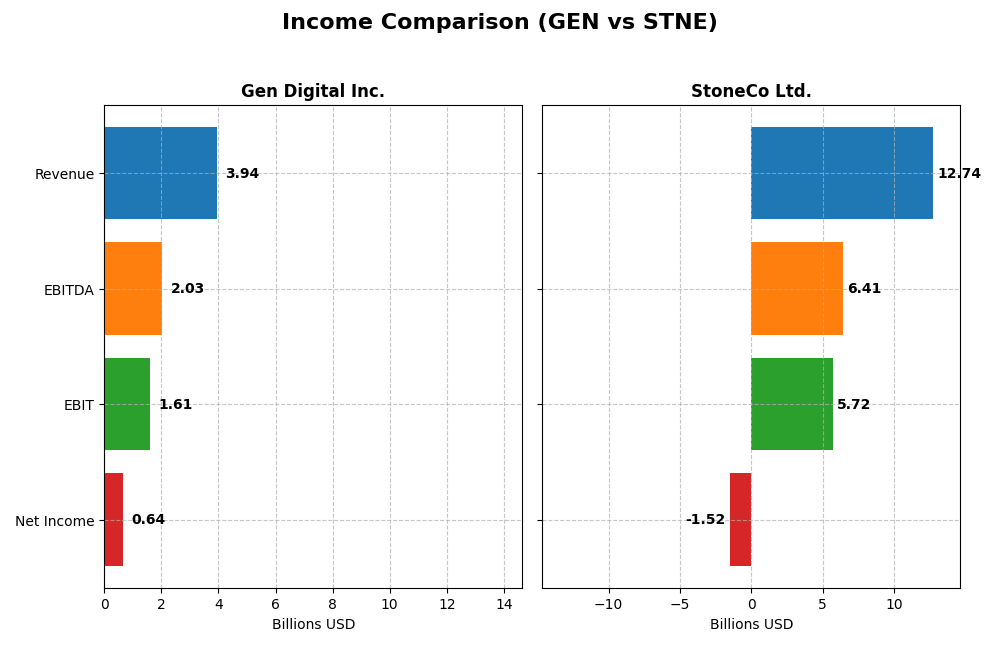
The table below presents a side-by-side comparison of the most recent full fiscal year income statement metrics for Gen Digital Inc. and StoneCo Ltd., highlighting key financial figures in USD and BRL respectively.
| Metric | Gen Digital Inc. (GEN) | StoneCo Ltd. (STNE) |
|---|---|---|
| Market Cap | 16.1B USD | 3.9B USD |
| Revenue | 3.94B USD | 12.74B BRL |
| EBITDA | 2.03B USD | 6.41B BRL |
| EBIT | 1.61B USD | 5.72B BRL |
| Net Income | 643M USD | -1.52B BRL |
| EPS | 1.04 USD | -5.02 BRL |
| Fiscal Year | 2025 | 2024 |
Income Statement Interpretations
Gen Digital Inc.
Gen Digital’s revenue rose steadily over 2021-2025, reaching $3.93B in 2025, with net income growing modestly to $643M. Gross and EBIT margins remained strong and favorable, around 80% and 41% respectively, though net margin contracted slightly overall. In 2025, revenue growth slowed to 3.55%, but EBIT surged 44%, indicating improved operational efficiency despite higher interest expenses.
StoneCo Ltd.
StoneCo exhibited robust revenue expansion, growing 302% from 2020 to 2024, with 2024 revenue hitting BRL 12.7B. Gross and EBIT margins stayed favorable at 73.4% and 44.9%. However, net income declined significantly, with a negative net margin of -11.9% in 2024. While operational metrics improved, net margin and EPS suffered sharp declines, reflecting ongoing profitability challenges.
Which one has the stronger fundamentals?
Gen Digital demonstrates more stable profitability with favorable margins and consistent net income growth, despite some interest expense concerns. StoneCo’s rapid revenue growth contrasts with persistent net losses and negative margins, indicating higher risk. Overall, Gen Digital’s income statement reflects stronger fundamentals in terms of profitability and risk management.
Financial Ratios Comparison
Below is a comparison of key financial ratios for Gen Digital Inc. (GEN) and StoneCo Ltd. (STNE) based on their most recent fiscal year data.
| Ratios | Gen Digital Inc. (2025) | StoneCo Ltd. (2024) |
|---|---|---|
| ROE | 28.3% | -12.9% |
| ROIC | 7.8% | 22.4% |
| P/E | 25.4 | -9.8 |
| P/B | 7.19 | 1.27 |
| Current Ratio | 0.51 | 1.37 |
| Quick Ratio | 0.51 | 1.37 |
| D/E (Debt-to-Equity) | 3.66 | 1.10 |
| Debt-to-Assets | 53.7% | 23.5% |
| Interest Coverage | 2.79 | 5.57 |
| Asset Turnover | 0.25 | 0.23 |
| Fixed Asset Turnover | 36.1 | 6.95 |
| Payout Ratio | 48.7% | 0% |
| Dividend Yield | 1.92% | 0% |
Interpretation of the Ratios
Gen Digital Inc.
Gen Digital shows strong profitability with a favorable net margin of 16.34% and a robust return on equity of 28.34%, though its return on invested capital is neutral at 7.77%. Liquidity and leverage ratios are weak, with a current ratio of 0.51 and debt-to-equity of 3.66, signaling potential short-term risks. The company pays a dividend with a 1.92% yield, supported moderately by free cash flow, but high payout concerns exist.
StoneCo Ltd.
StoneCo’s ratios reveal challenges with negative net margin (-11.89%) and return on equity (-12.87%), indicating profitability issues. However, its return on invested capital is strong at 22.41%, showing efficient capital use. Liquidity ratios are better than Gen’s, with a current ratio of 1.37. StoneCo does not pay dividends, likely due to ongoing reinvestment and growth strategies typical in fintech, with no share buybacks reported.
Which one has the best ratios?
StoneCo’s ratios are slightly more favorable overall, with 50% favorable versus Gen’s 28.57%. Despite StoneCo’s negative profitability metrics, its capital efficiency and liquidity outperform Gen. Gen shows stronger profitability but suffers from weak liquidity and high leverage. Each company exhibits distinct strengths and weaknesses, reflecting their different operational and financial profiles.
Strategic Positioning
This section compares the strategic positioning of Gen Digital Inc. and StoneCo Ltd., including their market position, key segments, and exposure to technological disruption:
Gen Digital Inc.
- Leading global cyber safety provider facing moderate pressure in software infrastructure space.
- Core revenues from cyber safety products like Norton 360 and LifeLock identity protection.
- Exposure to evolving cybersecurity threats requiring continuous innovation in protection software.
StoneCo Ltd.
- Brazil-focused fintech firm encountering strong competition in electronic commerce solutions.
- Serves over 1.7M small and medium merchants with payment and commerce technology solutions.
- Dependent on fintech evolution and digital commerce growth in Latin America, with tech-driven disruption.
Gen Digital Inc. vs StoneCo Ltd. Positioning
Gen Digital operates a diversified global cyber safety business emphasizing consumer security, while StoneCo concentrates on fintech services for Brazilian merchants. Gen Digital’s broad product portfolio contrasts with StoneCo’s regional, niche market focus, each with distinct competitive pressures and innovation demands.
Which has the best competitive advantage?
StoneCo demonstrates a strong competitive advantage with a very favorable moat supported by growing ROIC, indicating durable value creation. Conversely, Gen Digital shows a very unfavorable moat with declining ROIC, signaling value erosion and weaker competitive positioning.
Stock Comparison
The stock price chart highlights Gen Digital Inc.’s steady 17.89% gain over the past year, contrasting with StoneCo Ltd.’s 13.9% decline, reflecting divergent trading momentum and volume trends.

Trend Analysis
Gen Digital Inc. displayed a bullish trend over the past 12 months with a 17.89% price increase, though the trend shows deceleration. The stock reached a high of 31.58 and a low of 20.03, with moderate volatility (std deviation 2.59).
StoneCo Ltd. experienced a bearish trend with a 13.9% price decrease over the same period. The trend also decelerated, with a high of 19.4 and a low of 7.85, and slightly higher volatility (std deviation 2.92).
Comparing the two, Gen Digital Inc. delivered the highest market performance, achieving a positive price change while StoneCo Ltd. declined significantly over the year.
Target Prices
The current analyst consensus presents clear target price ranges for both Gen Digital Inc. and StoneCo Ltd.
| Company | Target High | Target Low | Consensus |
|---|---|---|---|
| Gen Digital Inc. | 32 | 31 | 31.5 |
| StoneCo Ltd. | 20 | 20 | 20 |
Analysts expect Gen Digital Inc.’s stock to appreciate moderately from its current price of 26.1 USD to around 31.5 USD consensus target. StoneCo Ltd.’s consensus target at 20 USD also suggests upside potential from its current 14.49 USD price.
Analyst Opinions Comparison
This section compares analysts’ ratings and grades for Gen Digital Inc. and StoneCo Ltd.:
Rating Comparison
Gen Digital Inc. Rating
- Rating: B, considered very favorable by analysts.
- Discounted Cash Flow Score: 5, very favorable.
- ROE Score: 5, very favorable, indicating strong profit generation from equity.
- ROA Score: 3, moderate asset utilization.
- Debt To Equity Score: 1, very unfavorable, indicating high financial risk.
- Overall Score: 3, moderate overall financial standing.
StoneCo Ltd. Rating
- Rating: C, also considered very favorable.
- Discounted Cash Flow Score: 3, moderate rating.
- ROE Score: 1, very unfavorable performance.
- ROA Score: 1, very unfavorable asset use.
- Debt To Equity Score: 1, very unfavorable risk level.
- Overall Score: 2, moderate but lower than Gen Digital.
Which one is the best rated?
Based on the data, Gen Digital Inc. holds a higher rating (B) and stronger scores in discounted cash flow, ROE, and ROA compared to StoneCo Ltd., which has a lower rating (C) and weaker profitability and asset metrics. However, both share very unfavorable debt-to-equity scores.
Scores Comparison
The scores comparison between Gen Digital Inc. and StoneCo Ltd. highlights their financial risk and strength metrics:
Gen Digital Inc. Scores
- Altman Z-Score: 1.25, indicating financial distress zone.
- Piotroski Score: 6, reflecting average financial strength.
StoneCo Ltd. Scores
- Altman Z-Score: 1.02, indicating financial distress zone.
- Piotroski Score: 5, reflecting average financial strength.
Which company has the best scores?
Gen Digital Inc. has slightly higher Altman Z-Score and Piotroski Score values than StoneCo Ltd., indicating marginally better financial stability and strength based on the provided data.
Grades Comparison
The latest grades for Gen Digital Inc. and StoneCo Ltd. from recognized financial institutions are as follows:
Gen Digital Inc. Grades
This table summarizes recent grades and rating actions from leading grading companies for Gen Digital Inc.:
| Grading Company | Action | New Grade | Date |
|---|---|---|---|
| RBC Capital | Maintain | Sector Perform | 2025-11-07 |
| Evercore ISI Group | Maintain | Outperform | 2025-11-07 |
| Morgan Stanley | Maintain | Equal Weight | 2025-09-02 |
| Barclays | Maintain | Equal Weight | 2025-08-08 |
| Wells Fargo | Maintain | Overweight | 2025-08-08 |
| RBC Capital | Maintain | Sector Perform | 2025-08-08 |
| Barclays | Maintain | Equal Weight | 2025-07-14 |
| RBC Capital | Maintain | Sector Perform | 2025-05-07 |
| Morgan Stanley | Maintain | Equal Weight | 2025-04-16 |
| RBC Capital | Maintain | Sector Perform | 2025-01-31 |
Gen Digital’s grades mostly reflect a stable outlook with several “Equal Weight” and “Sector Perform” ratings and a few “Overweight” and “Outperform” opinions.
StoneCo Ltd. Grades
This table presents the latest grading company evaluations and their actions for StoneCo Ltd.:
| Grading Company | Action | New Grade | Date |
|---|---|---|---|
| Goldman Sachs | Maintain | Buy | 2025-10-14 |
| B of A Securities | Maintain | Buy | 2025-09-09 |
| UBS | Maintain | Buy | 2025-08-29 |
| JP Morgan | Maintain | Overweight | 2025-07-16 |
| Barclays | Maintain | Equal Weight | 2025-05-12 |
| Barclays | Maintain | Equal Weight | 2025-04-23 |
| Citigroup | Upgrade | Buy | 2025-04-22 |
| Barclays | Maintain | Equal Weight | 2025-03-21 |
| Morgan Stanley | Maintain | Underweight | 2025-03-21 |
| Goldman Sachs | Maintain | Buy | 2025-02-06 |
StoneCo shows a generally positive grading trend with multiple “Buy” ratings and some “Equal Weight,” although there is one “Underweight” rating noted.
Which company has the best grades?
StoneCo Ltd. has received more “Buy” and “Overweight” grades from major firms compared to Gen Digital Inc.’s predominance of “Equal Weight” and “Sector Perform” ratings. This suggests StoneCo currently enjoys a comparatively stronger analyst endorsement, potentially influencing investor sentiment toward higher expected performance or growth prospects.
Strengths and Weaknesses
Below is a comparative overview of key strengths and weaknesses for Gen Digital Inc. (GEN) and StoneCo Ltd. (STNE) based on the latest financial and operational data.
| Criterion | Gen Digital Inc. (GEN) | StoneCo Ltd. (STNE) |
|---|---|---|
| Diversification | Moderate: Cyber Safety revenues dominate with $3.89B, limited Legacy segment at $50M | Moderate: Focus on fintech solutions, less diversified product portfolio |
| Profitability | Favorable net margin (16.34%) and ROE (28.34%), but ROIC slightly below WACC, value destroying overall | Negative net margin (-11.89%) and ROE (-12.87%), but strong ROIC (22.41%), value creating overall |
| Innovation | Moderate: steady Cyber Safety growth but declining ROIC trend suggests innovation challenges | Strong: Growing ROIC and durable competitive advantage indicate innovation effectiveness |
| Global presence | Strong global footprint in cybersecurity markets | Growing presence but more regionally focused in Brazil and Latin America |
| Market Share | Large share in cybersecurity with $3.89B revenues | Increasing market share in fintech, but profitability and margins remain pressured |
Key takeaways: StoneCo shows strong value creation and innovation with a growing competitive advantage, despite current profitability challenges. Gen Digital holds a strong market position and profitability metrics, but declining ROIC suggests caution on sustained value creation. Investors should weigh innovation and profitability trends carefully.
Risk Analysis
Below is a comparative table outlining the key risks for Gen Digital Inc. and StoneCo Ltd. based on the most recent fiscal data:
| Metric | Gen Digital Inc. (GEN) | StoneCo Ltd. (STNE) |
|---|---|---|
| Market Risk | Moderate (beta 1.08) | High (beta 1.84) |
| Debt level | High (Debt/Equity 3.66; 54%) | Moderate (Debt/Equity 1.1; 24%) |
| Regulatory Risk | Moderate (Tech industry regulations) | High (Brazilian fintech regulations) |
| Operational Risk | Moderate (software infrastructure) | Moderate (high client base, operational complexity) |
| Environmental Risk | Low (software sector) | Low (financial technology sector) |
| Geopolitical Risk | Low (US-based) | High (Exposure to Brazil and Cayman Islands) |
Gen Digital faces significant financial leverage risks with high debt levels and unfavorable liquidity ratios, but benefits from strong profitability metrics. StoneCo is exposed to higher market volatility and regulatory risks in Brazil, compounded by negative profitability and financial distress indicators. Both companies are in the distress zone for bankruptcy risk, demanding cautious portfolio weighting.
Which Stock to Choose?
Gen Digital Inc. (GEN) exhibits a favorable income statement with steady revenue and net income growth over 2021-2025, supported by strong profitability metrics such as a 28.34% ROE. However, it carries high debt levels, reflected in a 3.66 debt-to-equity ratio and a current ratio below 1, leading to a slightly unfavorable global financial ratios evaluation and a very unfavorable MOAT status indicating value destruction.
StoneCo Ltd. (STNE) presents mixed income trends with robust revenue growth but negative net margin and earnings yield. Its financial ratios are slightly favorable overall, with efficient capital use and moderate debt, though profitability remains weak. The company’s MOAT evaluation is very favorable, showing growing ROIC and a durable competitive advantage, despite distress-zone bankruptcy risk indicators and a bearish stock trend.
Investors prioritizing durable competitive advantage and value creation might view StoneCo’s profile as attractive due to its very favorable MOAT and improving financial ratios, whereas those valuing consistent profitability and established financial metrics could find Gen Digital’s favorable income statement and ratings suggestive of stability, despite its high leverage and value destruction signals.
Disclaimer: Investment carries a risk of loss of initial capital. The past performance is not a reliable indicator of future results. Be sure to understand risks before making an investment decision.
Go Further
I encourage you to read the complete analyses of Gen Digital Inc. and StoneCo Ltd. to enhance your investment decisions: