In today’s fast-evolving cybersecurity landscape, Palo Alto Networks, Inc. (PANW) and Gen Digital Inc. (GEN) stand out as key players offering innovative software infrastructure solutions. Both companies serve overlapping markets but cater to different customer segments—enterprise versus consumer cyber safety—highlighting contrasting growth strategies. This article will explore their strengths and risks to help you decide which cybersecurity stock deserves a place in your investment portfolio.

Table of contents
Companies Overview
I will begin the comparison between Palo Alto Networks and Gen Digital by providing an overview of these two companies and their main differences.
Palo Alto Networks Overview
Palo Alto Networks, Inc. is a leading provider of cybersecurity solutions globally. The company focuses on firewall appliances, software, and subscription services that cover threat prevention, malware protection, and cloud security. It serves medium to large enterprises, service providers, and government entities across multiple industries, positioning itself as a comprehensive security infrastructure provider headquartered in Santa Clara, California.
Gen Digital Overview
Gen Digital Inc. specializes in consumer-focused cyber safety solutions, offering products such as Norton 360 and LifeLock identity theft protection. Its services include VPN, privacy monitoring, fraud detection, and social media security, targeting customers across the US, Europe, and Asia Pacific. Based in Tempe, Arizona, Gen Digital markets its products through retailers, telecom providers, and e-commerce platforms, emphasizing personal cybersecurity and privacy.
Key similarities and differences
Both companies operate in the software infrastructure industry with a focus on cybersecurity, but they target different customer segments. Palo Alto Networks primarily serves enterprises and government clients with comprehensive security platforms, while Gen Digital targets individual consumers with cyber safety and identity protection services. Their business models differ accordingly, with Palo Alto offering extensive professional services and Gen Digital emphasizing subscription-based consumer products.
Income Statement Comparison
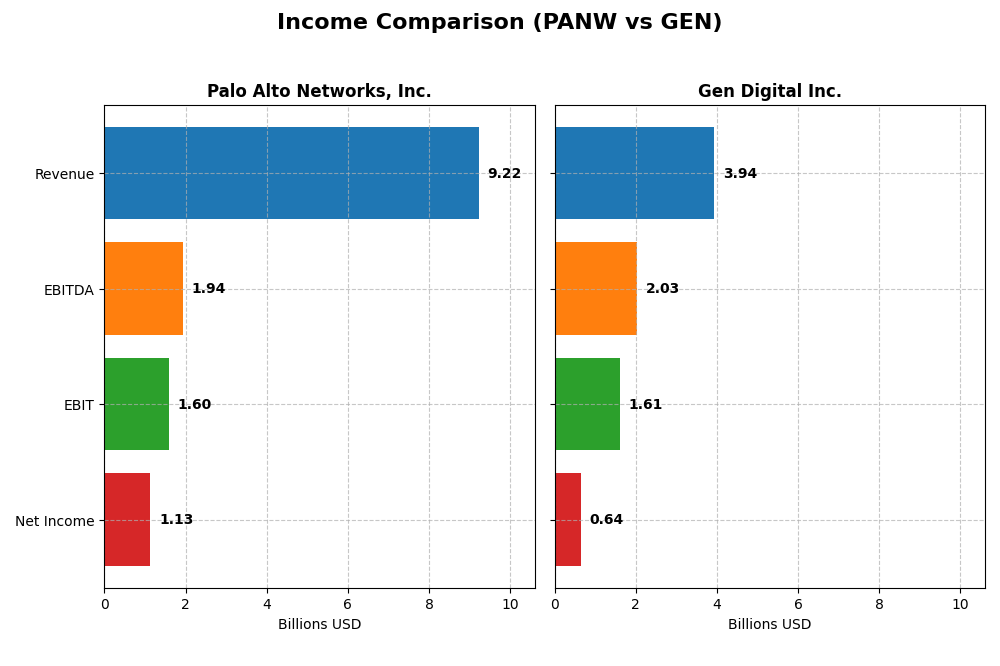
The following table summarizes the key income statement metrics for Palo Alto Networks, Inc. and Gen Digital Inc. for their most recent fiscal year, highlighting their financial scale and profitability.
| Metric | Palo Alto Networks, Inc. | Gen Digital Inc. |
|---|---|---|
| Market Cap | 128B | 16B |
| Revenue | 9.22B | 3.94B |
| EBITDA | 1.94B | 2.03B |
| EBIT | 1.60B | 1.61B |
| Net Income | 1.13B | 643M |
| EPS | 1.71 | 1.04 |
| Fiscal Year | 2025 | 2025 |
Income Statement Interpretations
Palo Alto Networks, Inc.
Palo Alto Networks demonstrated strong revenue growth from $4.3B in 2021 to $9.2B in 2025, with net income recovering from a loss of $498M in 2021 to $1.13B in 2025. Margins improved notably, with a gross margin of 73.4% and EBIT margin of 17.3% in 2025. However, net margin and EPS declined sharply in the latest year despite solid top-line growth.
Gen Digital Inc.
Gen Digital showed steady revenue growth from $2.55B in 2021 to $3.93B in 2025, while net income rose from $554M to $643M over the same period. Margins remained robust, with an 80.3% gross margin and a high EBIT margin of 40.8% in 2025. The company posted moderate growth in revenue and earnings per share in 2025, with net margin stable but interest expense relatively high.
Which one has the stronger fundamentals?
Palo Alto Networks exhibits higher revenue and net income growth with improving margins over the period, despite recent net margin and EPS setbacks. Gen Digital maintains stronger profitability ratios and more stable net margins but with slower growth and higher interest costs. Both show favorable income statements, with Palo Alto Networks reflecting more dynamic expansion and Gen Digital more consistent profitability.
Financial Ratios Comparison
The table below presents a side-by-side comparison of key financial ratios for Palo Alto Networks, Inc. (PANW) and Gen Digital Inc. (GEN) based on their most recent fiscal year data.
| Ratios | Palo Alto Networks, Inc. (2025) | Gen Digital Inc. (2025) |
|---|---|---|
| ROE | 14.49% | 28.34% |
| ROIC | 5.67% | 7.77% |
| P/E | 101.4 | 25.4 |
| P/B | 14.7 | 7.19 |
| Current Ratio | 0.89 | 0.51 |
| Quick Ratio | 0.89 | 0.51 |
| D/E (Debt-to-Equity) | 0.04 | 3.66 |
| Debt-to-Assets | 1.43% | 53.7% |
| Interest Coverage | 414.3 | 2.79 |
| Asset Turnover | 0.39 | 0.25 |
| Fixed Asset Turnover | 12.56 | 36.1 |
| Payout ratio | 0% | 48.7% |
| Dividend yield | 0% | 1.92% |
Interpretation of the Ratios
Palo Alto Networks, Inc.
Palo Alto Networks shows a mix of strong and weak ratios, with favorable net margin at 12.3% and excellent interest coverage of 532.53, but a high price-to-earnings ratio of 101.43 and low current ratio at 0.89 raise concerns. The company does not pay dividends, reflecting a reinvestment strategy in growth and R&D, with no payout risks.
Gen Digital Inc.
Gen Digital exhibits favorable profitability ratios such as a 16.34% net margin and 28.34% return on equity, but weak liquidity and leverage metrics, including a low current ratio of 0.51 and high debt-to-assets at 53.66%. It pays dividends with a modest 1.92% yield, balancing shareholder returns with financial constraints.
Which one has the best ratios?
Palo Alto Networks’ ratios are slightly favorable overall, supported by solid profitability and low debt, despite valuation and liquidity concerns. Gen Digital faces more unfavorable ratios, particularly in leverage and liquidity, despite better returns and dividend payouts. Thus, Palo Alto Networks holds a marginal advantage in ratio quality.
Strategic Positioning
This section compares the strategic positioning of Palo Alto Networks and Gen Digital, including market position, key segments, and exposure to disruption:
Palo Alto Networks, Inc.
- Leading cybersecurity provider with strong NASDAQ presence; faces competitive pressure in enterprise cybersecurity.
- Generates revenue mainly from subscriptions, products, and support across enterprise security solutions.
- Exposed to technological disruption through evolving cybersecurity threats and cloud security innovations.
Gen Digital Inc.
- Consumer-focused cyber safety company with NASDAQ listing; competes in crowded consumer cybersecurity market.
- Revenue derives from cyber safety subscriptions and legacy products targeting consumers globally.
- Faces disruption risks from changing consumer cyber safety demands and emerging privacy technologies.
Palo Alto Networks, Inc. vs Gen Digital Inc. Positioning
Palo Alto Networks pursues a diversified approach with enterprise cybersecurity products and services, while Gen Digital concentrates on consumer cyber safety subscriptions. Diversification offers broader industry reach; concentration targets consumer market specialization.
Which has the best competitive advantage?
Both companies currently shed value with ROIC below WACC. Palo Alto Networks shows improving profitability, whereas Gen Digital experiences declining returns, indicating a relatively stronger but still unfavorable moat position for Palo Alto Networks.
Stock Comparison
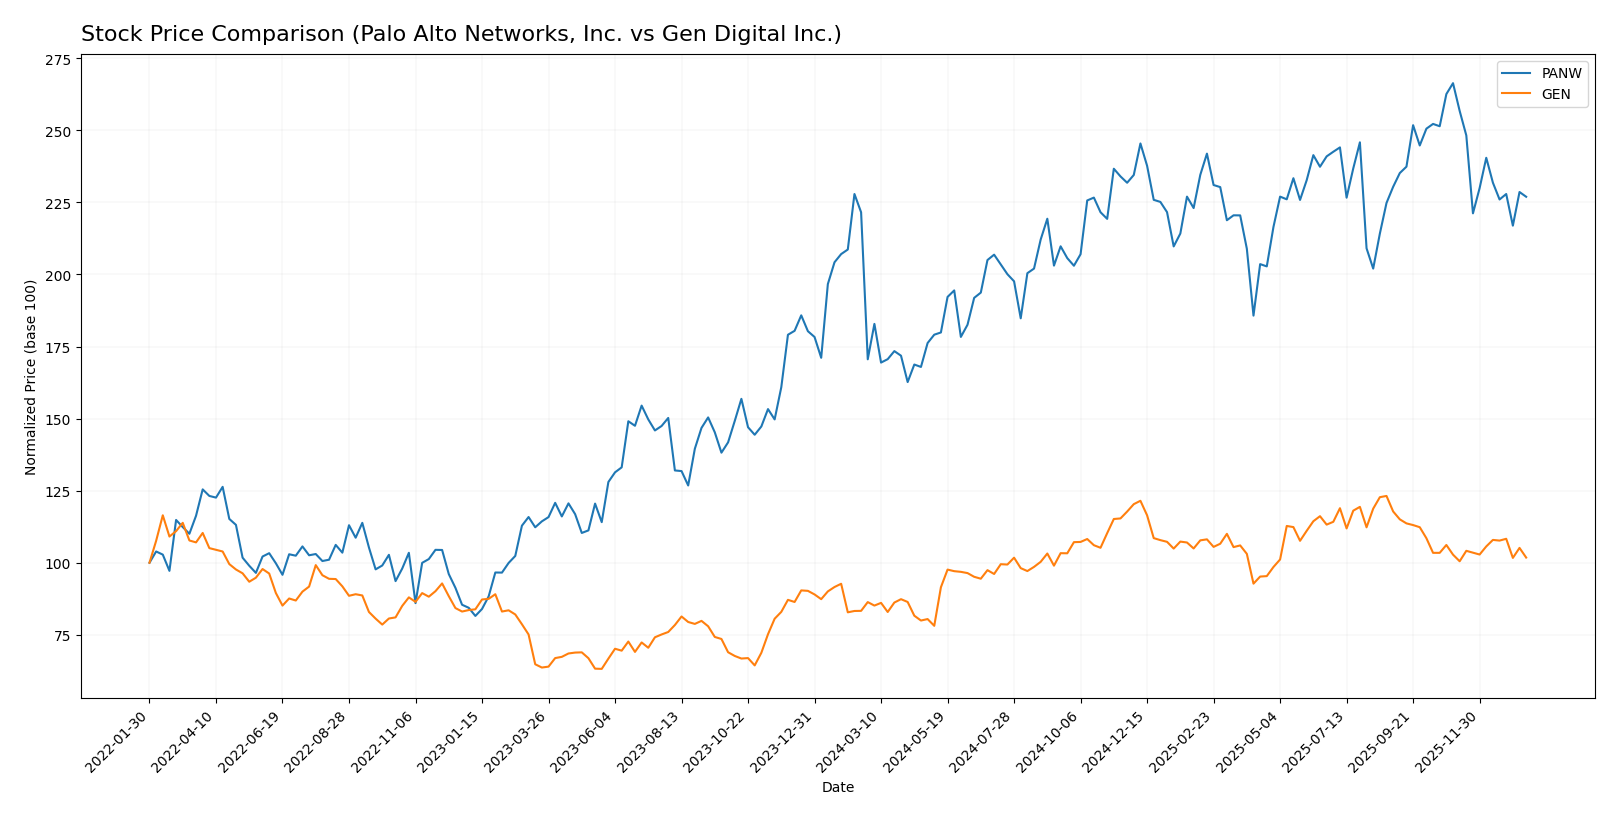
The stock prices of Palo Alto Networks, Inc. and Gen Digital Inc. have shown significant upward movements over the past 12 months, with notable deceleration in their bullish trends and recent shifts in trading dominance.
Trend Analysis
Palo Alto Networks, Inc. exhibited a bullish trend over the past year with a 33.05% price increase, although the trend showed deceleration. The stock reached a high of 220.24 and a low of 134.51, with a recent downturn of -14.79%.
Gen Digital Inc. also followed a bullish trend in the last 12 months, gaining 17.89%. This trend similarly decelerated, with the highest price at 31.58 and lowest at 20.03. The recent price change was slightly negative at -0.99%, indicating near stability.
Comparing both companies, Palo Alto Networks delivered the highest market performance with a 33.05% gain over the year, outperforming Gen Digital’s 17.89% rise.
Target Prices
The consensus target prices reflect cautious optimism from analysts for both Palo Alto Networks, Inc. and Gen Digital Inc.
| Company | Target High | Target Low | Consensus |
|---|---|---|---|
| Palo Alto Networks, Inc. | 265 | 157 | 231.07 |
| Gen Digital Inc. | 32 | 31 | 31.5 |
Analysts expect Palo Alto Networks’ stock to appreciate significantly from its current price of $187.66, indicating strong growth potential. Gen Digital’s target consensus suggests a modest upside compared to its current price of $26.1, reflecting more conservative expectations.
Analyst Opinions Comparison
This section compares analysts’ ratings and grades for Palo Alto Networks, Inc. (PANW) and Gen Digital Inc. (GEN):
Rating Comparison
PANW Rating
- Rating: B, considered Very Favorable overall.
- Discounted Cash Flow Score: 4, Favorable indication of valuation.
- ROE Score: 4, Favorable, showing efficient profit generation from equity.
- ROA Score: 3, Moderate in asset utilization efficiency.
- Debt To Equity Score: 4, Favorable, indicating lower financial risk.
- Overall Score: 3, Moderate overall financial standing.
GEN Rating
- Rating: B, also considered Very Favorable overall.
- Discounted Cash Flow Score: 5, Very Favorable, suggesting strong valuation.
- ROE Score: 5, Very Favorable, indicating higher efficiency in equity returns.
- ROA Score: 3, Moderate, equal asset utilization efficiency as PANW.
- Debt To Equity Score: 1, Very Unfavorable, implying higher financial risk.
- Overall Score: 3, Moderate overall financial standing.
Which one is the best rated?
Based solely on the provided data, GEN has higher scores in discounted cash flow and return on equity, indicating stronger valuation and profitability metrics. However, PANW exhibits better debt to equity standing, signaling lower financial risk. Overall scores are equal.
Scores Comparison
Here is a comparison of the Altman Z-Score and Piotroski Score for both companies:
Palo Alto Networks, Inc. Scores
- Altman Z-Score: 5.95, indicating a safe zone with low risk
- Piotroski Score: 6, reflecting average financial strength
Gen Digital Inc. Scores
- Altman Z-Score: 1.25, indicating distress zone risk
- Piotroski Score: 6, reflecting average financial strength
Which company has the best scores?
Palo Alto Networks shows a significantly higher Altman Z-Score, indicating greater financial stability compared to Gen Digital, while both companies share the same average Piotroski Score of 6.
Grades Comparison
Here is a comparison of the recent grades and ratings assigned to Palo Alto Networks, Inc. and Gen Digital Inc.:
Palo Alto Networks, Inc. Grades
This table summarizes recent grades and rating actions by key grading companies for Palo Alto Networks, Inc.:
| Grading Company | Action | New Grade | Date |
|---|---|---|---|
| UBS | Maintain | Neutral | 2026-01-13 |
| Piper Sandler | Maintain | Overweight | 2026-01-05 |
| Guggenheim | Upgrade | Neutral | 2026-01-05 |
| Morgan Stanley | Maintain | Overweight | 2025-12-18 |
| Goldman Sachs | Maintain | Buy | 2025-11-21 |
| HSBC | Downgrade | Reduce | 2025-11-21 |
| Needham | Maintain | Buy | 2025-11-20 |
| WestPark Capital | Maintain | Hold | 2025-11-20 |
| Bernstein | Maintain | Outperform | 2025-11-20 |
| DA Davidson | Maintain | Buy | 2025-11-20 |
Overall, Palo Alto Networks shows a generally positive grading trend with several buy and overweight ratings, though a downgrade to reduce by HSBC signals some caution.
Gen Digital Inc. Grades
This table summarizes recent grades and rating actions by key grading companies for Gen Digital Inc.:
| Grading Company | Action | New Grade | Date |
|---|---|---|---|
| RBC Capital | Maintain | Sector Perform | 2025-11-07 |
| Evercore ISI Group | Maintain | Outperform | 2025-11-07 |
| Morgan Stanley | Maintain | Equal Weight | 2025-09-02 |
| Barclays | Maintain | Equal Weight | 2025-08-08 |
| Wells Fargo | Maintain | Overweight | 2025-08-08 |
| RBC Capital | Maintain | Sector Perform | 2025-08-08 |
| Barclays | Maintain | Equal Weight | 2025-07-14 |
| RBC Capital | Maintain | Sector Perform | 2025-05-07 |
| Morgan Stanley | Maintain | Equal Weight | 2025-04-16 |
| RBC Capital | Maintain | Sector Perform | 2025-01-31 |
Gen Digital’s grades are mostly stable with a mix of equal weight and sector perform ratings, complemented by a few outperform and overweight ratings.
Which company has the best grades?
Palo Alto Networks has generally stronger grades, with a higher number of buy and overweight ratings compared to Gen Digital’s more moderate equal weight and sector perform consensus. This may indicate stronger analyst confidence in Palo Alto Networks’ potential performance, which could influence investor sentiment and portfolio positioning accordingly.
Strengths and Weaknesses
Below is a comparative overview of key strengths and weaknesses for Palo Alto Networks, Inc. (PANW) and Gen Digital Inc. (GEN) based on recent financial and strategic data.
| Criterion | Palo Alto Networks, Inc. (PANW) | Gen Digital Inc. (GEN) |
|---|---|---|
| Diversification | Strong subscription-based model with growing product and support revenues totaling approx. $9.2B in 2025 | Revenue heavily concentrated in Cyber Safety (~$3.9B in 2025) with minor legacy business |
| Profitability | Moderate net margin at 12.3%, neutral ROIC (5.67%) but ROIC below WACC (-1.7%), indicating value shedding | Higher net margin (16.34%) and ROIC (7.77%), but ROIC declining and slightly below WACC, signaling value erosion |
| Innovation | Growing ROIC trend (+224%), indicative of improving operational efficiency and innovation pace | Declining ROIC trend (-50%), raising concerns about innovation sustainability |
| Global presence | Large global footprint with diverse subscription services and support | Focused mainly on consumer security markets with some legacy segments |
| Market Share | Leading player in cybersecurity with expanding subscription base | Strong in consumer security but facing competitive pressures and declining profitability |
Key takeaways: Both companies face challenges in value creation as their ROICs are below WACC, with Palo Alto Networks showing improving profitability and innovation trends, while Gen Digital struggles with declining returns and higher financial leverage. Risk management favors cautious monitoring of Gen’s profitability trajectory versus Palo Alto’s growth in operational efficiency.
Risk Analysis
Below is a comparison of key risks for Palo Alto Networks, Inc. (PANW) and Gen Digital Inc. (GEN) based on their latest financial and operational data from 2025.
| Metric | Palo Alto Networks, Inc. (PANW) | Gen Digital Inc. (GEN) |
|---|---|---|
| Market Risk | Moderate (beta 0.75) | Higher (beta 1.08) |
| Debt level | Low (debt-to-equity 0.04) | High (debt-to-equity 3.66) |
| Regulatory Risk | Moderate (cybersecurity sector) | Moderate (consumer cybersecurity) |
| Operational Risk | Moderate (large employee base 15.8K) | Moderate (smaller workforce 3.4K) |
| Environmental Risk | Low (technology sector exposure) | Low (technology sector exposure) |
| Geopolitical Risk | Moderate (US-based global operations) | Moderate (US-based global operations) |
The most impactful risk lies with Gen Digital’s elevated debt levels and low liquidity, placing it in financial distress (Altman Z-score 1.25), increasing bankruptcy risk. Palo Alto Networks maintains a solid balance sheet (Altman Z-score 5.95) and lower market volatility, making it relatively less risky. Investors should weigh Gen’s financial leverage against its favorable operational margins carefully.
Which Stock to Choose?
Palo Alto Networks, Inc. (PANW) shows strong income growth with a 117% revenue increase over 2021-2025 and favorable profitability metrics despite recent net margin and EPS declines. Its financial ratios are slightly favorable, supported by low debt and strong interest coverage, while its rating is very favorable with moderate overall scores.
Gen Digital Inc. (GEN) presents moderate income growth of 54% over the period, with a higher net margin and ROE than PANW but also significant debt levels. Financial ratios are slightly unfavorable due to leverage and liquidity concerns, though its rating remains very favorable with strong DCF and ROE scores but poor debt-to-equity metrics.
For investors prioritizing growth and improving profitability, PANW’s favorable income trend and strengthening returns might appear attractive, while risk-averse investors or those focused on stable income may see GEN’s higher profitability but elevated debt as a cautionary signal. Thus, the choice could depend on tolerance for leverage and preference for growth versus stability.
Disclaimer: Investment carries a risk of loss of initial capital. The past performance is not a reliable indicator of future results. Be sure to understand risks before making an investment decision.
Go Further
I encourage you to read the complete analyses of Palo Alto Networks, Inc. and Gen Digital Inc. to enhance your investment decisions: