Palantir Technologies Inc. and Gen Digital Inc. are two influential players in the software infrastructure industry, each driving innovation in data analytics and cybersecurity, respectively. Palantir excels in advanced data integration and intelligence solutions, while Gen Digital focuses on comprehensive cyber safety for consumers worldwide. Their overlapping tech domains make this comparison insightful for investors seeking growth in technology. Let’s explore which company presents the most compelling investment opportunity today.

Table of contents
Companies Overview
I will begin the comparison between Palantir Technologies Inc. and Gen Digital Inc. by providing an overview of these two companies and their main differences.
Palantir Technologies Inc. Overview
Palantir Technologies Inc. develops software platforms primarily for the intelligence community, focusing on counterterrorism investigations and operations globally. Its flagship products include Palantir Gotham, Foundry, Apollo, and an Artificial Intelligence Platform, which enable data integration, analysis, and real-world operational responses. With a market cap of $390.5B, Palantir operates within the software infrastructure industry and is headquartered in Denver, Colorado.
Gen Digital Inc. Overview
Gen Digital Inc. specializes in consumer cyber safety solutions, offering products like Norton 360, LifeLock identity protection, and Avira Security across multiple regions worldwide. The company provides various services including VPN, dark web monitoring, and online reputation management. Headquartered in Tempe, Arizona, Gen Digital holds a market cap of $16.1B and operates in the same software infrastructure sector, focusing mainly on cybersecurity for individuals and families.
Key similarities and differences
Both companies operate in the technology sector, specifically within software infrastructure, but target different markets: Palantir serves government and enterprise clients with data analytics and intelligence platforms, while Gen Digital focuses on consumer cybersecurity solutions. Palantir’s offerings emphasize large-scale data integration and AI, whereas Gen Digital provides protection against online threats and privacy risks. Market capitalization and employee count also differ significantly, reflecting their distinct operational scales.
Income Statement Comparison
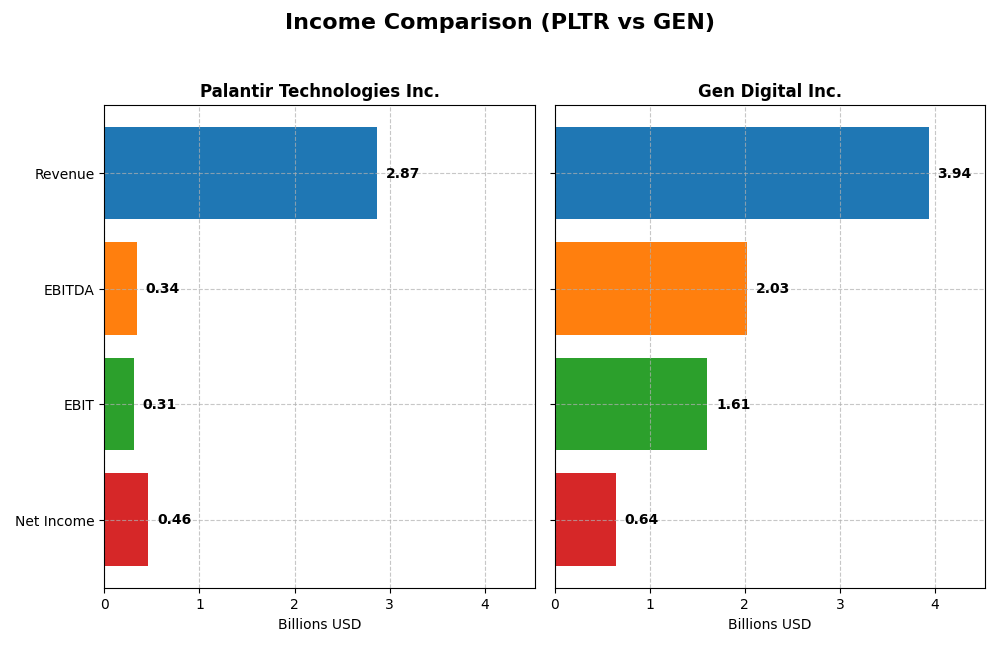
The table below presents a side-by-side comparison of key income statement metrics for Palantir Technologies Inc. and Gen Digital Inc. for their most recent fiscal year.
| Metric | Palantir Technologies Inc. | Gen Digital Inc. |
|---|---|---|
| Market Cap | 390.5B | 16.1B |
| Revenue | 2.87B | 3.94B |
| EBITDA | 342M | 2.03B |
| EBIT | 310M | 1.61B |
| Net Income | 462M | 643M |
| EPS | 0.21 | 1.04 |
| Fiscal Year | 2024 | 2025 |
Income Statement Interpretations
Palantir Technologies Inc.
Palantir Technologies has shown strong revenue growth from 2020 to 2024, increasing from 1.1B to 2.9B USD, alongside a significant net income turnaround from a -1.17B USD loss in 2020 to a 462M USD profit in 2024. Margins improved steadily, with gross margin at 80.25% and net margin at 16.13% in 2024. The latest year reflected robust growth in revenue and profitability, with EBIT growing 159% and net margin up 71%.
Gen Digital Inc.
Gen Digital’s revenue rose from 2.55B USD in 2021 to 3.94B USD in 2025, accompanied by fluctuations in net income, peaking at 1.33B USD in 2023 before declining to 643M USD in 2025. Margins remain strong, with a gross margin near 80% and a high EBIT margin of 40.8% in 2025, though interest expenses negatively impact net results. Recent growth slowed to 3.6% revenue increase, with net margin growth neutral at 2.3%.
Which one has the stronger fundamentals?
Palantir demonstrates stronger fundamentals with consistent revenue and net income growth, improving margins, and zero interest expenses, indicating efficient operations and risk control. Gen Digital has superior EBIT margins but faces unfavorable interest expenses and margin contraction over the longer term. Both companies have favorable income statements overall, but Palantir’s higher growth rates and margin expansions suggest a more robust financial trajectory.
Financial Ratios Comparison
The table below presents a side-by-side comparison of key financial ratios for Palantir Technologies Inc. and Gen Digital Inc. based on their most recent fiscal year data.
| Ratios | Palantir Technologies Inc. (2024) | Gen Digital Inc. (2025) |
|---|---|---|
| ROE | 9.24% | 28.34% |
| ROIC | 5.51% | 7.77% |
| P/E | 368.2 | 25.36 |
| P/B | 34.01 | 7.19 |
| Current Ratio | 5.96 | 0.51 |
| Quick Ratio | 5.96 | 0.51 |
| D/E | 0.048 | 3.66 |
| Debt-to-Assets | 3.77% | 53.66% |
| Interest Coverage | 0 (not reported) | 2.79 |
| Asset Turnover | 0.452 | 0.254 |
| Fixed Asset Turnover | 11.92 | 36.10 |
| Payout ratio | 0% | 48.7% |
| Dividend yield | 0% | 1.92% |
Interpretation of the Ratios
Palantir Technologies Inc.
Palantir shows a mixed ratio profile with strengths in net margin (16.13%) and favorable debt metrics such as a low debt-to-equity ratio (0.05) and minimal debt-to-assets (3.77%). However, challenges include a high P/E ratio (368.2), weak returns on equity (9.24%) relative to WACC (11.11%), and an unusually high current ratio (5.96) suggesting inefficient asset use. The company does not pay dividends, likely reflecting a reinvestment strategy or focus on growth.
Gen Digital Inc.
Gen Digital presents favorable net margin (16.34%) and robust return on equity (28.34%) alongside a lower WACC (7.82%), but struggles with liquidity given its low current and quick ratios (0.51). Debt levels are high, with debt-to-equity at 3.66 and debt-to-assets at 53.66%, raising solvency concerns. The company pays dividends with a modest yield of 1.92%, indicating some shareholder returns but with neutral coverage.
Which one has the best ratios?
Both companies are rated slightly unfavorable overall. Palantir excels in low leverage and profitability margins but suffers from valuation and efficiency issues. Gen Digital demonstrates stronger returns and dividend payments but faces liquidity and high debt risks. Each shows distinct trade-offs, reflecting different financial strengths and vulnerabilities.
Strategic Positioning
This section compares the strategic positioning of Palantir Technologies Inc. and Gen Digital Inc., focusing on market position, key segments, and exposure to technological disruption:
Palantir Technologies Inc.
- Leading software infrastructure provider with considerable market cap facing competition.
- Serves government intelligence and commercial sectors, driven by data analytics software.
- Provides advanced AI-driven platforms, exposed to evolving software and AI technological changes.
Gen Digital Inc.
- Mid-sized software infrastructure player with moderate competitive pressure.
- Focuses on consumer cyber safety solutions across multiple global regions.
- Offers cybersecurity, privacy, and identity protection solutions with evolving threats.
Palantir Technologies Inc. vs Gen Digital Inc. Positioning
Palantir has a diversified approach serving government and commercial sectors with advanced AI platforms, while Gen Digital concentrates on consumer cyber safety products worldwide. Palantir’s scale provides market influence; Gen Digital focuses on specialized cybersecurity services.
Which has the best competitive advantage?
Both companies are currently shedding value; however, Palantir shows a growing ROIC trend suggesting improving profitability, whereas Gen Digital faces declining ROIC, indicating weakening profitability and a less favorable competitive position.
Stock Comparison
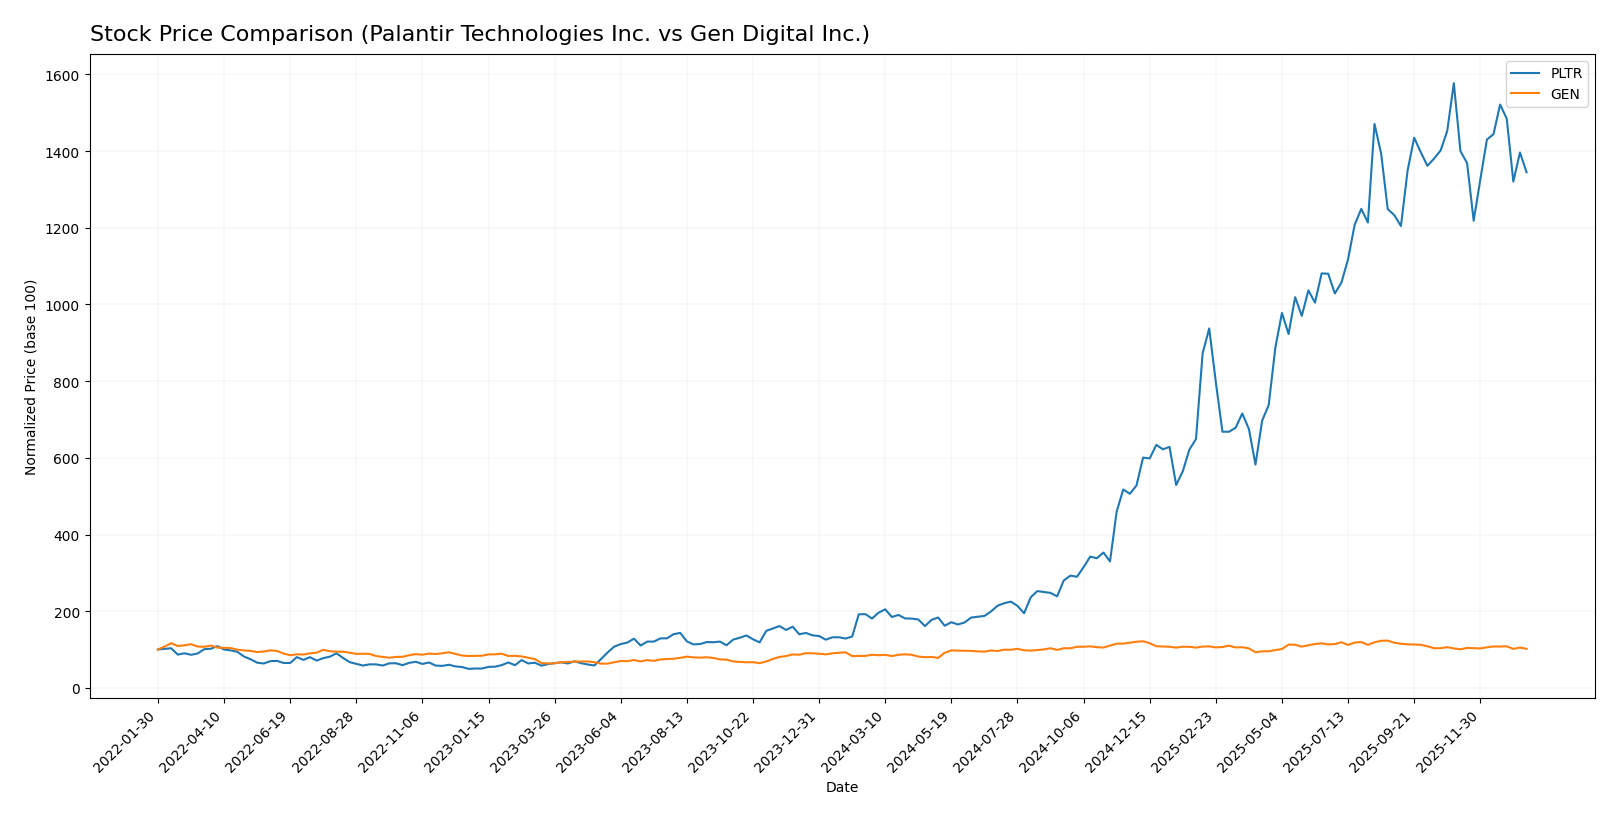
Over the past 12 months, Palantir Technologies Inc. and Gen Digital Inc. exhibited notable price movements with contrasting recent trends, reflecting distinct trading dynamics and volume patterns.
Trend Analysis
Palantir Technologies Inc. showed a strong bullish trend over the past year, with a 644.28% price increase, decelerating momentum, and high volatility (std deviation 59.91). Recent months indicate a bearish reversal with a -14.72% decline.
Gen Digital Inc. experienced a moderate bullish trend over the year, rising 17.89% with decelerating momentum and low volatility (std deviation 2.59). Its recent trend is neutral, showing a slight -0.99% dip but stable slope.
Comparing the two, Palantir delivered the highest market performance over the past year despite recent weakness, while Gen Digital’s gains remained modest and stable.
Target Prices
The consensus target prices from recognized analysts indicate potential upside for both Palantir Technologies Inc. and Gen Digital Inc.
| Company | Target High | Target Low | Consensus |
|---|---|---|---|
| Palantir Technologies Inc. | 223 | 160 | 198.33 |
| Gen Digital Inc. | 32 | 31 | 31.5 |
Analysts expect Palantir’s stock to appreciate from its current price of 170.96 toward the consensus near 198.33, while Gen Digital’s consensus target of 31.5 suggests a moderate rise from its current 26.1 price.
Analyst Opinions Comparison
This section compares analysts’ ratings and financial scores for Palantir Technologies Inc. and Gen Digital Inc.:
Rating Comparison
Palantir Technologies Inc. Rating
- Rating: B, considered Very Favorable by analysts.
- Discounted Cash Flow Score: Moderate at 2 out of 5.
- ROE Score: Favorable at 4 out of 5, showing good efficiency.
- ROA Score: Very Favorable at 5 out of 5, excellent asset use.
- Debt To Equity Score: Favorable at 4 out of 5, lower risk.
- Overall Score: Moderate at 3 out of 5.
Gen Digital Inc. Rating
- Rating: B, considered Very Favorable by analysts.
- Discounted Cash Flow Score: Very Favorable at 5 out of 5.
- ROE Score: Very Favorable at 5 out of 5, indicating strong profit generation.
- ROA Score: Moderate at 3 out of 5, average asset utilization.
- Debt To Equity Score: Very Unfavorable at 1 out of 5, higher financial risk.
- Overall Score: Moderate at 3 out of 5.
Which one is the best rated?
Both companies hold the same overall rating of B and an identical overall score of 3. Palantir shows stronger debt management and asset utilization, while Gen excels in discounted cash flow and return on equity.
Scores Comparison
The following table compares the Altman Z-Score and Piotroski Score of Palantir Technologies Inc. and Gen Digital Inc.:
PLTR Scores
- Altman Z-Score: 172.6, indicating a safe zone
- Piotroski Score: 7, classified as strong
GEN Scores
- Altman Z-Score: 1.25, indicating a distress zone
- Piotroski Score: 6, classified as average
Which company has the best scores?
Based on the provided data, Palantir Technologies shows a significantly higher Altman Z-Score in the safe zone and a stronger Piotroski Score compared to Gen Digital, which is in the distress zone with an average Piotroski Score.
Grades Comparison
Here is a detailed comparison of the grading and rating trends for Palantir Technologies Inc. and Gen Digital Inc.:
Palantir Technologies Inc. Grades
The following table summarizes recent grades issued by recognized financial institutions for Palantir Technologies Inc.:
| Grading Company | Action | New Grade | Date |
|---|---|---|---|
| Citigroup | Buy | Buy | 2026-01-12 |
| RBC Capital | Maintain | Underperform | 2025-11-04 |
| Baird | Maintain | Neutral | 2025-11-04 |
| Cantor Fitzgerald | Maintain | Neutral | 2025-11-04 |
| Goldman Sachs | Maintain | Neutral | 2025-11-04 |
| Mizuho | Maintain | Neutral | 2025-11-04 |
| UBS | Maintain | Neutral | 2025-11-04 |
| Piper Sandler | Maintain | Overweight | 2025-11-04 |
| DA Davidson | Maintain | Neutral | 2025-11-04 |
| Morgan Stanley | Maintain | Equal Weight | 2025-11-04 |
Overall, Palantir’s recent grades are mostly neutral with one upgrade to Buy by Citigroup, indicating a mixed but cautiously optimistic outlook.
Gen Digital Inc. Grades
Below is a summary of recent grades for Gen Digital Inc. from established grading firms:
| Grading Company | Action | New Grade | Date |
|---|---|---|---|
| RBC Capital | Maintain | Sector Perform | 2025-11-07 |
| Evercore ISI Group | Maintain | Outperform | 2025-11-07 |
| Morgan Stanley | Maintain | Equal Weight | 2025-09-02 |
| Barclays | Maintain | Equal Weight | 2025-08-08 |
| Wells Fargo | Maintain | Overweight | 2025-08-08 |
| RBC Capital | Maintain | Sector Perform | 2025-08-08 |
| Barclays | Maintain | Equal Weight | 2025-07-14 |
| RBC Capital | Maintain | Sector Perform | 2025-05-07 |
| Morgan Stanley | Maintain | Equal Weight | 2025-04-16 |
| RBC Capital | Maintain | Sector Perform | 2025-01-31 |
Gen Digital’s grades consistently show a moderate positive bias with multiple Outperform and Overweight ratings, reflecting a generally favorable sentiment.
Which company has the best grades?
Gen Digital Inc. has received relatively stronger and more consistent positive grades compared to Palantir Technologies Inc., whose ratings are mostly neutral with one recent upgrade. This suggests Gen Digital may present a more confident analyst outlook, potentially influencing investor sentiment toward steadier performance expectations.
Strengths and Weaknesses
Below is a comparative table highlighting key strengths and weaknesses of Palantir Technologies Inc. (PLTR) and Gen Digital Inc. (GEN) based on the most recent financial and operational data.
| Criterion | Palantir Technologies Inc. (PLTR) | Gen Digital Inc. (GEN) |
|---|---|---|
| Diversification | Balanced revenue mix: Government $1.57B, Commercial $1.30B (2024) | Primarily cybersecurity-focused: $3.89B Cyber Safety, minimal legacy segment ($50M) (2025) |
| Profitability | Net margin 16.13% (favorable); ROIC 5.51% (neutral); ROE 9.24% (unfavorable) | Net margin 16.34% (favorable); ROIC 7.77% (neutral); ROE 28.34% (favorable) |
| Innovation | High fixed asset turnover (11.92) indicating efficient use of assets; growing ROIC trend despite overall value destruction | High fixed asset turnover (36.1); but declining ROIC trend and overall value destruction |
| Global presence | Strong government contracts and growing commercial presence; diversified customer base | Global cybersecurity footprint; dominant in consumer security but high debt ratio limits flexibility |
| Market Share | Niche in government and commercial data analytics; market position still developing | Leading in consumer cybersecurity; legacy segment shrinking, focusing on core products |
Key takeaways: Palantir shows promising growth in profitability and asset utilization but struggles with overall value creation. Gen Digital maintains strong profitability and market leadership but faces challenges with declining ROIC and higher leverage, warranting cautious evaluation.
Risk Analysis
Below is a comparative overview of key risk factors affecting Palantir Technologies Inc. (PLTR) and Gen Digital Inc. (GEN) as of the most recent data in 2026:
| Metric | Palantir Technologies Inc. (PLTR) | Gen Digital Inc. (GEN) |
|---|---|---|
| Market Risk | High beta 1.545; volatile price range (66.12-207.52 USD) | Moderate beta 1.084; narrower price range (22.74-32.22 USD) |
| Debt level | Very low debt-to-equity 0.05; debt to assets 3.77% (favorable) | High debt-to-equity 3.66; debt to assets 53.66% (unfavorable) |
| Regulatory Risk | Moderate, given U.S. intelligence contracts and export controls | Moderate, due to privacy and cybersecurity regulations worldwide |
| Operational Risk | Dependent on cutting-edge AI tech; 4001 employees; software platform complexity | Cybersecurity product delivery across multiple regions; 3400 employees |
| Environmental Risk | Low direct impact; technology sector, limited physical footprint | Low direct impact; technology sector with global consumer base |
| Geopolitical Risk | Exposure to international government contracts, sensitive data handling | Exposure to global markets with privacy laws and geopolitical tensions |
I highlight that Palantir’s most impactful risks are market volatility and regulatory scrutiny related to government contracts. Gen Digital faces significant financial risk from its high leverage and operational challenges in a highly regulated cybersecurity environment. Palantir’s strong balance sheet and low debt mitigate financial risk, whereas Gen’s debt level and liquidity ratios signal caution. Both companies operate in sectors sensitive to geopolitical shifts and regulatory changes, but Palantir’s government ties increase its geopolitical exposure.
Which Stock to Choose?
Palantir Technologies Inc. (PLTR) shows a strong income evolution with revenue growth of 28.79% in the last year and a 162.25% increase over five years. Its financial ratios are mixed, with a favorable net margin of 16.13% but an unfavorable ROE of 9.24% and a high P/E of 368.2. The company maintains low debt levels and a very favorable rating of B, supported by strong Altman Z-Score and Piotroski scores, despite a slightly unfavorable global ratio evaluation.
Gen Digital Inc. (GEN) exhibits moderate income growth, with revenue up 3.55% last year and 54.25% over the period, alongside a favorable net margin of 16.34% and a strong ROE of 28.34%. Financially, it faces challenges with high debt ratios and a low current ratio, reflected in a slightly unfavorable global ratios opinion. GEN holds a very favorable overall rating of B but is in the distress zone per Altman Z-Score, indicating potential financial risk.
Considering ratings and financial evaluations, PLTR’s strong income growth and healthier balance sheet might appeal to growth-oriented or risk-tolerant investors. Conversely, GEN’s higher profitability metrics but financial leverage could be more suitable for investors focusing on quality and established earnings, albeit with higher risk tolerance. The choice could depend on the investor’s risk appetite and strategy regarding growth versus financial stability.
Disclaimer: Investment carries a risk of loss of initial capital. The past performance is not a reliable indicator of future results. Be sure to understand risks before making an investment decision.
Go Further
I encourage you to read the complete analyses of Palantir Technologies Inc. and Gen Digital Inc. to enhance your investment decisions: