In the fast-evolving tech landscape, Oracle Corporation (ORCL) and Gen Digital Inc. (GEN) stand out as major players in the software infrastructure industry. Oracle’s expansive cloud and enterprise software solutions contrast with Gen Digital’s focus on cybersecurity and consumer protection. Both companies address crucial digital needs, making their innovation strategies and market positioning key for investors seeking growth and stability. Let’s explore which company offers the most compelling opportunity for your portfolio.

Table of contents
Companies Overview
I will begin the comparison between Oracle Corporation and Gen Digital Inc. by providing an overview of these two companies and their main differences.
Oracle Overview
Oracle Corporation focuses on delivering enterprise information technology solutions worldwide. Its offerings encompass a broad range of cloud software applications, including ERP, supply chain, human capital management, and marketing solutions. Oracle also provides essential infrastructure technologies like its enterprise database, Java, middleware, and cloud-based compute and storage capabilities. Founded in 1977, Oracle is a major player in the software infrastructure industry, headquartered in Austin, Texas.
Gen Digital Overview
Gen Digital Inc. specializes in consumer cyber safety solutions across multiple global regions, including North America, Europe, and Asia Pacific. Its product portfolio features Norton 360 for malware protection, identity theft services via Norton and LifeLock, VPN solutions, and privacy tools like AntiTrack and Online Reputation Management. Established in 1982 and based in Tempe, Arizona, Gen Digital is recognized for its subscription-based cybersecurity offerings targeting individual consumers.
Key similarities and differences
Both Oracle and Gen Digital operate within the software infrastructure sector, but they serve distinct markets: Oracle primarily targets enterprises with a comprehensive suite of cloud and IT infrastructure products, while Gen Digital focuses on consumer cybersecurity solutions. Oracle’s business model includes cloud applications, database technologies, and hardware products, whereas Gen Digital emphasizes subscription services for cyber safety and privacy protection. The scale of Oracle is significantly larger, reflected in its market cap and employee count, compared to Gen Digital’s consumer-centric approach.
Income Statement Comparison
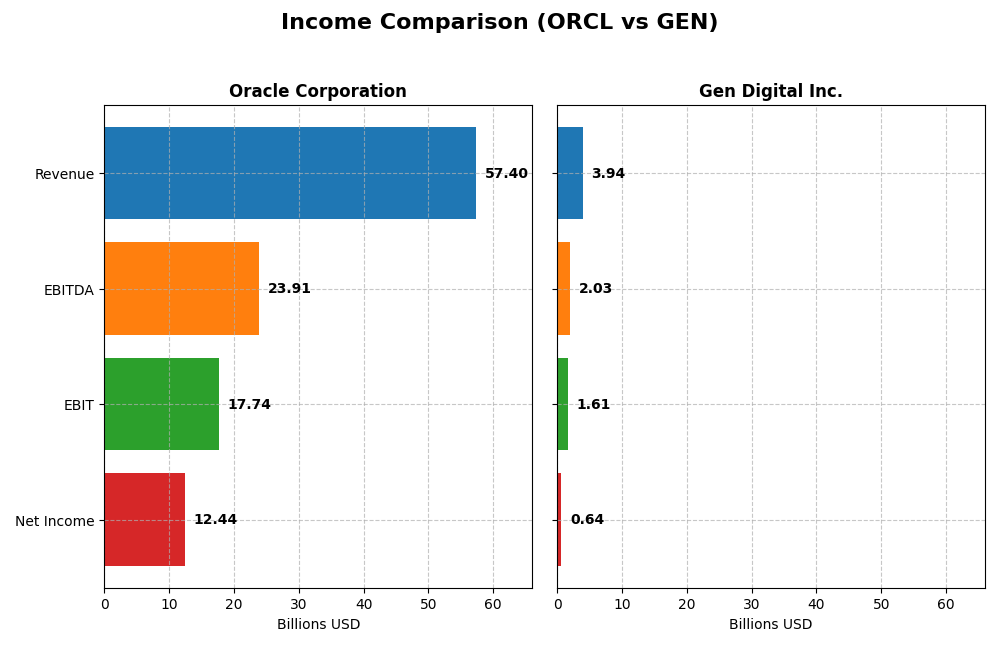
This table presents a side-by-side comparison of key income statement metrics for Oracle Corporation and Gen Digital Inc. for the most recent fiscal year available.
| Metric | Oracle Corporation | Gen Digital Inc. |
|---|---|---|
| Market Cap | 549B | 16.1B |
| Revenue | 57.4B | 3.9B |
| EBITDA | 23.9B | 2.0B |
| EBIT | 17.7B | 1.6B |
| Net Income | 12.4B | 643M |
| EPS | 4.46 | 1.04 |
| Fiscal Year | 2025 | 2025 |
Income Statement Interpretations
Oracle Corporation
Oracle’s revenue showed a strong upward trend, growing 41.8% from 2021 to 2025, with an 8.38% increase in the most recent year. Net income, however, declined by 9.48% over the period despite a 9.69% net margin improvement in the latest year. Margins remain robust, with a 70.51% gross margin and a 21.68% net margin, reflecting solid profitability and cost control in 2025.
Gen Digital Inc.
Gen Digital’s revenue rose 54.25% over the last five years, with a modest 3.55% increase in the most recent fiscal year. Net income increased 16.06% overall, supported by an 8.42% EPS growth in 2025. Gross and EBIT margins are strong at 80.28% and 40.84%, respectively, although interest expense is relatively high at 14.69%. Net margin growth has been somewhat inconsistent.
Which one has the stronger fundamentals?
Both companies show favorable income statement evaluations with strong revenue growth and margins. Oracle boasts higher absolute revenue and net income with stable margins, while Gen Digital demonstrates faster overall net income growth and higher EBIT margin but faces challenges with interest expenses. Oracle’s fundamentals lean on scale and profitability; Gen Digital excels in growth efficiency but with some margin pressure.
Financial Ratios Comparison
The table below presents the most recent key financial ratios for Oracle Corporation and Gen Digital Inc., offering a side-by-side view to facilitate comparison of their financial health and performance metrics as of fiscal year 2025.
| Ratios | Oracle Corporation (2025) | Gen Digital Inc. (2025) |
|---|---|---|
| ROE | 60.8% | 28.3% |
| ROIC | 10.9% | 7.8% |
| P/E | 37.1 | 25.4 |
| P/B | 22.6 | 7.2 |
| Current Ratio | 0.75 | 0.51 |
| Quick Ratio | 0.75 | 0.51 |
| D/E | 5.09 | 3.66 |
| Debt-to-Assets | 61.8% | 53.7% |
| Interest Coverage | 4.94 | 2.79 |
| Asset Turnover | 0.34 | 0.25 |
| Fixed Asset Turnover | 1.32 | 36.1 |
| Payout ratio | 38.1% | 48.7% |
| Dividend yield | 1.03% | 1.92% |
Interpretation of the Ratios
Oracle Corporation
Oracle shows strong profitability with a net margin of 21.68% and an impressive return on equity (ROE) of 60.84%. However, several liquidity and leverage ratios are weak, including a low current ratio of 0.75 and a high debt-to-equity ratio of 5.09. The company pays a dividend with a modest yield of 1.03%, supported by stable payout but facing risks due to some unfavorable leverage metrics.
Gen Digital Inc.
Gen Digital demonstrates solid profitability metrics, including a net margin of 16.34% and an ROE of 28.34%, with a neutral to favorable weighted average cost of capital (WACC) at 7.82%. Liquidity remains a concern, with a current ratio of 0.51. The company pays dividends yielding 1.92%, balanced by cautious financial management despite some unfavorable leverage and valuation ratios.
Which one has the best ratios?
Oracle exhibits stronger profitability indicators such as higher net margin and ROE but suffers from significant liquidity and leverage weaknesses. Gen Digital shows a more balanced profile with fewer unfavorable ratios and a slightly better overall liquidity position, though profitability is somewhat lower. Both have room for improvement, with Gen Digital’s ratios being slightly less unfavorable overall.
Strategic Positioning
This section compares the strategic positioning of Oracle Corporation and Gen Digital Inc., focusing on market position, key segments, and exposure to technological disruption:
Oracle Corporation
- Large market cap of 549B with significant competitive pressure in enterprise IT.
- Key segments include Cloud and License Business, Hardware, and Services.
- Exposure includes cloud computing, autonomous databases, and blockchain technologies.
Gen Digital Inc.
- Smaller market cap of 16B, competing in consumer cyber safety market.
- Focused mainly on consumer cyber safety, including Norton and LifeLock products.
- Exposure focused on cybersecurity solutions, VPN, identity theft, and privacy services.
Oracle Corporation vs Gen Digital Inc. Positioning
Oracle has a diversified approach with multiple business lines across enterprise IT, cloud, and hardware, providing broad market reach. Gen Digital concentrates on consumer cyber safety, focusing on privacy and security products, with a narrower segment focus and smaller scale.
Which has the best competitive advantage?
Both companies are shedding value with declining ROIC trends. Oracle’s moat is slightly unfavorable, while Gen Digital’s is very unfavorable, indicating Oracle currently maintains a comparatively stronger, though still challenged, competitive advantage.
Stock Comparison
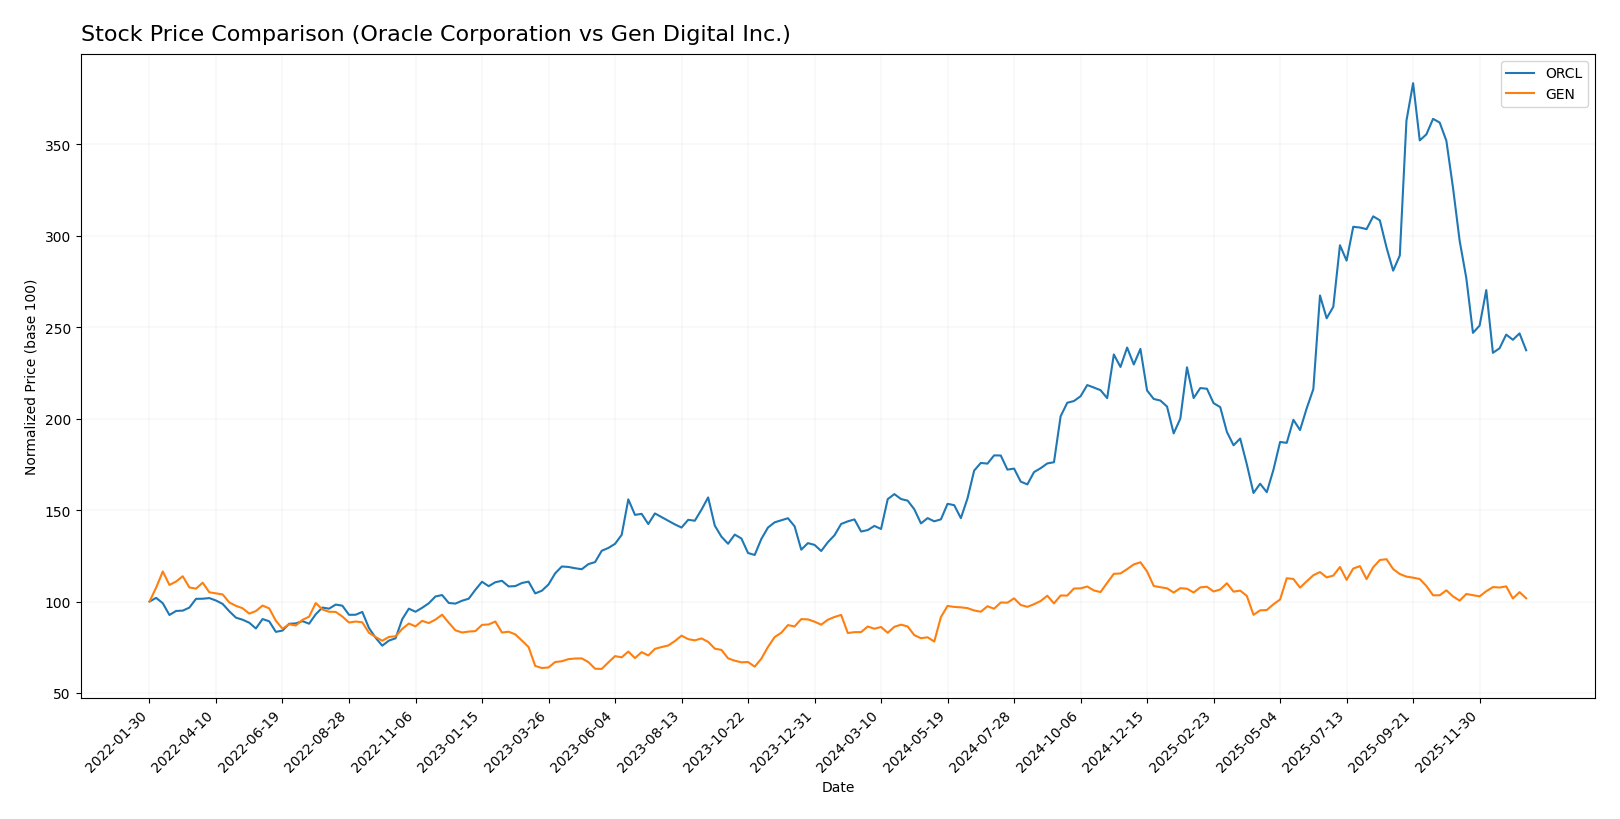
The stock price chart highlights distinct key movements and trading dynamics for Oracle Corporation and Gen Digital Inc. over the past year, reflecting contrasting performance trajectories and volume trends.
Trend Analysis
Oracle Corporation’s stock exhibited a strong bullish trend over the past 12 months with a 70.69% increase, though recent performance shows a deceleration and a 27.23% decline between November 2025 and January 2026. Volatility remains high with a standard deviation of 49.0.
Gen Digital Inc. recorded a moderate bullish trend with a 17.89% rise over the same period and a near-neutral recent trend with a slight 0.99% decrease. The stock’s volatility is low, indicated by a standard deviation of 2.59, and shows deceleration in growth.
Comparing both stocks, Oracle delivered the highest market performance over the past year with a significantly larger price increase despite recent downward pressure, whereas Gen Digital’s growth was more modest and stable.
Target Prices
Here is the current target price consensus from verified analysts for Oracle Corporation and Gen Digital Inc.
| Company | Target High | Target Low | Consensus |
|---|---|---|---|
| Oracle Corporation | 400 | 175 | 314.08 |
| Gen Digital Inc. | 32 | 31 | 31.5 |
Analysts expect Oracle’s stock to rise significantly from its current price of 191.09 USD, reflecting strong growth potential. Gen Digital’s consensus target of 31.5 USD suggests a moderate upside from its current 26.1 USD price.
Analyst Opinions Comparison
This section compares analysts’ ratings and grades for Oracle Corporation and Gen Digital Inc.:
Rating Comparison
Oracle Corporation Rating
- Rating: B, considered very favorable overall.
- Discounted Cash Flow Score: Moderate at 3, indicating a balanced valuation outlook.
- ROE Score: Very favorable at 5, showing efficient profit generation for shareholders.
- ROA Score: Favorable at 4, reflecting good asset utilization.
- Debt To Equity Score: Very unfavorable at 1, indicating higher financial risk.
- Overall Score: Moderate at 3, a balanced summary of financial standing.
Gen Digital Inc. Rating
- Rating: B, considered very favorable overall.
- Discounted Cash Flow Score: Very favorable at 5, suggesting undervaluation.
- ROE Score: Very favorable at 5, also indicating high profit efficiency.
- ROA Score: Moderate at 3, implying average asset efficiency.
- Debt To Equity Score: Very unfavorable at 1, also reflecting higher financial risk.
- Overall Score: Moderate at 3, similarly balanced financial assessment.
Which one is the best rated?
Both Oracle and Gen Digital share the same overall rating (B) and overall score (3). Gen Digital has a stronger discounted cash flow score but a weaker return on assets score. Oracle has a better return on assets score. Both face similar financial risk with low debt-to-equity scores.
Scores Comparison
Here is a comparison of the Altman Z-Score and Piotroski Score for Oracle and Gen Digital:
Oracle Scores
- Altman Z-Score: 2.43, indicating moderate bankruptcy risk in the grey zone.
- Piotroski Score: 5, reflecting average financial strength.
Gen Digital Scores
- Altman Z-Score: 1.25, indicating high bankruptcy risk in the distress zone.
- Piotroski Score: 6, reflecting average financial strength.
Which company has the best scores?
Oracle shows a higher Altman Z-Score, placing it in a safer grey zone compared to Gen Digital’s distress zone. Gen Digital has a slightly better Piotroski Score, but both are still average. Overall, Oracle has a stronger bankruptcy risk profile.
Grades Comparison
Here is a comparison of recent grades provided by major grading companies for Oracle Corporation and Gen Digital Inc.:
Oracle Corporation Grades
The following table summarizes Oracle’s latest grade actions from reputable grading companies:
| Grading Company | Action | New Grade | Date |
|---|---|---|---|
| UBS | Maintain | Buy | 2026-01-05 |
| RBC Capital | Maintain | Sector Perform | 2026-01-05 |
| Jefferies | Maintain | Buy | 2026-01-05 |
| Goldman Sachs | Maintain | Neutral | 2025-12-12 |
| Keybanc | Maintain | Overweight | 2025-12-11 |
| UBS | Maintain | Buy | 2025-12-11 |
| Citigroup | Maintain | Buy | 2025-12-11 |
| JP Morgan | Maintain | Neutral | 2025-12-11 |
| DA Davidson | Maintain | Neutral | 2025-12-11 |
| Scotiabank | Maintain | Sector Outperform | 2025-12-11 |
Oracle’s grades show a consistent pattern of Buy and Neutral ratings with no recent downgrades, reflecting steady analyst confidence.
Gen Digital Inc. Grades
Below is a summary of the most recent grades issued for Gen Digital Inc.:
| Grading Company | Action | New Grade | Date |
|---|---|---|---|
| RBC Capital | Maintain | Sector Perform | 2025-11-07 |
| Evercore ISI Group | Maintain | Outperform | 2025-11-07 |
| Morgan Stanley | Maintain | Equal Weight | 2025-09-02 |
| Barclays | Maintain | Equal Weight | 2025-08-08 |
| Wells Fargo | Maintain | Overweight | 2025-08-08 |
| RBC Capital | Maintain | Sector Perform | 2025-08-08 |
| Barclays | Maintain | Equal Weight | 2025-07-14 |
| RBC Capital | Maintain | Sector Perform | 2025-05-07 |
| Morgan Stanley | Maintain | Equal Weight | 2025-04-16 |
| RBC Capital | Maintain | Sector Perform | 2025-01-31 |
Gen Digital’s grades mostly range between Sector Perform and Equal Weight, with some Outperform and Overweight ratings, indicating moderate analyst optimism.
Which company has the best grades?
Oracle Corporation holds stronger and more consistent Buy and Overweight grades from major analysts compared to Gen Digital Inc., whose ratings cluster around Sector Perform and Equal Weight. This difference suggests Oracle currently enjoys higher analyst confidence, which may influence investor sentiment and portfolio positioning.
Strengths and Weaknesses
Below is a comparative overview of key strengths and weaknesses for Oracle Corporation (ORCL) and Gen Digital Inc. (GEN) based on their most recent financial and operational data.
| Criterion | Oracle Corporation (ORCL) | Gen Digital Inc. (GEN) |
|---|---|---|
| Diversification | Strong diversification with Cloud & License ($49.23B), Hardware ($2.94B), Services ($5.23B) | Focused mainly on Cyber Safety ($3.89B) with minimal legacy business ($50M) |
| Profitability | High net margin (21.68%), ROE (60.84%), ROIC (10.86%), but declining profitability trend | Moderate net margin (16.34%), ROE (28.34%), ROIC (7.77%) with steeply declining ROIC |
| Innovation | Significant R&D in cloud solutions but facing challenges with declining ROIC | Innovation centered on cybersecurity with core consumer security and fraud protection |
| Global presence | Extensive global footprint in enterprise IT services and cloud markets | Global presence mainly in cybersecurity markets with growing consumer focus |
| Market Share | Large market share in enterprise software and cloud licenses | Niche market share in cybersecurity, growing but smaller scale than Oracle |
Key takeaways: Oracle shows strong diversification and high profitability metrics but faces challenges with declining returns on invested capital. Gen Digital operates in a high-growth cybersecurity niche but is currently destroying value with a steep decline in profitability metrics. Both companies require cautious evaluation, especially considering their profitability trends.
Risk Analysis
Below is a summary table of key risks for Oracle Corporation and Gen Digital Inc. based on their latest financial and operational data for 2025:
| Metric | Oracle Corporation | Gen Digital Inc. |
|---|---|---|
| Market Risk | High beta (1.65) suggests high market volatility exposure | Moderate beta (1.08) indicates moderate market risk |
| Debt level | High debt-to-equity (5.09) and debt-to-assets (61.8%) — significant leverage risk | Elevated debt-to-equity (3.66) and debt-to-assets (53.7%) — considerable leverage risk |
| Regulatory Risk | Moderate, due to global operations in tech sector | Moderate, cybersecurity regulations evolving globally |
| Operational Risk | Large scale with 159K employees — complexity risk | Smaller scale with 3.4K employees; less operational complexity |
| Environmental Risk | Moderate, typical for tech hardware and data centers | Lower, primarily software-based with limited hardware footprint |
| Geopolitical Risk | Exposure through global markets and supply chains | Global presence but more focused on consumer cybersecurity |
Oracle’s significant leverage and high market beta increase its financial risk profile, while Gen Digital faces moderate leverage concerns and regulatory risks in cybersecurity. Oracle’s operational complexity and Gen Digital’s evolving regulatory environment are key considerations. Oracle’s Altman Z-Score in the grey zone signals moderate bankruptcy risk, while Gen Digital’s distress zone score indicates higher financial vulnerability. Investors should carefully weigh these factors alongside growth prospects.
Which Stock to Choose?
Oracle Corporation (ORCL) shows a favorable income evolution with 8.38% revenue growth in 2025 and strong profitability, including a 21.68% net margin and 60.84% ROE. However, its financial ratios reveal significant debt levels and an unfavorable global ratio stance, despite a very favorable rating of B.
Gen Digital Inc. (GEN) presents moderate income growth with 3.55% revenue increase in 2025 and a solid 16.34% net margin. Its financial ratios are slightly more balanced but still display high leverage and some unfavorable metrics, paired with a similarly favorable B rating.
Considering the ratings and overall financial evaluations, ORCL might appear more suitable for investors prioritizing strong profitability and growth potential, while GEN could be more aligned with those seeking moderate growth with slightly better balance in certain ratios. Both companies show risks linked to debt and financial stability.
Disclaimer: Investment carries a risk of loss of initial capital. The past performance is not a reliable indicator of future results. Be sure to understand risks before making an investment decision.
Go Further
I encourage you to read the complete analyses of Oracle Corporation and Gen Digital Inc. to enhance your investment decisions: