In the dynamic world of software infrastructure, Gen Digital Inc. and Okta, Inc. stand out as key players driving innovation in cybersecurity and identity management. Gen Digital focuses on consumer cyber safety solutions, while Okta specializes in enterprise identity platforms. Their overlapping presence in security technology makes them a compelling comparison. Join me as we explore which company presents the most promising investment opportunity in 2026.

Table of contents
Companies Overview
I will begin the comparison between Gen Digital Inc. and Okta, Inc. by providing an overview of these two companies and their main differences.
Gen Digital Inc. Overview
Gen Digital Inc. provides cyber safety solutions for consumers across multiple regions including the US, Europe, and Asia Pacific. Its product suite includes Norton 360, LifeLock identity theft protection, and Avira Security, focusing on malware, ransomware, and privacy protection. Founded in 1982 and based in Tempe, Arizona, Gen Digital operates in the software infrastructure industry with a market cap of approximately 16.1B USD.
Okta, Inc. Overview
Okta, Inc. offers identity solutions for enterprises, SMBs, and public sector clients globally. Its Okta Identity Cloud platform delivers services such as Single Sign-On, Adaptive MFA, and API Access Management, alongside Auth0 products that enhance secure authentication. Founded in 2009 and headquartered in San Francisco, California, Okta is positioned in the software infrastructure sector with a market cap near 15.2B USD.
Key similarities and differences
Both Gen Digital and Okta operate in the software infrastructure industry focusing on security but target different customer segments; Gen Digital emphasizes consumer cyber safety, while Okta specializes in enterprise identity management. They both provide subscription-based, cloud-enabled security solutions but differ in scale and product focus. Gen Digital has a slightly higher market cap and fewer employees compared to Okta, reflecting distinct operational scopes and market strategies.
Income Statement Comparison
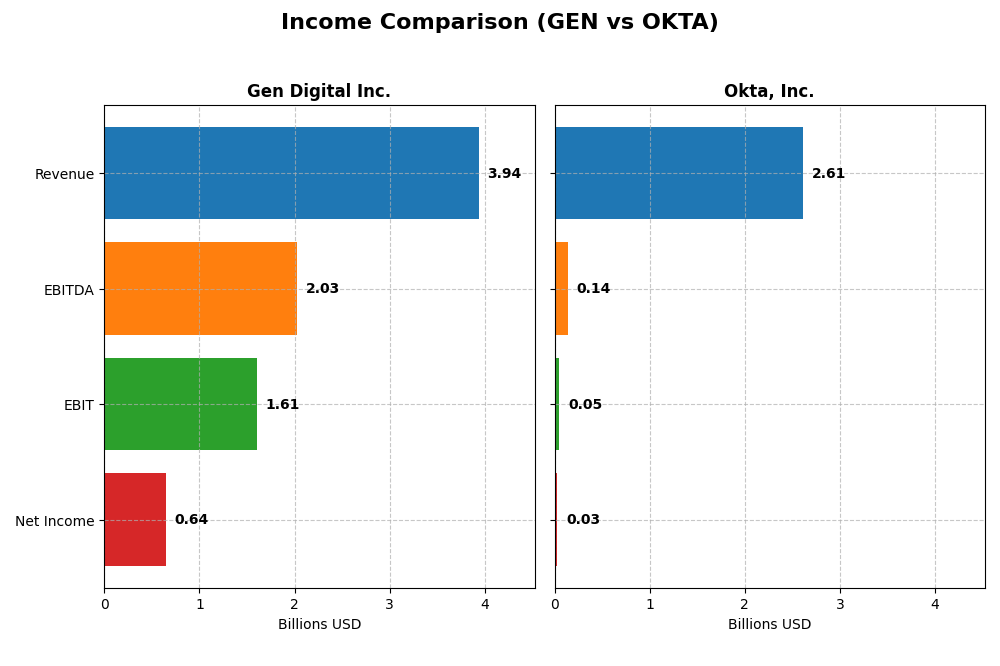
The following table presents a side-by-side comparison of key income statement metrics for Gen Digital Inc. and Okta, Inc. for their most recent fiscal year, providing a factual overview of their financial performance.
| Metric | Gen Digital Inc. (GEN) | Okta, Inc. (OKTA) |
|---|---|---|
| Market Cap | 16.1B | 15.2B |
| Revenue | 3.93B | 2.61B |
| EBITDA | 2.03B | 139M |
| EBIT | 1.61B | 51M |
| Net Income | 643M | 28M |
| EPS | 1.04 | 0.17 |
| Fiscal Year | 2025 | 2025 |
Income Statement Interpretations
Gen Digital Inc.
Gen Digital Inc. shows steady revenue growth from $2.55B in 2021 to $3.94B in 2025, with net income rising moderately from $554M to $643M over the same period. Gross margins remain strong around 80%, while net margins hold favorably at 16.3%. The 2025 fiscal year demonstrates stable revenue growth of 3.55%, improved EBIT by 44%, and a slight net margin increase, indicating solid operational performance.
Okta, Inc.
Okta, Inc. exhibits robust revenue expansion from $835M in 2021 to $2.61B in 2025, more than tripling in five years, with net income turning positive and reaching $28M in 2025 from sizable losses earlier. Gross margin stays favorable at 76.3%, while EBIT and net margins show notable improvement in 2025, reflecting strong margin recovery and profitability growth after previous negative results.
Which one has the stronger fundamentals?
Both companies display favorable income statement trends, but Okta leads with higher overall revenue growth (213% vs. 54%) and net income growth (111% vs. 16%) over the period. Gen Digital maintains superior margins and more consistent profitability, while Okta’s recent gains indicate rapid operational improvement. Okta’s earnings turnaround contrasts with Gen Digital’s steadier but slower growth, suggesting differing risk and growth profiles.
Financial Ratios Comparison
Below is a comparison of key financial ratios for Gen Digital Inc. (GEN) and Okta, Inc. (OKTA) based on their most recent fiscal year data.
| Ratios | Gen Digital Inc. (GEN) FY 2025 | Okta, Inc. (OKTA) FY 2025 |
|---|---|---|
| ROE | 28.3% | 0.44% |
| ROIC | 7.8% | -0.61% |
| P/E | 25.4 | 570.6 |
| P/B | 7.19 | 2.49 |
| Current Ratio | 0.51 | 1.35 |
| Quick Ratio | 0.51 | 1.35 |
| D/E (Debt-to-Equity) | 3.66 | 0.15 |
| Debt-to-Assets | 53.7% | 10.1% |
| Interest Coverage | 2.79 | -14.8 |
| Asset Turnover | 0.254 | 0.277 |
| Fixed Asset Turnover | 36.1 | 22.3 |
| Payout ratio | 48.7% | 0% |
| Dividend yield | 1.92% | 0% |
Interpretation of the Ratios
Gen Digital Inc.
Gen Digital shows strong profitability with a favorable net margin of 16.34% and robust return on equity at 28.34%, though its return on invested capital is only neutral. The company faces concerns with a low current ratio of 0.51, high debt levels (debt-to-equity 3.66), and unfavorable valuation multiples (PE 25.36, PB 7.19). It pays a dividend with a moderate yield of 1.92%, supported but not strongly covered by free cash flow, indicating some risk in sustainability.
Okta, Inc.
Okta’s ratios reveal challenges with weak profitability—net margin at 1.07% and return on equity at 0.44%—and negative returns on invested capital. However, it benefits from a solid liquidity position (current ratio 1.35), low leverage (debt-to-equity 0.15), and strong interest coverage. Okta does not pay dividends, reflecting its reinvestment strategy and focus on growth, with no payout pressure but continued reliance on operational improvements.
Which one has the best ratios?
Gen Digital presents stronger profitability and returns but struggles with liquidity and leverage, leading to a slightly unfavorable overall ratio profile. Okta, while weaker in profitability, maintains healthier liquidity and lower debt, resulting in a neutral ratio evaluation. The choice depends on whether profitability or financial stability is prioritized, as both exhibit distinct strengths and weaknesses.
Strategic Positioning
This section compares the strategic positioning of Gen Digital Inc. and Okta, Inc., including market position, key segments, and exposure to technological disruption:
Gen Digital Inc.
- Market position and competitive pressure: Established player in consumer cyber safety with a 16B market cap.
- Key segments and business drivers: Cyber safety solutions including Norton 360, LifeLock, VPN, and privacy tools.
- Exposure to technological disruption: Faces ongoing pressure to innovate in cybersecurity and privacy protection.
Okta, Inc.
- Market cap of 15B, focused on identity solutions for enterprises and public sector with moderate competitive pressure.
- Identity cloud platform with multi-factor authentication, lifecycle management, and API security as core drivers.
- Positioned in identity management with evolving cloud security demands, requiring continuous technological upgrades.
Gen Digital Inc. vs Okta, Inc. Positioning
Gen Digital is diversified across consumer cyber safety and privacy products, offering broad market coverage. Okta concentrates on enterprise identity solutions, emphasizing cloud security and authentication. Gen’s legacy products contrast with Okta’s focus on cutting-edge identity platforms, reflecting distinct strategic approaches.
Which has the best competitive advantage?
Both companies are currently shedding value with ROIC below WACC. Gen shows declining profitability, while Okta’s ROIC is growing, suggesting improving efficiency despite negative returns, giving Okta a slightly more favorable competitive moat.
Stock Comparison
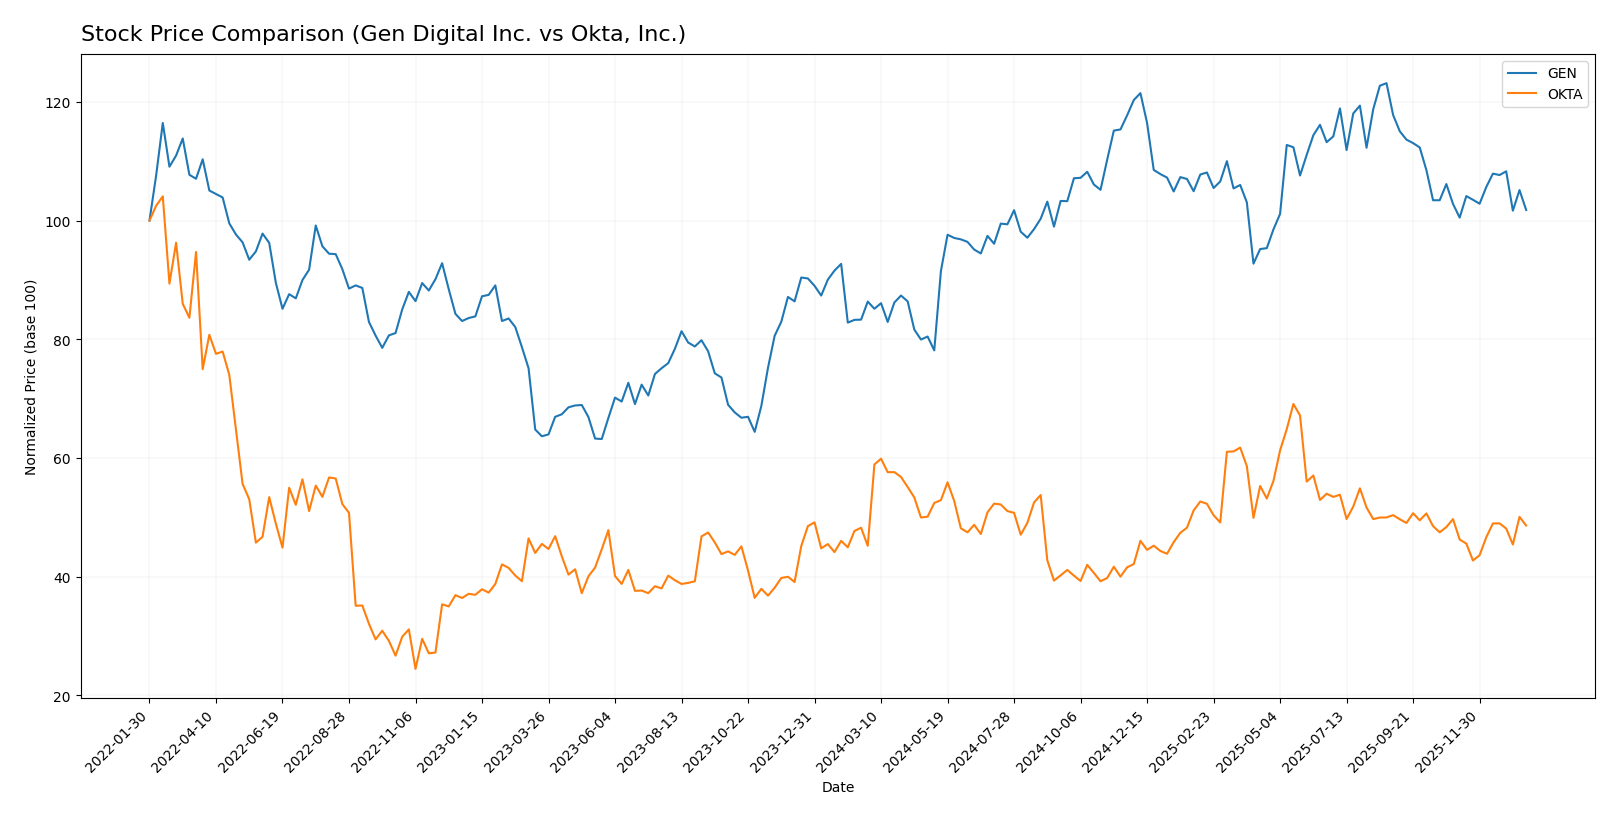
The stock price chart reveals significant bullish momentum for both Gen Digital Inc. and Okta, Inc. over the past 12 months, with notable highs and varying volatility profiles reflecting distinct trading dynamics.
Trend Analysis
Gen Digital Inc. shows a bullish trend over the past year with a 17.89% price increase, though the trend is decelerating. The stock’s price ranged between 20.03 and 31.58, with moderate volatility (std deviation 2.59).
Okta, Inc. experienced a 7.58% bullish trend over the same period, characterized by accelerating momentum and higher volatility (std deviation 11.38). Prices fluctuated between 72.24 and 127.3, indicating wider swings.
Comparing both, Gen Digital Inc. delivered the highest market performance with a stronger price gain, while Okta showed more price volatility and accelerating trend dynamics.
Target Prices
Here is the current analyst target price consensus for selected technology companies.
| Company | Target High | Target Low | Consensus |
|---|---|---|---|
| Gen Digital Inc. | 32 | 31 | 31.5 |
| Okta, Inc. | 140 | 60 | 110.67 |
Analysts expect Gen Digital’s stock to appreciate moderately from its current price of $26.1, indicating confidence in steady growth. Okta’s consensus target is significantly above its current $89.55 price, suggesting a strong bullish outlook despite some valuation range volatility.
Analyst Opinions Comparison
This section compares analysts’ ratings and grades for Gen Digital Inc. and Okta, Inc.:
Rating Comparison
Gen Digital Inc. Rating
- Rating: B, considered Very Favorable by analysts.
- Discounted Cash Flow Score: 5, Very Favorable valuation.
- ROE Score: 5, indicating very efficient profit generation.
- ROA Score: 3, moderate asset utilization.
- Debt To Equity Score: 1, Very Unfavorable, higher risk.
- Overall Score: 3, moderate overall financial standing.
Okta, Inc. Rating
- Rating: B, also deemed Very Favorable by analysts.
- Discounted Cash Flow Score: 4, Favorable valuation.
- ROE Score: 2, showing moderate efficiency in profit use.
- ROA Score: 3, similarly moderate asset utilization.
- Debt To Equity Score: 4, Favorable, lower financial risk.
- Overall Score: 3, moderate overall financial standing.
Which one is the best rated?
Both Gen Digital and Okta share the same overall rating of B and moderate overall scores. Gen Digital leads in discounted cash flow and ROE, while Okta has a stronger debt-to-equity position. Each shows strengths in different financial aspects.
Scores Comparison
Here is a comparison of the Altman Z-Score and Piotroski Score for Gen Digital Inc. and Okta, Inc.:
Gen Digital Inc. Scores
- Altman Z-Score: 1.25, placing the company in distress zone, indicating high bankruptcy risk.
- Piotroski Score: 6, reflecting average financial strength and moderate investment potential.
Okta, Inc. Scores
- Altman Z-Score: 4.15, placing the company in safe zone, indicating low bankruptcy risk.
- Piotroski Score: 8, reflecting very strong financial strength and high investment potential.
Which company has the best scores?
Based strictly on the provided data, Okta, Inc. has superior scores with a safe-zone Altman Z-Score of 4.15 and a very strong Piotroski Score of 8, compared to Gen Digital’s distress-zone 1.25 and average Piotroski Score of 6.
Grades Comparison
The following is a comparison of the latest grades assigned to Gen Digital Inc. and Okta, Inc. by reputable grading companies:
Gen Digital Inc. Grades
The table below summarizes recent grades from established grading firms for Gen Digital Inc.:
| Grading Company | Action | New Grade | Date |
|---|---|---|---|
| RBC Capital | Maintain | Sector Perform | 2025-11-07 |
| Evercore ISI Group | Maintain | Outperform | 2025-11-07 |
| Morgan Stanley | Maintain | Equal Weight | 2025-09-02 |
| Barclays | Maintain | Equal Weight | 2025-08-08 |
| Wells Fargo | Maintain | Overweight | 2025-08-08 |
| RBC Capital | Maintain | Sector Perform | 2025-08-08 |
| Barclays | Maintain | Equal Weight | 2025-07-14 |
| RBC Capital | Maintain | Sector Perform | 2025-05-07 |
| Morgan Stanley | Maintain | Equal Weight | 2025-04-16 |
| RBC Capital | Maintain | Sector Perform | 2025-01-31 |
Overall, Gen Digital’s grades show a stable consensus around “Sector Perform” to “Equal Weight,” with occasional “Outperform” and “Overweight” ratings, indicating moderate confidence among analysts.
Okta, Inc. Grades
The following table presents recent grading updates from credible firms for Okta, Inc.:
| Grading Company | Action | New Grade | Date |
|---|---|---|---|
| Stephens & Co. | Upgrade | Overweight | 2026-01-14 |
| Piper Sandler | Maintain | Neutral | 2026-01-05 |
| RBC Capital | Maintain | Outperform | 2026-01-05 |
| Jefferies | Upgrade | Buy | 2025-12-16 |
| Needham | Maintain | Buy | 2025-12-12 |
| BTIG | Maintain | Buy | 2025-12-04 |
| Susquehanna | Maintain | Neutral | 2025-12-03 |
| Cantor Fitzgerald | Maintain | Overweight | 2025-12-03 |
| Canaccord Genuity | Maintain | Buy | 2025-12-03 |
| Scotiabank | Maintain | Sector Perform | 2025-12-03 |
Okta’s grades reflect a generally positive outlook with several “Buy” and “Overweight” ratings and some recent upgrades, suggesting increased analyst confidence.
Which company has the best grades?
Okta, Inc. has received a higher proportion of “Buy” and “Overweight” ratings compared to Gen Digital Inc., which mostly holds “Sector Perform” and “Equal Weight” grades. This suggests Okta is viewed more favorably by analysts, potentially influencing investors toward expecting stronger performance.
Strengths and Weaknesses
Below is a comparison of key strengths and weaknesses of Gen Digital Inc. (GEN) and Okta, Inc. (OKTA) based on the most recent financial and operational data:
| Criterion | Gen Digital Inc. (GEN) | Okta, Inc. (OKTA) |
|---|---|---|
| Diversification | Strong revenue diversification with $3.88B from Cyber Safety and $50M Legacy segment (2025) | Concentrated revenue mainly from Subscription and Circulation totaling $2.56B (2025) |
| Profitability | Favorable net margin at 16.34%, ROE 28.34%, but ROIC slightly below WACC (7.77% vs 7.82%) | Low profitability with net margin 1.07%, negative ROIC at -0.61%, but improving ROIC trend |
| Innovation | Stable legacy and consumer security offerings, limited evidence of breakthrough innovation | Focused on technology services with growing revenues, showing innovation in identity management |
| Global presence | Established global footprint in cybersecurity with diversified products | Growing international reach but less diversified product portfolio |
| Market Share | Large market share in cybersecurity with significant recurring revenue | Smaller market share but rapidly increasing subscription base |
Key takeaways: Gen Digital shows stronger profitability and diversification but struggles with declining capital efficiency. Okta, while less profitable, demonstrates improving returns and innovation-driven growth. Investors should weigh stability versus growth potential carefully.
Risk Analysis
Below is a comparison table of key risks for Gen Digital Inc. (GEN) and Okta, Inc. (OKTA) based on the latest available data for 2025:
| Metric | Gen Digital Inc. (GEN) | Okta, Inc. (OKTA) |
|---|---|---|
| Market Risk | Beta 1.08, moderate volatility | Beta 0.76, lower volatility |
| Debt level | High (Debt/Equity 3.66, 54% assets) | Low (Debt/Equity 0.15, 10% assets) |
| Regulatory Risk | Moderate, cybersecurity sector sensitive | Moderate, identity management regulations |
| Operational Risk | Moderate, product integration and tech updates | Moderate, dependency on cloud infrastructure |
| Environmental Risk | Low, limited direct impact | Low, limited direct impact |
| Geopolitical Risk | Moderate, global consumer exposure | Moderate, international client base |
Gen Digital faces significant financial leverage risk with a high debt load and weaker liquidity ratios, increasing vulnerability to market downturns. Okta shows stronger balance sheet health and lower debt risk but struggles with profitability and high valuation multiples, posing market and operational execution risks. Investors should weigh Gen’s financial distress signals against Okta’s growth and valuation uncertainties.
Which Stock to Choose?
Gen Digital Inc. shows steady income growth with favorable gross and EBIT margins, a solid net margin of 16.34%, and strong returns on equity at 28.34%. However, it has high debt levels with a debt-to-equity ratio of 3.66 and a current ratio below 1, indicating liquidity concerns. Its overall rating is very favorable but financial ratios appear slightly unfavorable.
Okta, Inc. presents robust revenue and net income growth, with a favorable income statement overall but low profitability ratios, including a net margin of 1.07% and return on equity at 0.44%. It maintains low debt with a debt-to-equity ratio of 0.15 and better liquidity ratios. Its financial ratios evaluation is neutral with a very favorable rating.
Investors seeking companies with strong profitability and steady income might find Gen Digital Inc. more aligned with their profile, while those prioritizing lower leverage and improving profitability trends could see Okta, Inc. as potentially favorable. The choice might depend on individual risk tolerance and investment strategy focus.
Disclaimer: Investment carries a risk of loss of initial capital. The past performance is not a reliable indicator of future results. Be sure to understand risks before making an investment decision.
Go Further
I encourage you to read the complete analyses of Gen Digital Inc. and Okta, Inc. to enhance your investment decisions: