In the evolving landscape of software infrastructure, Gen Digital Inc. and Oddity Tech Ltd. stand out as intriguing contenders with distinct approaches. Gen Digital focuses on comprehensive cybersecurity solutions, serving a global market with established products, while Oddity Tech disrupts the beauty and wellness sector through innovative digital-first branding. This article will explore their market positions and innovation strategies to identify which company offers the most compelling investment opportunity for you.
Table of contents
Companies Overview
I will begin the comparison between Gen Digital Inc. and Oddity Tech Ltd. by providing an overview of these two companies and their main differences.
Gen Digital Inc. Overview
Gen Digital Inc. delivers comprehensive cyber safety solutions for consumers across multiple regions including the US, Europe, and Asia Pacific. Its offerings range from Norton 360, a subscription service protecting various devices, to identity theft protection and online privacy tools. Founded in 1982 and based in Tempe, Arizona, Gen Digital focuses on infrastructure software in cybersecurity with a market cap of approximately 16.1B USD.
Oddity Tech Ltd. Overview
Oddity Tech Ltd. operates globally as a consumer-tech company specializing in beauty and wellness products supported by its PowerMatch technology. It develops digital-first brands aimed at disrupting traditional beauty industries, offering products under IL MAKIAGE and SpoiledChild brands. Incorporated in 2013 and headquartered in Tel Aviv-Jaffa, Israel, Oddity Tech trades on NASDAQ with a market cap near 2B USD.
Key similarities and differences
Both companies operate in the technology sector focusing on software infrastructure but serve distinct markets: Gen Digital in cybersecurity and Oddity Tech in consumer beauty tech. Gen Digital has a significantly larger market cap and workforce, reflecting a mature position, while Oddity Tech is smaller, newer, and more volatile with a higher beta. Their business models differ fundamentally, with Gen Digital providing subscription-based cybersecurity services versus Oddity Tech’s product-driven approach in wellness and beauty.
Income Statement Comparison
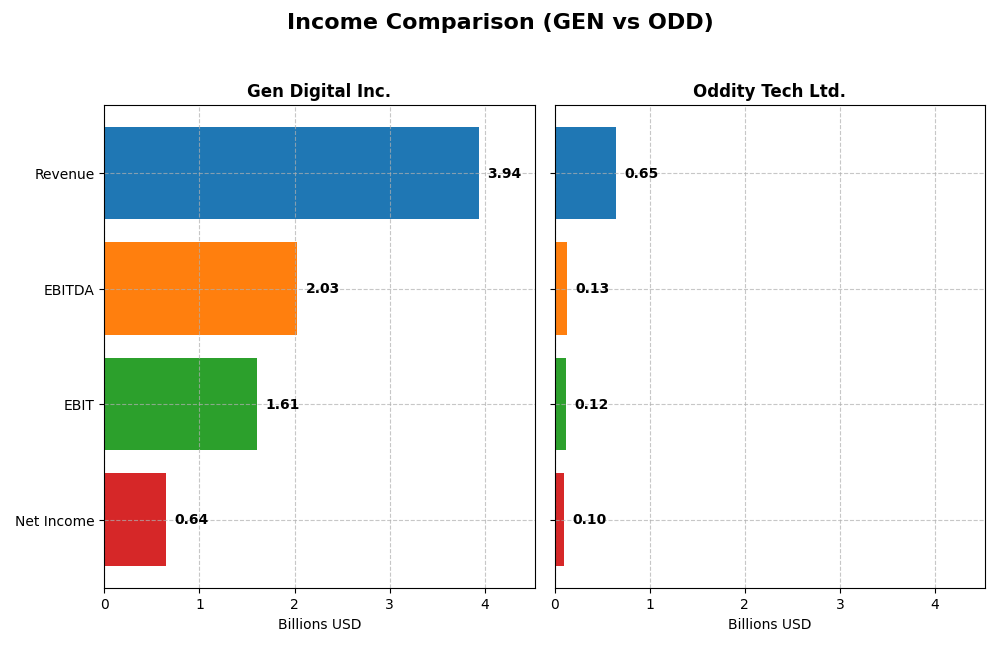
The table below compares the key income statement metrics for Gen Digital Inc. and Oddity Tech Ltd. based on their most recent fiscal year reports.
| Metric | Gen Digital Inc. | Oddity Tech Ltd. |
|---|---|---|
| Market Cap | 16.1B USD | 2.01B USD |
| Revenue | 3.94B USD | 647M USD |
| EBITDA | 2.03B USD | 125M USD |
| EBIT | 1.61B USD | 116M USD |
| Net Income | 643M USD | 101M USD |
| EPS | 1.04 USD | 1.78 USD |
| Fiscal Year | 2025 | 2024 |
Income Statement Interpretations
Gen Digital Inc.
Gen Digital Inc. showed strong revenue growth from $2.55B in 2021 to $3.94B in 2025, with net income rising from $554M to $643M over the same period. Gross and EBIT margins remained favorable, at around 80.3% and 40.8% respectively, though net margin experienced a slight decline overall. In 2025, growth slowed modestly with revenue up 3.55%, but EBIT surged 44%, reflecting improved operational efficiency.
Oddity Tech Ltd.
Oddity Tech Ltd. demonstrated rapid expansion with revenue climbing from $111M in 2020 to $647M in 2024 and net income surging from $11.7M to $101.5M. Margins improved consistently, with gross margin at 72.4% and EBIT margin near 17.9% in 2024. The latest year saw strong momentum: revenue increased 27.2%, net margin grew by 36.3%, and EPS jumped 66%, signaling robust profitability gains.
Which one has the stronger fundamentals?
Both companies display favorable fundamentals, but Oddity Tech’s rapid revenue and net income growth, coupled with consistent margin expansion and zero unfavorable metrics, contrast with Gen Digital’s slower revenue growth and some margin pressure. Gen Digital’s strong scale and operational margins remain impressive, but Oddity Tech’s dynamic growth profile suggests more pronounced momentum in fundamentals.
Financial Ratios Comparison
The table below presents a side-by-side comparison of key financial ratios for Gen Digital Inc. (GEN) and Oddity Tech Ltd. (ODD) based on their most recent fiscal year data.
| Ratios | Gen Digital Inc. (GEN) FY 2025 | Oddity Tech Ltd. (ODD) FY 2024 |
|---|---|---|
| ROE | 28.3% | 35.9% |
| ROIC | 7.8% | 28.6% |
| P/E | 25.4 | 23.7 |
| P/B | 7.19 | 8.54 |
| Current Ratio | 0.51 | 1.79 |
| Quick Ratio | 0.51 | 0.99 |
| D/E (Debt to Equity) | 3.66 | 0.08 |
| Debt-to-Assets | 53.7% | 5.2% |
| Interest Coverage | 2.79 | 1521.1 |
| Asset Turnover | 0.25 | 1.47 |
| Fixed Asset Turnover | 36.1 | 19.4 |
| Payout Ratio | 48.7% | 0% |
| Dividend Yield | 1.92% | 0% |
Interpretation of the Ratios
Gen Digital Inc.
Gen Digital shows strong profitability with a favorable net margin of 16.34% and a high return on equity at 28.34%, but faces concerns with a low current ratio of 0.51 and high leverage indicated by a debt-to-equity ratio of 3.66. The dividend yield is moderate at 1.92%, with distributions appearing sustainable given the coverage by free cash flow, though high debt levels pose risks.
Oddity Tech Ltd.
Oddity Tech exhibits robust financial health with favorable net margin at 15.69%, impressive return on equity of 35.95%, and strong return on invested capital of 28.56%. Its balance sheet is solid, reflected in a current ratio of 1.79 and low debt-to-equity of 0.08. The company does not pay dividends, likely focusing on reinvestment and growth, supported by strong cash flow generation.
Which one has the best ratios?
Oddity Tech Ltd. presents a generally more favorable ratio profile, with 64.29% of ratios rated positively, strong liquidity, low leverage, and high returns, despite no dividend payments. Gen Digital, while profitable and paying dividends, has multiple unfavorable ratios including high debt and weak liquidity, leading to a slightly unfavorable overall evaluation.
Strategic Positioning
This section compares the strategic positioning of Gen Digital Inc. and Oddity Tech Ltd., focusing on Market position, Key segments, and exposure to technological disruption:
Gen Digital Inc.
- Established market presence in cybersecurity with global reach; faces moderate competitive pressure.
- Key segments include comprehensive cyber safety and identity protection services driving revenue.
- Positioned in software infrastructure with steady innovation in privacy and security solutions.
Oddity Tech Ltd.
- Smaller market cap, focused on consumer-tech beauty and wellness; operates in a niche segment.
- Business driven by digital-first beauty and wellness brands leveraging proprietary technology.
- Disrupting offline beauty industry with digital technology; exposed to rapid tech changes.
Gen Digital Inc. vs Oddity Tech Ltd. Positioning
Gen Digital shows a diversified approach with broad cyber safety offerings and global operations, while Oddity Tech concentrates on digital beauty and wellness brands. Gen’s scale offers stability; Oddity’s niche focus targets disruption but carries higher volatility risks.
Which has the best competitive advantage?
Oddity Tech demonstrates a very favorable moat with growing ROIC and value creation, indicating a durable competitive advantage, whereas Gen Digital shows declining ROIC and value destruction, reflecting a very unfavorable moat.
Stock Comparison
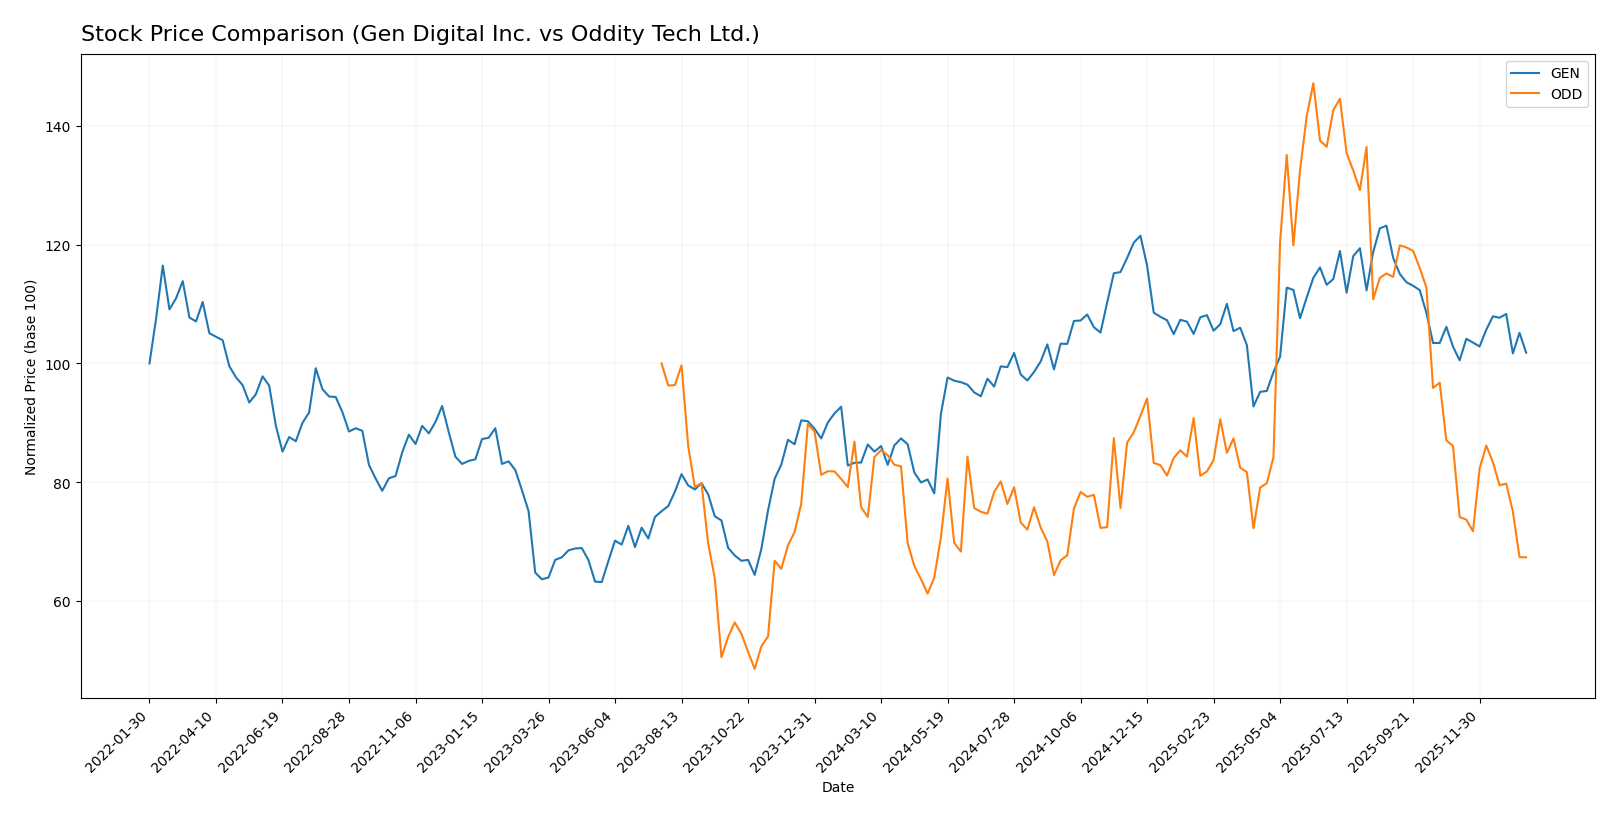
The stock price chart highlights significant divergence in trading dynamics over the past year, with Gen Digital Inc. exhibiting a sustained bullish trend and Oddity Tech Ltd. showing a marked bearish trajectory.
Trend Analysis
Gen Digital Inc.’s stock price increased by 17.89% over the past 12 months, indicating a bullish trend with decelerating momentum. The stock showed moderate volatility with a standard deviation of 2.59, peaking at 31.58 and bottoming at 20.03.
Oddity Tech Ltd. experienced a 9.16% decline over the same period, reflecting a bearish trend with deceleration. Its price volatility was significantly higher, with a standard deviation of 11.75, reaching a high of 77.35 and a low of 32.19.
Comparing both, Gen Digital Inc. delivered the highest market performance with a positive 17.89% change, while Oddity Tech Ltd. underperformed with a 9.16% loss over the past year.
Target Prices
The current analyst consensus provides clear target price ranges for both Gen Digital Inc. and Oddity Tech Ltd.
| Company | Target High | Target Low | Consensus |
|---|---|---|---|
| Gen Digital Inc. | 32 | 31 | 31.5 |
| Oddity Tech Ltd. | 80 | 40 | 66.33 |
Analysts expect Gen Digital’s stock to trade moderately above its current price of 26.1 USD, indicating modest upside potential. Oddity Tech’s consensus target significantly exceeds its current 35.4 USD price, suggesting stronger growth expectations but with wider uncertainty.
Analyst Opinions Comparison
This section compares analysts’ ratings and scores for Gen Digital Inc. and Oddity Tech Ltd.:
Rating Comparison
Gen Digital Inc. Rating
- Rating: B, classified as Very Favorable by analysts.
- Discounted Cash Flow Score: 5, indicating a Very Favorable valuation.
- ROE Score: 5, showing very efficient profit generation on equity.
- ROA Score: 3, assessed as Moderate asset utilization efficiency.
- Debt To Equity Score: 1, considered Very Unfavorable due to high debt.
- Overall Score: 3, reflecting a Moderate overall financial standing.
Oddity Tech Ltd. Rating
- Rating: B+, also classified as Very Favorable by analysts.
- Discounted Cash Flow Score: 4, indicating a Favorable valuation.
- ROE Score: 5, equally showing very efficient profit generation.
- ROA Score: 4, indicating Favorable asset utilization efficiency.
- Debt To Equity Score: 3, considered Moderate financial risk.
- Overall Score: 3, also reflecting a Moderate overall financial standing.
Which one is the best rated?
Oddity Tech Ltd. holds a better rating with a B+ compared to Gen Digital’s B. Oddity Tech shows stronger scores in discounted cash flow, ROA, and debt-to-equity, suggesting a relatively more favorable financial profile.
Scores Comparison
Here is a comparison of the Altman Z-Score and Piotroski Score for both companies:
Gen Digital Inc. Scores
- Altman Z-Score: 1.25, in distress zone, high bankruptcy risk.
- Piotroski Score: 6, average financial strength.
Oddity Tech Ltd. Scores
- Altman Z-Score: 3.78, in safe zone, low bankruptcy risk.
- Piotroski Score: 6, average financial strength.
Which company has the best scores?
Oddity Tech Ltd. shows a stronger financial stability with a safe zone Altman Z-Score of 3.78, compared to Gen Digital’s distress zone score of 1.25. Both have the same average Piotroski Score of 6.
Grades Comparison
Here is a comparison of the latest available grades from reputable grading companies for both companies:
Gen Digital Inc. Grades
The following table summarizes recent grades and ratings from leading financial institutions for Gen Digital Inc.:
| Grading Company | Action | New Grade | Date |
|---|---|---|---|
| RBC Capital | Maintain | Sector Perform | 2025-11-07 |
| Evercore ISI Group | Maintain | Outperform | 2025-11-07 |
| Morgan Stanley | Maintain | Equal Weight | 2025-09-02 |
| Barclays | Maintain | Equal Weight | 2025-08-08 |
| Wells Fargo | Maintain | Overweight | 2025-08-08 |
| RBC Capital | Maintain | Sector Perform | 2025-08-08 |
| Barclays | Maintain | Equal Weight | 2025-07-14 |
| RBC Capital | Maintain | Sector Perform | 2025-05-07 |
| Morgan Stanley | Maintain | Equal Weight | 2025-04-16 |
| RBC Capital | Maintain | Sector Perform | 2025-01-31 |
Gen Digital Inc. shows a consistent pattern of “Sector Perform” and “Equal Weight” grades with some “Outperform” and “Overweight” ratings, indicating moderate confidence but no recent upgrades.
Oddity Tech Ltd. Grades
Below is a summary of the latest grades from established financial institutions for Oddity Tech Ltd.:
| Grading Company | Action | New Grade | Date |
|---|---|---|---|
| Keybanc | Maintain | Overweight | 2026-01-08 |
| JP Morgan | Maintain | Overweight | 2025-12-12 |
| JP Morgan | Maintain | Overweight | 2025-11-21 |
| Barclays | Maintain | Equal Weight | 2025-11-21 |
| Morgan Stanley | Maintain | Equal Weight | 2025-11-21 |
| Needham | Maintain | Buy | 2025-11-20 |
| Keybanc | Maintain | Overweight | 2025-10-08 |
| JMP Securities | Maintain | Market Outperform | 2025-09-23 |
| Morgan Stanley | Maintain | Equal Weight | 2025-08-06 |
| JMP Securities | Maintain | Market Outperform | 2025-08-05 |
Oddity Tech Ltd. consistently receives “Overweight,” “Buy,” and “Market Outperform” ratings, suggesting stronger analyst confidence and positive outlook.
Which company has the best grades?
Oddity Tech Ltd. has received generally stronger grades, including multiple “Overweight,” “Buy,” and “Market Outperform” ratings, compared to Gen Digital Inc.’s more cautious “Sector Perform” and “Equal Weight” consensus. This difference could imply a more favorable growth or value perception by analysts, potentially impacting investor sentiment and portfolio positioning.
Strengths and Weaknesses
Below is a comparative overview of key strengths and weaknesses for Gen Digital Inc. (GEN) and Oddity Tech Ltd. (ODD), based on the latest financial and operational data.
| Criterion | Gen Digital Inc. (GEN) | Oddity Tech Ltd. (ODD) |
|---|---|---|
| Diversification | Moderate: Strong in Cyber Safety and Identity Protection; Legacy products declining | Limited product data but appears focused on core tech solutions |
| Profitability | Moderate profitability; net margin 16.3%, ROE 28.3%, but ROIC slightly below WACC and declining | High profitability; net margin 15.7%, ROE 36.0%, ROIC well above WACC with growth trend |
| Innovation | Declining ROIC trend indicates potential issues in sustaining innovation and competitive advantage | Robust innovation indicated by strong and growing ROIC and favorable asset turnover |
| Global presence | Established global footprint in cybersecurity sector | Smaller global presence implied, but operational efficiency is high |
| Market Share | Large market share in cybersecurity and identity protection | Market share data unavailable; efficiency metrics suggest competitive positioning |
Key takeaways: Oddity Tech demonstrates a durable competitive advantage with strong profitability and efficient capital use, making it a favorable investment candidate. Gen Digital shows solid profitability but faces challenges with declining capital returns and some financial weaknesses, warranting cautious consideration.
Risk Analysis
Below is a comparative table of key risks for Gen Digital Inc. (GEN) and Oddity Tech Ltd. (ODD) based on the most recent data available:
| Metric | Gen Digital Inc. (GEN) | Oddity Tech Ltd. (ODD) |
|---|---|---|
| Market Risk | Beta 1.08 (moderate volatility) | Beta 3.18 (high volatility) |
| Debt level | High leverage: Debt-to-Equity 3.66, Debt-to-Assets 53.66% (unfavorable) | Low leverage: Debt-to-Equity 0.08, Debt-to-Assets 5.17% (favorable) |
| Regulatory Risk | Moderate, US-based with global operations, exposure to privacy laws | Moderate, Israeli base with global reach, potential regulatory changes in consumer tech |
| Operational Risk | Established cybersecurity platform but faces tech disruption risks | Newer company, scaling risks in beauty tech market |
| Environmental Risk | Low direct exposure, software industry | Low direct exposure, consumer wellness products |
| Geopolitical Risk | US-based, diversified globally | Based in Israel, geopolitical tensions could impact operations |
In synthesis, Gen Digital’s most impactful risks stem from its high debt load and moderate market volatility, which increase financial and refinancing pressures despite stable profitability. Oddity Tech shows strong financial health with low debt but faces high market volatility and geopolitical risks due to its Israeli base. Investors should weigh Gen’s financial leverage risks against Oddity’s higher operational and geopolitical uncertainties.
Which Stock to Choose?
Gen Digital Inc. (GEN) shows steady income growth with a favorable net margin of 16.34% and strong ROE at 28.34%. However, it carries high debt levels (debt-to-equity 3.66), a low current ratio (0.51), and a very unfavorable overall financial ratios rating, despite a very favorable company rating.
Oddity Tech Ltd. (ODD) reports robust income growth, with a 15.69% net margin and a higher ROE of 35.95%. Its financial ratios are mostly favorable, featuring low debt (debt-to-equity 0.08) and a strong current ratio (1.79). The company also holds a very favorable rating and demonstrates a very favorable economic moat.
For investors prioritizing competitive advantage and value creation, Oddity Tech’s strong and improving ROIC relative to WACC and favorable financial ratios might appear more appealing. Conversely, investors focusing on stable profitability with moderate growth could find Gen Digital’s consistent income and solid returns relevant, despite its higher leverage and less favorable ratios.
Disclaimer: Investment carries a risk of loss of initial capital. The past performance is not a reliable indicator of future results. Be sure to understand risks before making an investment decision.
Go Further
I encourage you to read the complete analyses of Gen Digital Inc. and Oddity Tech Ltd. to enhance your investment decisions: