In the dynamic world of software infrastructure, Gen Digital Inc. and Nutanix, Inc. stand out as key players driving innovation. Both companies target overlapping markets with cutting-edge solutions—from cybersecurity and digital privacy to enterprise cloud platforms and virtualization. This comparison explores their strategies and market positions to help you, the investor, identify which company presents the most compelling opportunity for your portfolio. Let’s dive in and uncover the best pick for your investment goals.
Table of contents
Companies Overview
I will begin the comparison between Gen Digital Inc. and Nutanix, Inc. by providing an overview of these two companies and their main differences.
Gen Digital Inc. Overview
Gen Digital focuses on delivering cyber safety solutions globally, including Norton 360, LifeLock identity protection, and VPN services. The company targets consumers with a comprehensive subscription platform to protect PCs, Macs, and mobile devices from malware and online threats. Founded in 1982 and headquartered in Tempe, Arizona, Gen Digital operates in the Software – Infrastructure industry with a market cap of approximately 16.1B USD.
Nutanix, Inc. Overview
Nutanix provides an enterprise cloud platform that integrates virtualization, storage, and security services across multiple regions worldwide. Its offerings include hypervisor solutions, Kubernetes management, cloud automation, and desktop-as-a-service, catering to diverse industries like healthcare, finance, and telecommunications. Founded in 2009 and based in San Jose, California, Nutanix operates in the same industry segment with a market cap near 12.4B USD.
Key similarities and differences
Both companies operate in the Software – Infrastructure sector and serve global markets, but Gen Digital focuses primarily on consumer cyber safety and privacy solutions, whereas Nutanix specializes in enterprise cloud infrastructure and hybrid cloud orchestration. Gen Digital’s business model centers on subscription-based consumer protection services, while Nutanix offers a broad suite of cloud products and consulting for enterprise clients, reflecting distinct target audiences and product strategies.
Income Statement Comparison
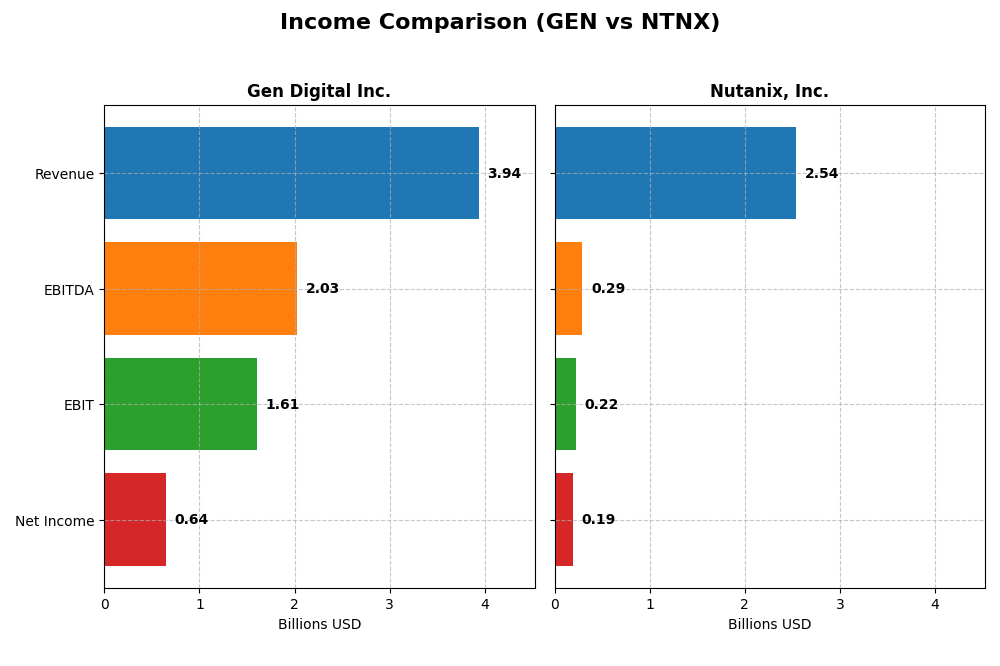
The table below presents a side-by-side comparison of key income statement metrics for Gen Digital Inc. and Nutanix, Inc. for their most recent fiscal year.
| Metric | Gen Digital Inc. | Nutanix, Inc. |
|---|---|---|
| Market Cap | 16.1B | 12.4B |
| Revenue | 3.94B | 2.54B |
| EBITDA | 2.03B | 293M |
| EBIT | 1.61B | 220M |
| Net Income | 643M | 188M |
| EPS | 1.04 | 0.70 |
| Fiscal Year | 2025 | 2025 |
Income Statement Interpretations
Gen Digital Inc.
Gen Digital showed steady revenue growth from 2021 to 2025, reaching $3.93B in 2025 with a 54.25% overall increase. Net income grew 16.06% over the period, though net margin declined by 24.76%. In 2025, revenue growth slowed to 3.55%, while EBIT margin improved to 40.84%, reflecting operational efficiency despite a high interest expense ratio.
Nutanix, Inc.
Nutanix experienced robust revenue expansion, rising 82.01% from 2021 to 2025 to $2.54B. Net income turned positive and surged 118.21%, supported by improved net margin growth of 110.01%. The 2025 fiscal year showed strong momentum with 18.11% revenue growth and a significant 223.27% EBIT increase, indicating enhanced profitability and margin stabilization.
Which one has the stronger fundamentals?
Both companies exhibit favorable income statement trends, but Nutanix stands out with higher revenue and net income growth rates and a better improvement in net margin. Gen Digital maintains superior EBIT and gross margins but faces higher interest expenses and a declining net margin. Nutanix’s overall stronger growth and margin expansion imply comparatively stronger fundamentals based on income metrics.
Financial Ratios Comparison
This table presents the latest available financial ratios for Gen Digital Inc. and Nutanix, Inc., reflecting their fiscal year 2025 performance where possible.
| Ratios | Gen Digital Inc. (GEN) | Nutanix, Inc. (NTNX) |
|---|---|---|
| ROE | 28.3% | -27.1% |
| ROIC | 7.8% | 8.1% |
| P/E | 25.4 | 106.7 |
| P/B | 7.19 | -28.95 |
| Current Ratio | 0.51 | 1.72 |
| Quick Ratio | 0.51 | 1.72 |
| D/E | 3.66 | -2.14 |
| Debt-to-Assets | 53.7% | 45.2% |
| Interest Coverage | 2.79 | 8.75 |
| Asset Turnover | 0.25 | 0.77 |
| Fixed Asset Turnover | 36.1 | 9.15 |
| Payout Ratio | 48.7% | 0% |
| Dividend Yield | 1.92% | 0% |
Interpretation of the Ratios
Gen Digital Inc.
Gen Digital exhibits strong profitability with a favorable net margin of 16.34% and a high return on equity at 28.34%. However, liquidity ratios such as current and quick ratios are weak at 0.51, indicating potential short-term solvency concerns. Leverage is also high, with a debt-to-equity ratio of 3.66 and debt to assets at 53.66%. The company pays a dividend with a yield of 1.92%, supported by stable dividend payments though free cash flow coverage appears tight, suggesting caution around distribution sustainability.
Nutanix, Inc.
Nutanix presents a mixed ratio profile, with favorable liquidity demonstrated by a current ratio of 1.72 and strong interest coverage of 11.15. However, profitability is weaker with a net margin of 7.42% and negative return on equity at -27.12%. The company does not pay dividends, focusing instead on reinvestment and growth, reflected in high research and development spending. Leverage metrics are favorable, with a negative debt-to-equity ratio suggesting net cash or low debt levels, supporting financial flexibility.
Which one has the best ratios?
Nutanix shows a more favorable overall ratio profile with 50% of its ratios positive, particularly in liquidity and debt management, while Gen Digital’s higher profitability is offset by weaker liquidity and higher leverage. Nutanix’s reinvestment strategy contrasts with Gen Digital’s dividend payments, affecting their financial flexibility and risk profiles differently. Overall, Nutanix’s ratios are slightly more favorable under current evaluation.
Strategic Positioning
This section compares the strategic positioning of Gen Digital Inc. and Nutanix, Inc., focusing on market position, key segments, and exposure to technological disruption:
Gen Digital Inc.
- Leading in consumer cybersecurity with global presence and moderate competitive pressure.
- Key segments include cyber safety solutions, identity theft protection, and privacy services.
- Exposed to evolving cyber threats requiring constant innovation in security technologies.
Nutanix, Inc.
- Competes in enterprise cloud platforms with a strong presence in various industries.
- Offers enterprise cloud infrastructure, virtualization, and cloud-native management solutions.
- Faces disruption in cloud computing and hybrid cloud orchestration technologies.
Gen Digital Inc. vs Nutanix, Inc. Positioning
Gen Digital is focused on diversified consumer cybersecurity products with a broad geographic reach. Nutanix concentrates on enterprise cloud infrastructure and hybrid cloud services across multiple industries, highlighting different market and product concentration strategies.
Which has the best competitive advantage?
Nutanix shows a very favorable moat with growing ROIC and value creation, indicating a durable competitive advantage. Gen Digital has a very unfavorable moat with declining ROIC, suggesting it is currently destroying value.
Stock Comparison
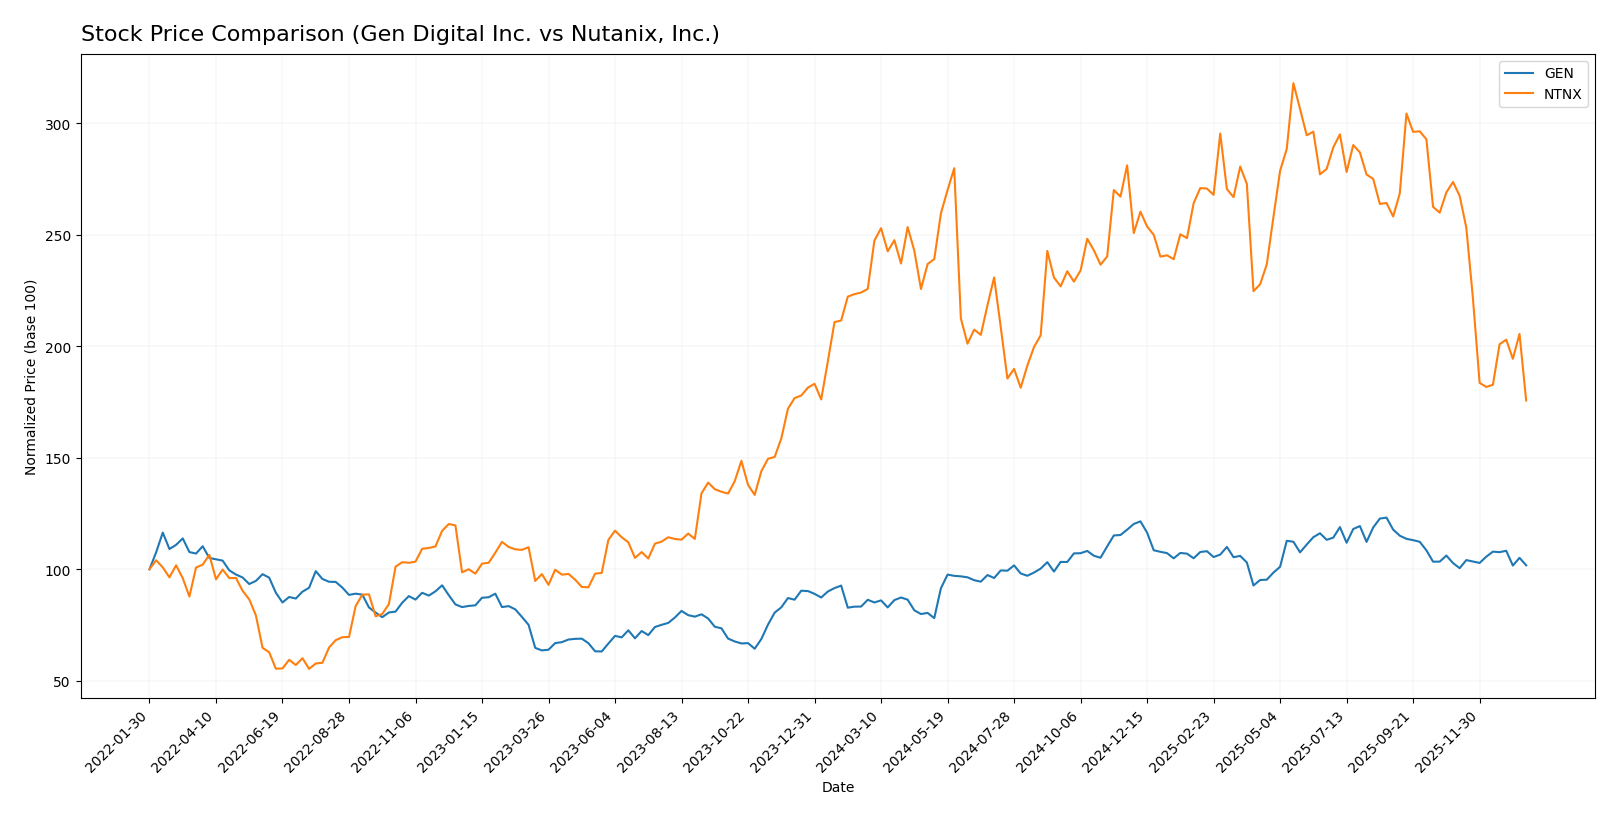
The stock prices of Gen Digital Inc. and Nutanix, Inc. over the past year show contrasting dynamics, with Gen exhibiting a bullish trend amid decelerating gains, while Nutanix faces a pronounced bearish trajectory with significant volatility.
Trend Analysis
Gen Digital Inc. experienced a 17.89% price increase over the past 12 months, indicating a bullish trend with decelerating momentum and moderate volatility (std deviation 2.59). The stock ranged between 20.03 and 31.58.
Nutanix, Inc. posted a -22.16% price change in the same period, reflecting a bearish trend with decelerating losses and high volatility (std deviation 8.67). Its price fluctuated from 45.74 to 82.77.
Comparatively, Gen Digital outperformed Nutanix by delivering positive market returns, while Nutanix showed a marked decline, making Gen the stronger market performer over the past year.
Target Prices
Analysts present a clear target price consensus for both Gen Digital Inc. and Nutanix, Inc.
| Company | Target High | Target Low | Consensus |
|---|---|---|---|
| Gen Digital Inc. | 32 | 31 | 31.5 |
| Nutanix, Inc. | 90 | 53 | 64.67 |
The target consensus for Gen Digital Inc. is moderately above its current price of 26.1 USD, indicating modest upside potential. Nutanix, Inc.’s consensus target of 64.67 USD suggests a significant expected price appreciation from its current 45.74 USD.
Analyst Opinions Comparison
This section compares analysts’ ratings and grades for Gen Digital Inc. and Nutanix, Inc.:
Rating Comparison
Gen Digital Inc. Rating
- Rating: B, considered very favorable overall.
- Discounted Cash Flow Score: 5, very favorable, indicating strong cash flow projections.
- Return on Equity Score: 5, very favorable, showing efficient profit generation from equity.
- Return on Assets Score: 3, moderate, average asset utilization effectiveness.
- Debt To Equity Score: 1, very unfavorable, signaling high financial risk.
- Overall Score: 3, moderate, reflecting balanced but mixed financial health indicators.
Nutanix, Inc. Rating
- Rating: C+, also marked very favorable overall.
- Discounted Cash Flow Score: 4, favorable, reflecting solid but lower cash flow prospects.
- Return on Equity Score: 1, very unfavorable, indicating weak profit generation from equity.
- Return on Assets Score: 4, favorable, demonstrating better asset utilization than Gen.
- Debt To Equity Score: 1, very unfavorable, also indicating significant financial risk.
- Overall Score: 2, moderate, showing somewhat weaker overall financial standing.
Which one is the best rated?
Gen Digital Inc. is generally better rated due to higher scores in discounted cash flow and return on equity, despite both companies sharing very unfavorable debt-to-equity scores and moderate overall ratings. Nutanix shows stronger asset utilization but weaker equity returns.
Scores Comparison
Here is a comparison of the Altman Z-Score and Piotroski Score for Gen Digital Inc. and Nutanix, Inc.:
Gen Digital Inc. Scores
- Altman Z-Score: 1.25, in the distress zone indicating high bankruptcy risk.
- Piotroski Score: 6, indicating average financial strength.
Nutanix, Inc. Scores
- Altman Z-Score: 1.48, in the distress zone indicating high bankruptcy risk.
- Piotroski Score: 6, indicating average financial strength.
Which company has the best scores?
Both Gen Digital Inc. and Nutanix, Inc. show Altman Z-Scores in the distress zone, signaling financial risk. Their Piotroski Scores are identical at 6, reflecting average financial strength for both companies based on the provided data.
Grades Comparison
Here is the detailed grades comparison for Gen Digital Inc. and Nutanix, Inc.:
Gen Digital Inc. Grades
The following table summarizes recent grades from recognized financial institutions for Gen Digital Inc.:
| Grading Company | Action | New Grade | Date |
|---|---|---|---|
| RBC Capital | maintain | Sector Perform | 2025-11-07 |
| Evercore ISI Group | maintain | Outperform | 2025-11-07 |
| Morgan Stanley | maintain | Equal Weight | 2025-09-02 |
| Barclays | maintain | Equal Weight | 2025-08-08 |
| Wells Fargo | maintain | Overweight | 2025-08-08 |
| RBC Capital | maintain | Sector Perform | 2025-08-08 |
| Barclays | maintain | Equal Weight | 2025-07-14 |
| RBC Capital | maintain | Sector Perform | 2025-05-07 |
| Morgan Stanley | maintain | Equal Weight | 2025-04-16 |
| RBC Capital | maintain | Sector Perform | 2025-01-31 |
Gen Digital’s grades show a consistent pattern of “Sector Perform” and “Equal Weight” ratings, with some “Overweight” and “Outperform” ratings maintained, indicating a stable outlook.
Nutanix, Inc. Grades
The following table summarizes recent grades from recognized financial institutions for Nutanix, Inc.:
| Grading Company | Action | New Grade | Date |
|---|---|---|---|
| Barclays | downgrade | Equal Weight | 2026-01-15 |
| Morgan Stanley | downgrade | Equal Weight | 2026-01-12 |
| RBC Capital | maintain | Outperform | 2026-01-05 |
| Goldman Sachs | maintain | Buy | 2025-11-28 |
| JP Morgan | maintain | Overweight | 2025-11-26 |
| Needham | maintain | Buy | 2025-11-26 |
| Wells Fargo | maintain | Equal Weight | 2025-11-26 |
| Morgan Stanley | maintain | Overweight | 2025-11-26 |
| Keybanc | maintain | Overweight | 2025-11-26 |
| Piper Sandler | maintain | Overweight | 2025-11-26 |
Nutanix shows a range of mostly “Overweight” and “Buy” ratings, though recent downgrades to “Equal Weight” by Barclays and Morgan Stanley suggest increased caution.
Which company has the best grades?
Nutanix, Inc. has received generally more favorable grades with multiple “Buy” and “Overweight” ratings, despite recent downgrades, while Gen Digital’s grades remain more neutral with “Sector Perform” and “Equal Weight” predominating. This contrast may indicate differing market sentiment and risk perceptions for investors.
Strengths and Weaknesses
Below is a comparison of key strengths and weaknesses for Gen Digital Inc. (GEN) and Nutanix, Inc. (NTNX) based on the latest financial and operational data.
| Criterion | Gen Digital Inc. (GEN) | Nutanix, Inc. (NTNX) |
|---|---|---|
| Diversification | Strong in Cyber Safety with $3.9B revenue (2025); Legacy products minimal | Focused on Subscription and Professional Services with steady growth |
| Profitability | Net margin 16.3%, ROE 28.3%, but ROIC slightly below WACC, value destroying | Moderate net margin 7.4%, negative ROE, but ROIC exceeds WACC, creating value |
| Innovation | Legacy segment declining; innovation centered on Cyber Safety | Growing ROIC and positive trend suggest strong innovation and competitive advantage |
| Global presence | Established global cybersecurity footprint | Expanding cloud infrastructure presence worldwide |
| Market Share | Leading in consumer cybersecurity | Growing share in enterprise cloud solutions |
Key takeaways: Gen Digital demonstrates strong profitability but struggles with capital efficiency and value creation, reflecting some operational weaknesses. Nutanix shows a durable competitive advantage with improving profitability and innovation, despite current profitability challenges. Investors should weigh Gen’s market position against Nutanix’s growth potential and risk profile.
Risk Analysis
Below is a comparative table outlining key risks for Gen Digital Inc. (GEN) and Nutanix, Inc. (NTNX) based on the most recent 2025 data:
| Metric | Gen Digital Inc. (GEN) | Nutanix, Inc. (NTNX) |
|---|---|---|
| Market Risk | Moderate (Beta 1.08) | Lower (Beta 0.49) |
| Debt level | High (Debt/Equity 3.66, Debt/Assets 53.66%) | Moderate (Debt/Equity -2.14, Debt/Assets 45.16%) |
| Regulatory Risk | Moderate (Cybersecurity compliance) | Moderate (Cloud/Enterprise regulations) |
| Operational Risk | Moderate (Subscription-based model) | Moderate (Cloud platform complexity) |
| Environmental Risk | Low | Low |
| Geopolitical Risk | Moderate (Global operations) | Moderate (Global operations) |
The most impactful risks for both companies are financial leverage and market exposure. Gen Digital carries a high debt burden with unfavorable liquidity ratios, raising financial distress concerns. Nutanix shows better liquidity but has negative equity metrics, suggesting potential financial instability. Both face moderate regulatory and geopolitical risks due to their global technology operations. Investors should carefully monitor debt levels and operational execution.
Which Stock to Choose?
Gen Digital Inc. (GEN) shows moderate income growth with a 3.55% revenue increase in 2025 and favorable profitability metrics like a 16.34% net margin and 28.34% ROE. However, it carries a high debt ratio (DE 3.66) and low liquidity (current ratio 0.51), with an overall slightly unfavorable financial ratios profile. The company is rated B with a very favorable rating, but its Altman Z-Score indicates distress, and its MOAT evaluation signals value destruction and declining ROIC.
Nutanix, Inc. (NTNX) exhibits stronger income growth with an 18.11% revenue rise in 2025 and favorable income statement trends, including a 7.42% net margin and improving net margin growth. Its financial ratios are slightly favorable overall, supported by strong liquidity (current ratio 1.72) and lower debt risk (negative DE). NTNX holds a C+ rating with very favorable overall status, but its Altman Z-Score also suggests distress, despite a very favorable MOAT evaluation reflecting value creation and rising ROIC.
Investors prioritizing stable financial health and profitability might find GEN’s strong ROE and favorable rating appealing, despite its debt concerns and value destruction signs. Conversely, those focused on growth potential and competitive advantage could interpret NTNX’s improving income growth and very favorable MOAT as positive, albeit with caution due to its distress zone Z-Score and overall moderate rating.
Disclaimer: Investment carries a risk of loss of initial capital. The past performance is not a reliable indicator of future results. Be sure to understand risks before making an investment decision.
Go Further
I encourage you to read the complete analyses of Gen Digital Inc. and Nutanix, Inc. to enhance your investment decisions: