Home > Comparison > Industrials > GE vs TDG
The strategic rivalry between GE Aerospace and TransDigm Group defines the current trajectory of the Aerospace & Defense sector. GE Aerospace operates as a capital-intensive industrial giant focused on jet engines and integrated systems. In contrast, TransDigm Group thrives as a high-margin component supplier specializing in aircraft subsystems and controls. This analysis evaluates which business model offers superior risk-adjusted returns amid evolving industry dynamics, guiding portfolio allocation decisions.

Table of contents
Companies Overview
GE Aerospace and TransDigm Group Incorporated both maintain pivotal roles in the aerospace and defense sector, driving innovation and supply chain strength.
GE Aerospace: Engine Powerhouse and Systems Integrator
GE Aerospace dominates as a leading manufacturer of jet and turboprop engines for commercial and military aircraft. Its revenue primarily stems from designing, producing, and servicing engines through its Commercial Engines & Services and Defense & Propulsion Technologies segments. In 2026, GE focuses strategically on expanding integrated systems and additive manufacturing capabilities to enhance operational efficiency.
TransDigm Group Incorporated: Critical Components Specialist
TransDigm Group excels as a designer and supplier of specialized aircraft components across power, control, airframe, and non-aviation segments. Its core revenue derives from high-margin aerospace parts servicing OEMs, airlines, and military clients. The 2026 strategy emphasizes broadening its product portfolio and strengthening aftermarket sales channels for sustained growth.
Strategic Collision: Similarities & Divergences
GE Aerospace pursues a vertically integrated model focusing on engine systems, while TransDigm champions a diversified parts supplier approach. Their competitive battleground centers on aftermarket aerospace services and component innovation. Investors will note GE’s scale and technological depth contrast with TransDigm’s niche specialization and margin focus, defining distinct risk and growth profiles.
Income Statement Comparison
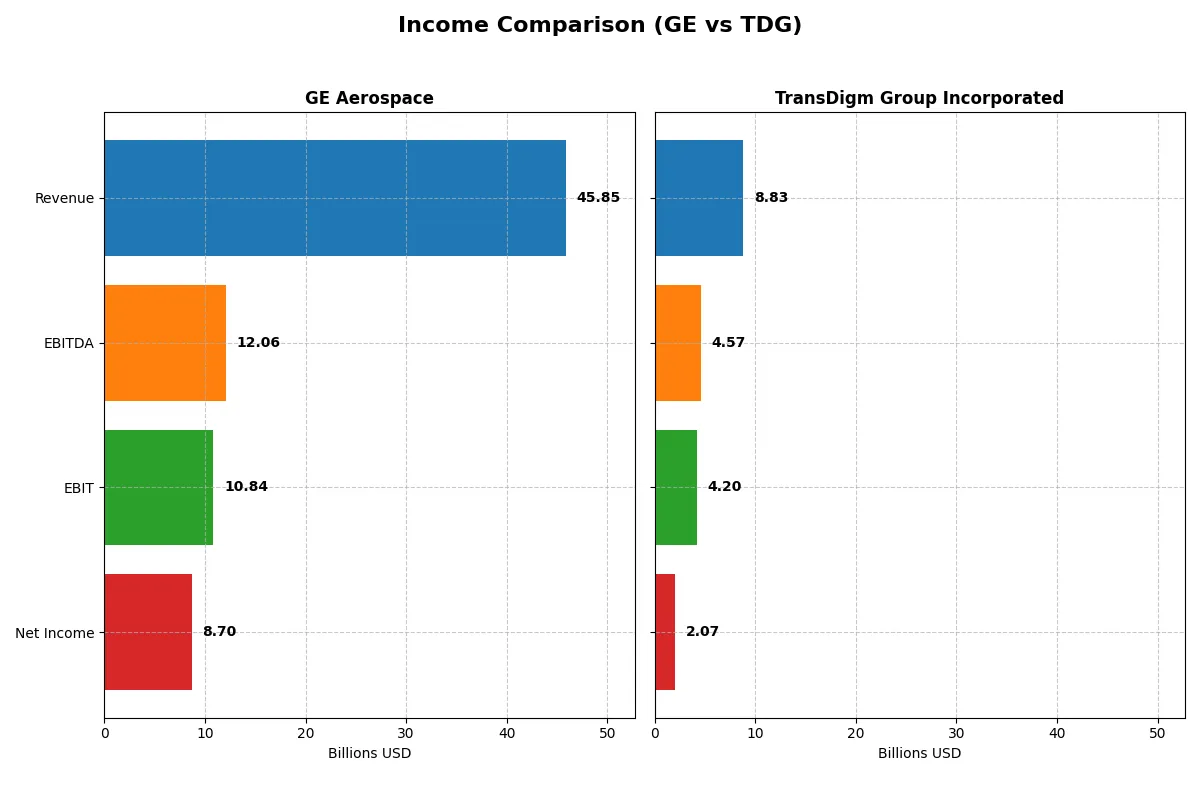
This data dissects the core profitability and scalability of both corporate engines to reveal who dominates the bottom line:
| Metric | GE Aerospace (GE) | TransDigm Group (TDG) |
|---|---|---|
| Revenue | 45.9B | 8.8B |
| Cost of Revenue | 28.97B | 3.52B |
| Operating Expenses | 8.12B | 1.15B |
| Gross Profit | 16.89B | 5.31B |
| EBITDA | 12.06B | 4.57B |
| EBIT | 10.84B | 4.20B |
| Interest Expense | 843M | 1.57B |
| Net Income | 8.70B | 2.07B |
| EPS | 8.16 | 32.08 |
| Fiscal Year | 2025 | 2025 |
Income Statement Analysis: The Bottom-Line Duel
This income statement comparison exposes which company runs a more efficient and profitable business engine in 2025.
GE Aerospace Analysis
GE Aerospace’s revenue climbed 18% from 2024 to 2025, reaching $45.9B. Net income surged 33% to $8.7B, reflecting strong bottom-line momentum. Margins stay healthy, with a gross margin near 37% and a net margin around 19%, signaling efficient cost controls and solid profitability in the latest fiscal year.
TransDigm Group Incorporated Analysis
TransDigm’s revenue grew 11% to $8.8B in fiscal 2025, with net income rising 21% to $2.1B. Its gross margin impresses at 60%, and net margin hits 23.5%, showcasing robust pricing power despite a heavy interest expense of 17.8% of revenue. The company maintains strong operational leverage and steady margin expansion.
Verdict: Margin Power vs. Revenue Scale
GE Aerospace delivers larger scale with $45.9B revenue and robust margin expansion, while TransDigm excels in margin dominance and disciplined growth. GE’s broader revenue base and rapid net income growth make it the fundamental winner in scale and absolute earnings. Investors seeking high-margin, niche operator profiles may prefer TransDigm’s efficient model.
Financial Ratios Comparison
These vital ratios act as a diagnostic tool to expose the underlying fiscal health, valuation premiums, and capital efficiency of the companies under review:
| Ratios | GE Aerospace (GE) | TransDigm Group (TDG) |
|---|---|---|
| ROE | 46.6% | -21.4% |
| ROIC | 8.1% | 15.2% |
| P/E | 37.8 | 37.0 |
| P/B | 17.6 | -7.9 |
| Current Ratio | 1.04 | 3.21 |
| Quick Ratio | 0.74 | 2.25 |
| D/E | 1.10 | -3.10 |
| Debt-to-Assets | 15.7% | 131.1% |
| Interest Coverage | 10.4 | 2.65 |
| Asset Turnover | 0.35 | 0.39 |
| Fixed Asset Turnover | 5.74 | 5.59 |
| Payout Ratio | 16.7% | 464.3% |
| Dividend Yield | 0.44% | 12.55% |
| Fiscal Year | 2025 | 2025 |
Efficiency & Valuation Duel: The Vital Signs
Financial ratios serve as a company’s DNA, exposing hidden risks and operational strengths that numbers alone cannot reveal.
GE Aerospace
GE Aerospace shows impressive profitability with a 46.6% ROE and a solid 18.98% net margin, signaling operational strength. The stock trades at a stretched P/E of 37.76 and a high P/B of 17.6, suggesting expensive valuation. Shareholder returns include a modest 0.44% dividend yield, reflecting cautious capital allocation amid growth and reinvestment.
TransDigm Group Incorporated
TransDigm delivers a strong 23.49% net margin and a robust 15.22% ROIC, indicating efficient capital use despite a negative 21.41% ROE, likely due to capital structure. Its P/E of 36.99 is elevated, reflecting high market expectations. The company yields a hefty 12.55% dividend, emphasizing cash returns over reinvestment.
Premium Valuation vs. Operational Safety
GE Aerospace offers superior profitability and a balanced risk profile but trades at a premium with limited dividend income. TransDigm’s higher dividend yield appeals to income-focused investors despite its negative ROE and debt concerns. Investors seeking operational safety may prefer GE, while those prioritizing income might lean toward TransDigm.
Which one offers the Superior Shareholder Reward?
I observe GE Aerospace pays a modest 0.44% dividend yield with a 17% payout ratio, supported by solid free cash flow coverage near 85%. Its buyback activity is modest but consistent, balancing growth and shareholder returns prudently. TransDigm delivers a striking 12.55% dividend yield, but with payout ratios exceeding 100%, signaling unsustainable dividends likely funded by debt. TDG’s aggressive buybacks amplify total return but raise financial risk given its negative equity and high leverage. I conclude GE Aerospace offers a more sustainable and balanced shareholder reward in 2026, prioritizing steady growth and prudent capital allocation over risky yield chasing.
Comparative Score Analysis: The Strategic Profile
The radar chart reveals the fundamental DNA and trade-offs of GE Aerospace and TransDigm Group Incorporated, highlighting their financial strengths and vulnerabilities:
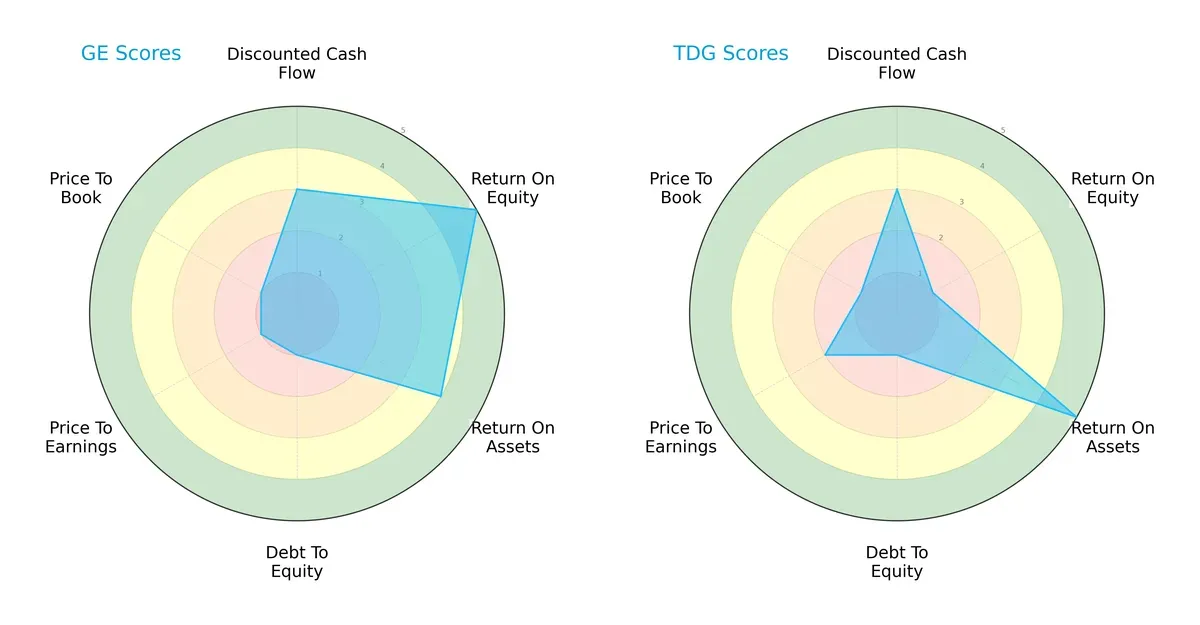
GE Aerospace shows a more balanced profile with solid ROE (5) and ROA (4) scores, but it struggles with valuation and leverage metrics, scoring very low on debt/equity (1) and valuation (PE/PB at 1). TransDigm relies heavily on asset efficiency (ROA 5) but has a weak ROE (1) and similarly poor leverage management (debt/equity 1). GE’s diversified strengths contrast with TransDigm’s concentrated operational edge.
Bankruptcy Risk: Solvency Showdown
The Altman Z-Score gap signals differing survival prospects in this cycle:
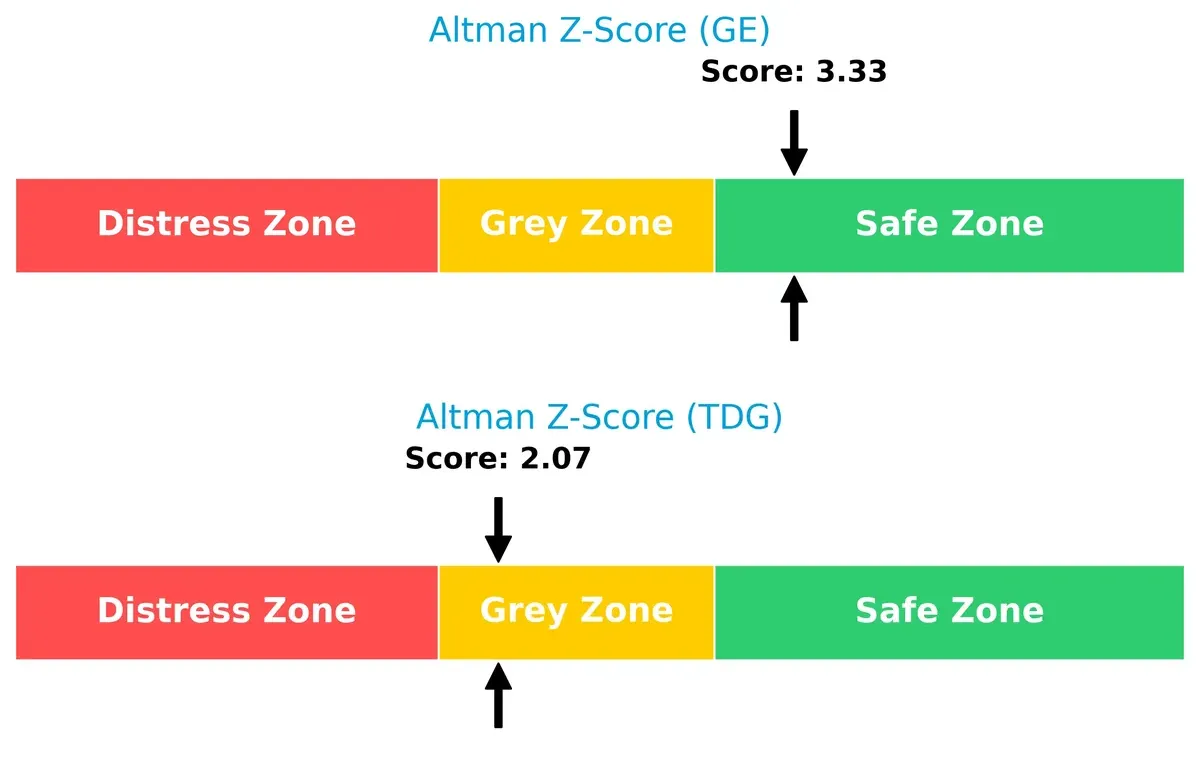
GE Aerospace’s score of 3.33 places it firmly in the safe zone, indicating strong solvency. TransDigm’s 2.07 falls in the grey zone, suggesting moderate bankruptcy risk and a need for caution in turbulent markets.
Financial Health: Quality of Operations
Piotroski F-Scores reflect internal financial robustness:
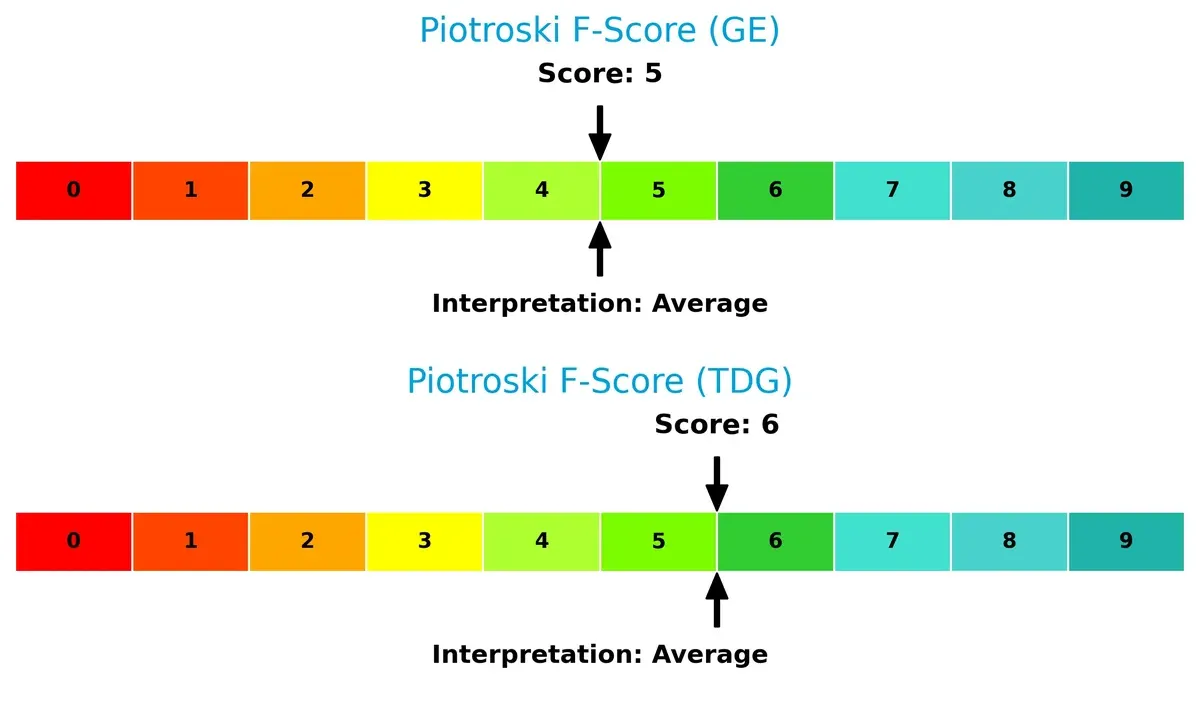
Both firms exhibit average financial health with scores of 5 (GE) and 6 (TransDigm). Neither shows clear red flags, but TransDigm edges slightly ahead, signaling marginally better operational quality and internal controls.
How are the two companies positioned?
This section dissects the operational DNA of GE Aerospace and TransDigm by comparing their revenue distribution and internal dynamics. The goal is to confront their economic moats to identify which offers the most resilient and sustainable competitive advantage today.
Revenue Segmentation: The Strategic Mix
The following visual comparison dissects how GE Aerospace and TransDigm Group Incorporated diversify their income streams and reveals their primary sector bets:
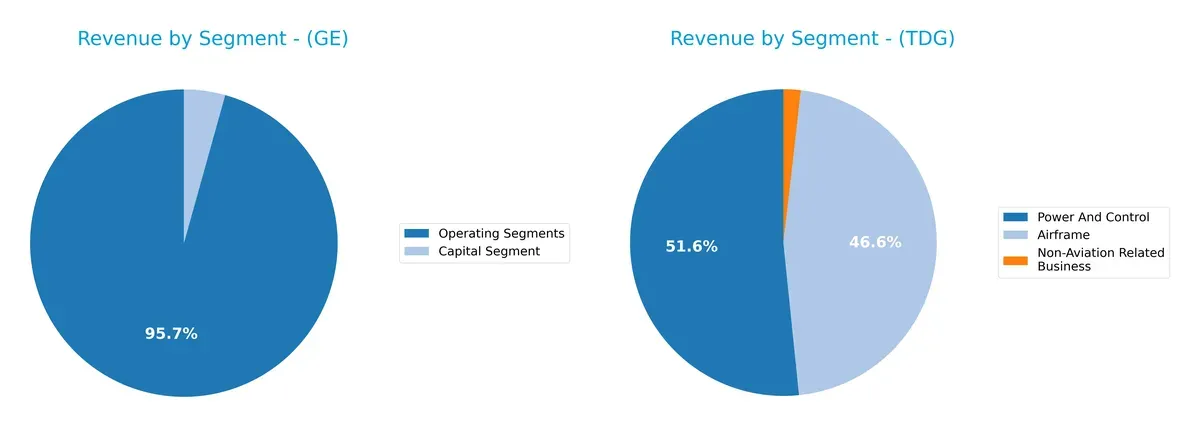
GE Aerospace leverages a broad portfolio, with Aerospace Segment revenue at $31.8B anchoring its mix alongside $17.7B in Power and $15.1B in Renewable Energy. This diversity lowers concentration risk and supports infrastructure dominance. By contrast, TransDigm pivots heavily on Airframe ($4.1B) and Power & Control ($4.6B), with minimal non-aviation revenue ($160M). This concentration reflects deep ecosystem lock-in but heightens exposure to aerospace sector cycles.
Strengths and Weaknesses Comparison
This table compares the strengths and weaknesses of GE Aerospace and TransDigm Group Incorporated:
GE Aerospace Strengths
- Diverse revenue streams across aerospace, power, renewable energy
- Strong net margin of 18.98% and high ROE at 46.6%
- Favorable debt-to-assets ratio at 15.74%
- Solid interest coverage ratio of 12.86
- Global presence with balanced US and non-US sales
TransDigm Group Incorporated Strengths
- Higher net margin at 23.49% and favorable ROIC at 15.22%
- Lower WACC at 7.09%, supporting capital efficiency
- Strong quick ratio at 2.25 and favorable debt-to-equity ratio
- Positive PB ratio indicating market confidence
- Focused product segments with consistent revenue growth
GE Aerospace Weaknesses
- Unfavorable PE at 37.76 and high PB at 17.6, indicating valuation concerns
- Quick ratio low at 0.74 and debt-to-equity high at 1.1
- Asset turnover weak at 0.35, limiting operational efficiency
- Dividend yield low at 0.44%
- Slightly unfavorable overall financial ratios
TransDigm Group Incorporated Weaknesses
- Negative ROE at -21.41% signals profitability challenges
- Debt-to-assets extremely high at 131.08%
- Unfavorable current ratio at 3.21 may indicate liquidity mismatch
- Asset turnover low at 0.39
- Neutral interest coverage ratio at 2.67
GE Aerospace shows strength in diversification and profitability but faces valuation and liquidity pressures. TransDigm excels in capital efficiency and margin but struggles with leverage and return on equity. Both companies must balance financial structure with operational execution in their strategies.
The Moat Duel: Analyzing Competitive Defensibility
A structural moat alone shields long-term profits from relentless competition and market pressures. Here’s how two aerospace giants defend their turf:
GE Aerospace: Engineering Intangible Assets
GE Aerospace’s moat stems from its proprietary jet engine technologies and integrated systems. This shows in its improving profitability despite an overall value destruction signal. Expansion in defense propulsion could fortify its moat in 2026.
TransDigm Group Incorporated: Dominant Cost Advantage
TransDigm leverages a strong cost advantage through specialized, high-margin aircraft components. Its ROIC far exceeds WACC, reflecting efficient capital use and margin power. Continued product innovation supports growth and market disruption potential.
Verdict: Intangible Assets vs. Cost Leadership
TransDigm’s cost advantage delivers a wider and deeper moat than GE’s intangible assets. Its superior ROIC and margin stability position it better to defend and extend market share in 2026.
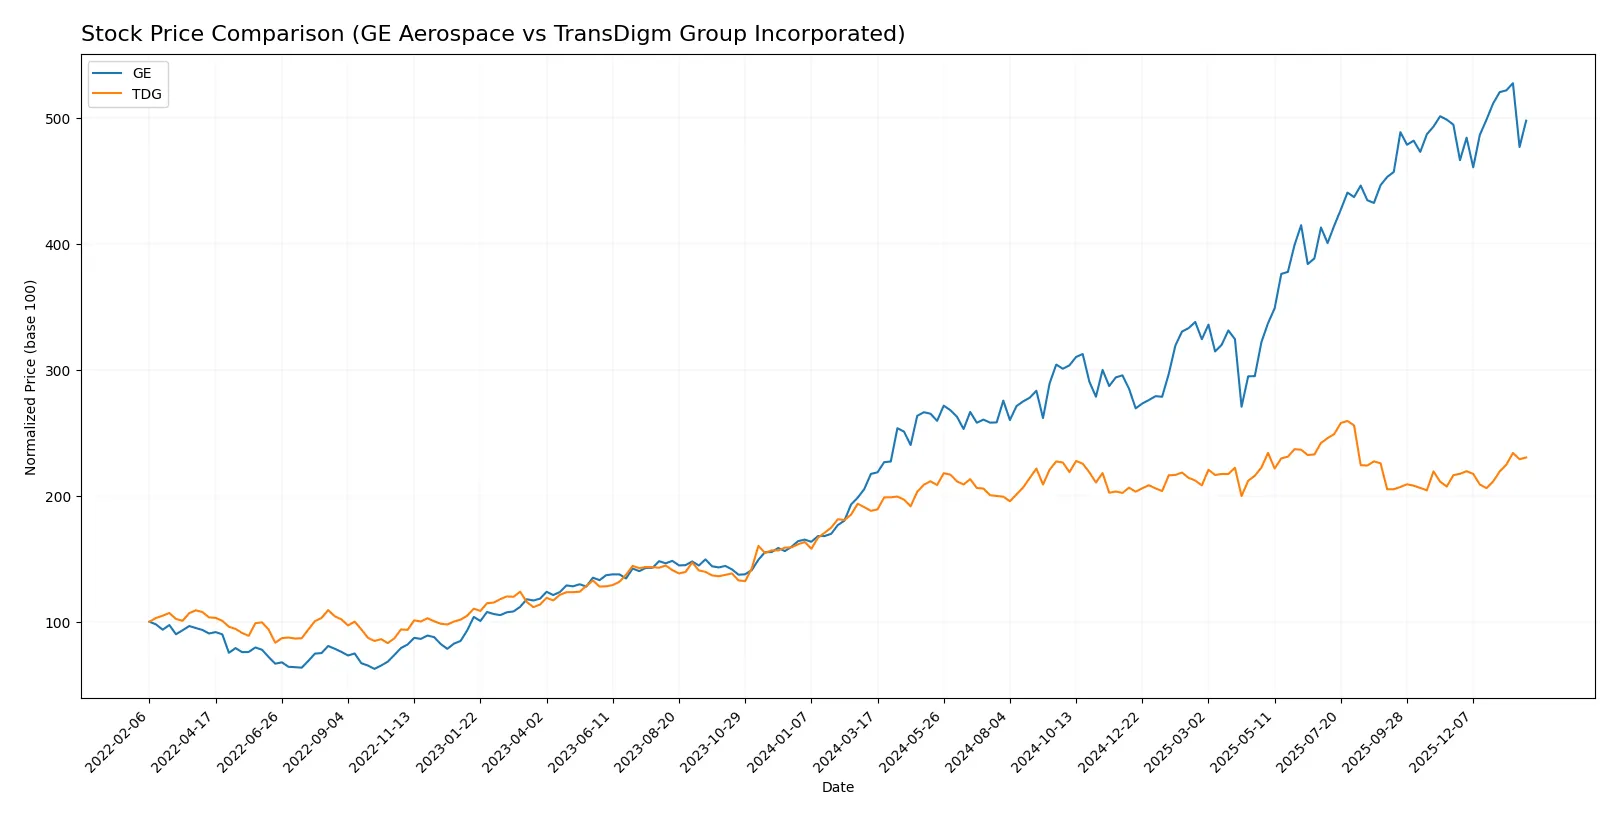
Which stock offers better returns?
Over the past year, GE Aerospace and TransDigm Group Incorporated showed significant price appreciation, with distinct trading volumes and momentum shifts shaping their market dynamics.
Trend Comparison
GE Aerospace’s stock rose 129.03% over the past year, marking a bullish trend with decelerating momentum and volatility at 56.42. The price peaked at 325.12 and bottomed at 133.95.
TransDigm Group’s stock increased 22.54%, also bullish but accelerating. It showed higher volatility at 87.29, reaching a high of 1607.45 and a low of 1164.99 throughout the year.
GE Aerospace delivered the highest market performance with a 129.03% gain, outperforming TransDigm Group’s 22.54% rise over the same period.
Target Prices
Analysts project strong upside potential for GE Aerospace and TransDigm Group based on current consensus targets.
| Company | Target Low | Target High | Consensus |
|---|---|---|---|
| GE Aerospace | 374 | 387 | 380.33 |
| TransDigm Group Incorporated | 1370 | 1871 | 1601.5 |
The consensus target for GE Aerospace suggests a 24% premium to its current 307 price. TransDigm’s target implies a 12% upside from 1428, signaling bullish analyst sentiment for both aerospace stocks.

Don’t Let Luck Decide Your Entry Point
Optimize your entry points with our advanced ProRealTime indicators. You’ll get efficient buy signals with precise price targets for maximum performance. Start outperforming now!
How do institutions grade them?
This section compares the latest institutional grades for GE Aerospace and TransDigm Group Incorporated:
GE Aerospace Grades
The following table summarizes recent grades from major financial institutions for GE Aerospace:
| Grading Company | Action | New Grade | Date |
|---|---|---|---|
| JP Morgan | Maintain | Overweight | 2026-01-26 |
| Citigroup | Maintain | Buy | 2026-01-23 |
| UBS | Maintain | Buy | 2026-01-23 |
| UBS | Maintain | Buy | 2026-01-15 |
| Citigroup | Maintain | Buy | 2026-01-13 |
| JP Morgan | Maintain | Overweight | 2025-10-27 |
| B of A Securities | Maintain | Buy | 2025-10-27 |
| UBS | Maintain | Buy | 2025-10-22 |
| RBC Capital | Maintain | Outperform | 2025-10-22 |
| Barclays | Maintain | Overweight | 2025-07-23 |
TransDigm Group Incorporated Grades
The following table presents recent institutional grades for TransDigm Group Incorporated:
| Grading Company | Action | New Grade | Date |
|---|---|---|---|
| UBS | Maintain | Buy | 2026-01-15 |
| JP Morgan | Maintain | Neutral | 2025-11-14 |
| Morgan Stanley | Maintain | Overweight | 2025-11-14 |
| RBC Capital | Maintain | Sector Perform | 2025-11-13 |
| UBS | Maintain | Buy | 2025-11-13 |
| BMO Capital | Maintain | Outperform | 2025-11-13 |
| Stifel | Maintain | Buy | 2025-11-13 |
| Truist Securities | Maintain | Buy | 2025-10-15 |
| Morgan Stanley | Maintain | Overweight | 2025-10-15 |
| Susquehanna | Maintain | Neutral | 2025-10-09 |
Which company has the best grades?
GE Aerospace consistently receives “Buy” and “Overweight” ratings, with an “Outperform” from RBC Capital. TransDigm’s grades vary more, including “Buy,” “Overweight,” and some “Neutral” ratings. GE Aerospace’s steadier, more positive grades suggest stronger institutional confidence, potentially influencing investor sentiment toward stability.
Risks specific to each company
The following categories identify the critical pressure points and systemic threats facing both firms in the 2026 market environment:
1. Market & Competition
GE Aerospace
- Faces intense competition in commercial and military aerospace sectors, with pressure on margins from innovation cycles and supply costs.
TransDigm Group Incorporated
- Operates in specialized aerospace components niche, but faces pricing pressure and reliance on key customers, limiting growth flexibility.
2. Capital Structure & Debt
GE Aerospace
- Debt-to-equity ratio of 1.1 signals high leverage risk; interest coverage is strong but balance sheet fragile given valuation multiples.
TransDigm Group Incorporated
- Negative debt-to-equity and debt-to-assets above 130% indicate aggressive financial structuring, raising solvency concerns despite decent interest coverage.
3. Stock Volatility
GE Aerospace
- Beta at 1.4 shows above-market volatility; stock price range wide, reflecting sensitivity to market cycles and sector shifts.
TransDigm Group Incorporated
- Lower beta of 0.92 indicates less volatility, but stock price remains high, exposing investors to valuation correction risks.
4. Regulatory & Legal
GE Aerospace
- Subject to aerospace and defense regulations globally; geopolitical tensions could amplify compliance costs.
TransDigm Group Incorporated
- Faces similar regulatory scrutiny, with added risk from product safety and export controls in niche components markets.
5. Supply Chain & Operations
GE Aerospace
- Complex global supply chains vulnerable to disruptions; reliance on advanced materials challenges cost control.
TransDigm Group Incorporated
- Supply chain more fragmented; dependence on specialized suppliers and logistics increases operational risk amid global uncertainties.
6. ESG & Climate Transition
GE Aerospace
- Active in developing sustainable engine technologies, but faces pressure to accelerate emissions reduction in aviation.
TransDigm Group Incorporated
- ESG efforts less visible; high energy intensity in manufacturing may pose transition risks and investor scrutiny.
7. Geopolitical Exposure
GE Aerospace
- Exposure to US and allied defense contracts offers stability but limits diversification; trade tensions risk supply chain delays.
TransDigm Group Incorporated
- International sales and components exposure create vulnerability to sanctions, tariffs, and geopolitical trade barriers.
Which company shows a better risk-adjusted profile?
GE Aerospace’s most impactful risk is its leveraged capital structure combined with valuation headwinds. TransDigm’s critical risk lies in its precarious debt and solvency metrics despite stronger profitability. I see GE as having a better risk-adjusted profile given its safer Altman Z-score and more balanced financial ratios. TransDigm’s aggressive leverage and high debt-to-assets ratio demand caution. GE’s stable interest coverage and moderate liquidity contrast with TransDigm’s red flags, justifying my preference for GE in a turbulent 2026 aerospace environment.
Final Verdict: Which stock to choose?
GE Aerospace’s superpower lies in its improving profitability and strong operational efficiency despite a challenging capital structure. Its rapid ROE growth signals a potentially rewarding turnaround, yet investors should watch its elevated leverage and valuation multiples closely. It suits aggressive growth portfolios willing to tolerate financial risk for upside.
TransDigm Group boasts a durable moat with a high ROIC comfortably above its cost of capital, reflecting efficient capital use and recurring revenue strength. Though burdened by heavy debt, its stable cash flow and superior margins offer better safety than GE. It fits well within GARP portfolios seeking quality growth at a reasonable risk.
If you prioritize turnaround potential and operational momentum, GE Aerospace is the compelling choice due to its accelerating profitability and efficiency improvements. However, if you seek durable competitive advantage and relative financial stability, TransDigm offers better stability and a clearer value-creation path, despite its leverage challenges.
Disclaimer: Investment carries a risk of loss of initial capital. The past performance is not a reliable indicator of future results. Be sure to understand risks before making an investment decision.
Go Further
I encourage you to read the complete analyses of GE Aerospace and TransDigm Group Incorporated to enhance your investment decisions: