Home > Comparison > Industrials > GE vs BA
The strategic rivalry between GE Aerospace and The Boeing Company shapes the aerospace and defense sector’s evolution. GE Aerospace operates as a specialized engine and propulsion systems manufacturer, focusing on innovation within industrial aerospace technology. Boeing, by contrast, is a diversified aerospace giant, spanning commercial aircraft, defense, space, and global services. This analysis examines which firm’s operational model offers the superior risk-adjusted return, guiding investors toward the optimal aerospace exposure for diversified portfolios.
Table of contents
Companies Overview
GE Aerospace and The Boeing Company stand as pivotal players shaping the aerospace and defense landscape.
GE Aerospace: Engine Innovator and System Integrator
GE Aerospace dominates as a leading provider of jet and turboprop engines along with integrated aircraft systems. Its revenue primarily stems from designing, manufacturing, and servicing engines across commercial, military, and business aviation sectors. In 2026, the company sharpens its focus on enhancing propulsion technology and broadening its defense systems portfolio.
The Boeing Company: Aerospace Giant with Diversified Wings
The Boeing Company commands the market through its broad portfolio including commercial jetliners, military aircraft, satellites, and space exploration systems. Revenue flows from four key segments: Commercial Airplanes, Defense, Space & Security, Global Services, and Capital. In 2026, Boeing emphasizes innovation in defense technologies and expanding global services to strengthen customer support.
Strategic Collision: Similarities & Divergences
Both firms champion aerospace innovation but diverge in approach—GE Aerospace excels in specialized engine technology, while Boeing operates a more diversified aerospace ecosystem. Their primary battleground lies in the commercial and defense aircraft market, where precision engineering meets broad service integration. Investors face contrasting profiles: GE’s focused propulsion moat versus Boeing’s expansive aerospace footprint.
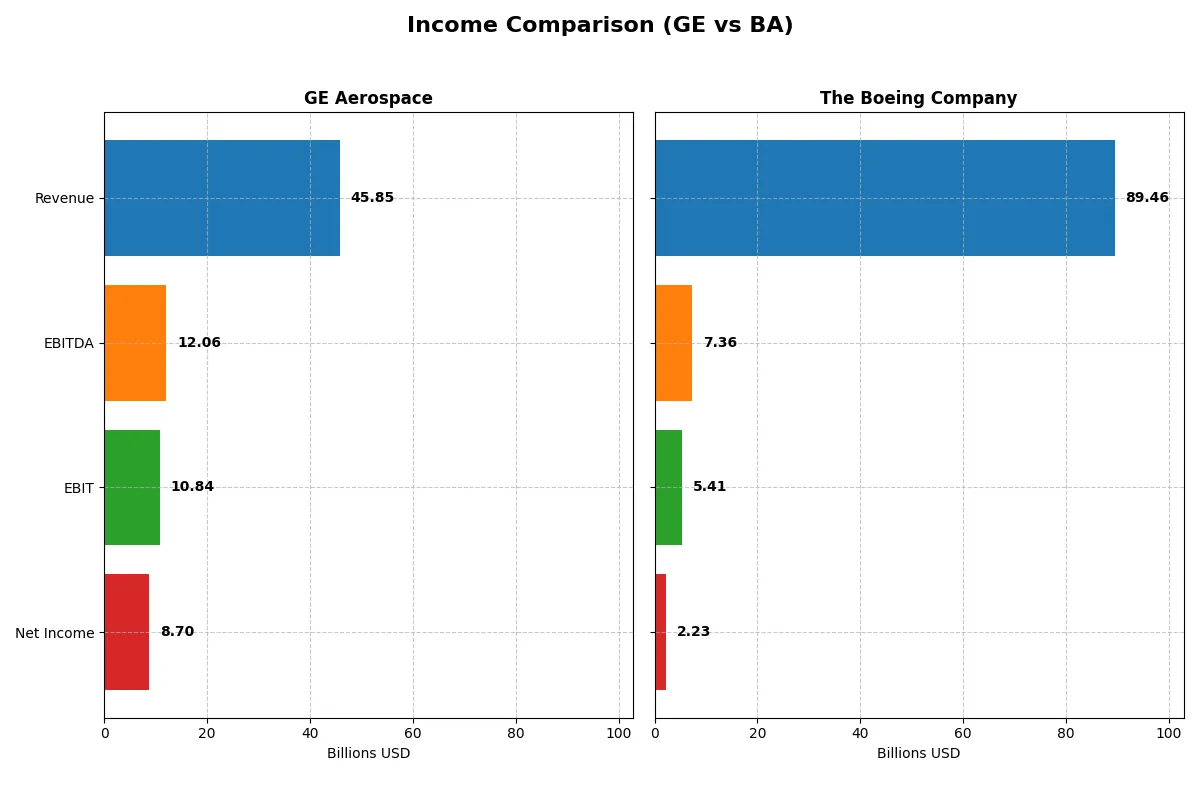
Income Statement Comparison
This data dissects the core profitability and scalability of both corporate engines to reveal who dominates the bottom line:
| Metric | GE Aerospace (GE) | The Boeing Company (BA) |
|---|---|---|
| Revenue | 45.9B | 89.5B |
| Cost of Revenue | 28.97B | 85.17B |
| Operating Expenses | 8.12B | 9.71B |
| Gross Profit | 16.89B | 4.29B |
| EBITDA | 12.06B | 7.36B |
| EBIT | 10.84B | 5.41B |
| Interest Expense | 843M | 2.77B |
| Net Income | 8.70B | 2.24B |
| EPS | 8.16 | 2.49 |
| Fiscal Year | 2025 | 2025 |
Income Statement Analysis: The Bottom-Line Duel
This income statement comparison reveals which company runs a more efficient and profitable business engine in 2025.
GE Aerospace Analysis
GE Aerospace steadily expands revenue from 29B in 2022 to 46B in 2025, with net income surging from a minimal 48M to 8.7B. Its gross margin holds strong at 36.8%, while net margin climbs to nearly 19%, signaling excellent cost control and operational efficiency. The 2025 figures demonstrate robust momentum and superior profitability.
The Boeing Company Analysis
Boeing’s revenue climbs from 62B in 2021 to nearly 90B in 2025, but its net income remains modest at 2.2B, with a slim net margin of 2.5%. Despite a sharp gross profit rebound in 2025, the company struggles with high costs and low EBIT margins around 6%. Boeing shows improving growth but lags on profitability compared to GE.
Margin Power vs. Revenue Scale
GE Aerospace delivers superior profitability with strong margins and efficient cost management. Boeing boasts larger top-line growth but suffers from weak net margins and cost pressures. GE’s income statement profile offers a clearer fundamental winner for investors seeking sustainable earnings power over pure revenue expansion.
Financial Ratios Comparison
These vital ratios act as a diagnostic tool to expose the underlying fiscal health, valuation premiums, and capital efficiency of the companies compared below:
| Ratios | GE Aerospace (GE) | The Boeing Company (BA) |
|---|---|---|
| ROE | 46.6% | 41.0% |
| ROIC | 8.1% | -6.7% |
| P/E | 37.8 | 74.1 |
| P/B | 17.6 | 30.3 |
| Current Ratio | 1.04 | 1.27 |
| Quick Ratio | 0.74 | 0.49 |
| D/E (Debt to Equity) | 1.10 | 9.92 |
| Debt-to-Assets | 15.7% | 32.2% |
| Interest Coverage | 10.4 | -1.95 |
| Asset Turnover | 0.35 | 0.53 |
| Fixed Asset Turnover | 5.74 | 5.73 |
| Payout Ratio | 16.7% | 14.8% |
| Dividend Yield | 0.44% | 0.20% |
| Fiscal Year | 2025 | 2025 |
Efficiency & Valuation Duel: The Vital Signs
Financial ratios serve as the company’s DNA, uncovering hidden risks and revealing operational excellence that raw numbers might obscure.
GE Aerospace
GE Aerospace posts a robust 46.6% ROE and a strong 19% net margin, reflecting high profitability. However, a P/E of 37.8 and P/B of 17.6 mark the stock as expensive. Dividend yield is modest at 0.44%, with reinvestment focused on R&D, signaling growth ambitions despite stretched valuation metrics.
The Boeing Company
Boeing delivers a solid 41% ROE but struggles with a weak 2.5% net margin and negative ROIC at -6.7%. The P/E multiple is very stretched at 74.1, and debt levels remain high with a D/E of 9.9. Dividend yield is low at 0.2%, indicating limited shareholder returns amid operational challenges.
Premium Valuation vs. Operational Safety
GE Aerospace offers a better balance, combining high profitability with manageable debt and investment in growth. Boeing’s high valuation and poor operating returns suggest greater risk. Investors favoring stability and growth may find GE’s profile more aligned with their needs.
Which one offers the Superior Shareholder Reward?
I compare GE Aerospace and The Boeing Company’s shareholder reward models by examining dividend yields, payout ratios, and buyback intensity. GE yields 0.44–0.56%, with a payout ratio around 15–17%, supported by strong free cash flow coverage (3.1x dividend + capex). Boeing’s yield is negligible at 0.2%, with no recent dividends, reflecting reinvestment in restructuring and deleveraging amid negative free cash flow per share (-2.5B). GE executes moderate buybacks, enhancing shareholder returns sustainably. Boeing’s high leverage (debt/equity >9x) and weak operating margins limit buyback capacity. Historically, aerospace firms with stable dividends and consistent buybacks outperform peers. I see GE’s balanced distribution and cash flow discipline as superior for long-term total return in 2026.
Comparative Score Analysis: The Strategic Profile
The radar chart reveals the fundamental DNA and trade-offs of GE Aerospace and The Boeing Company, highlighting their financial strengths and weaknesses:
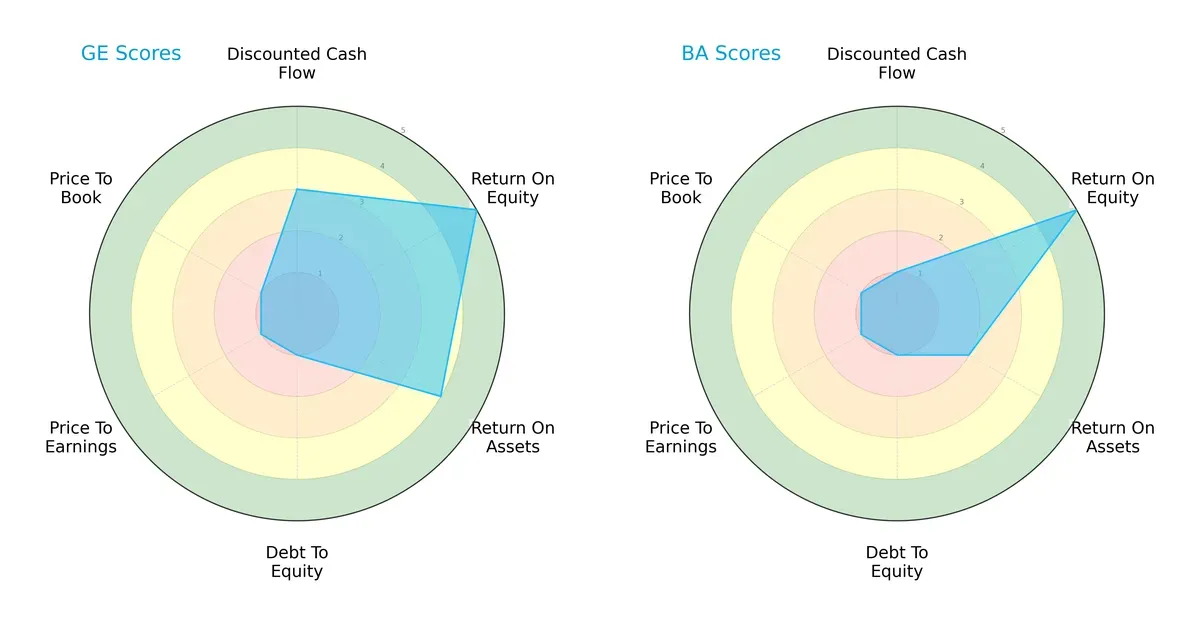
GE Aerospace shows a more balanced profile with moderate DCF (3) and strong profitability scores (ROE 5, ROA 4). However, it suffers from high financial risk with a debt/equity and valuation scores at 1. Boeing matches GE in ROE (5) but lags in ROA (2) and DCF (1), indicating weaker asset efficiency and cash flow outlook. Both face valuation concerns, but GE’s operational efficiency gives it a strategic edge.
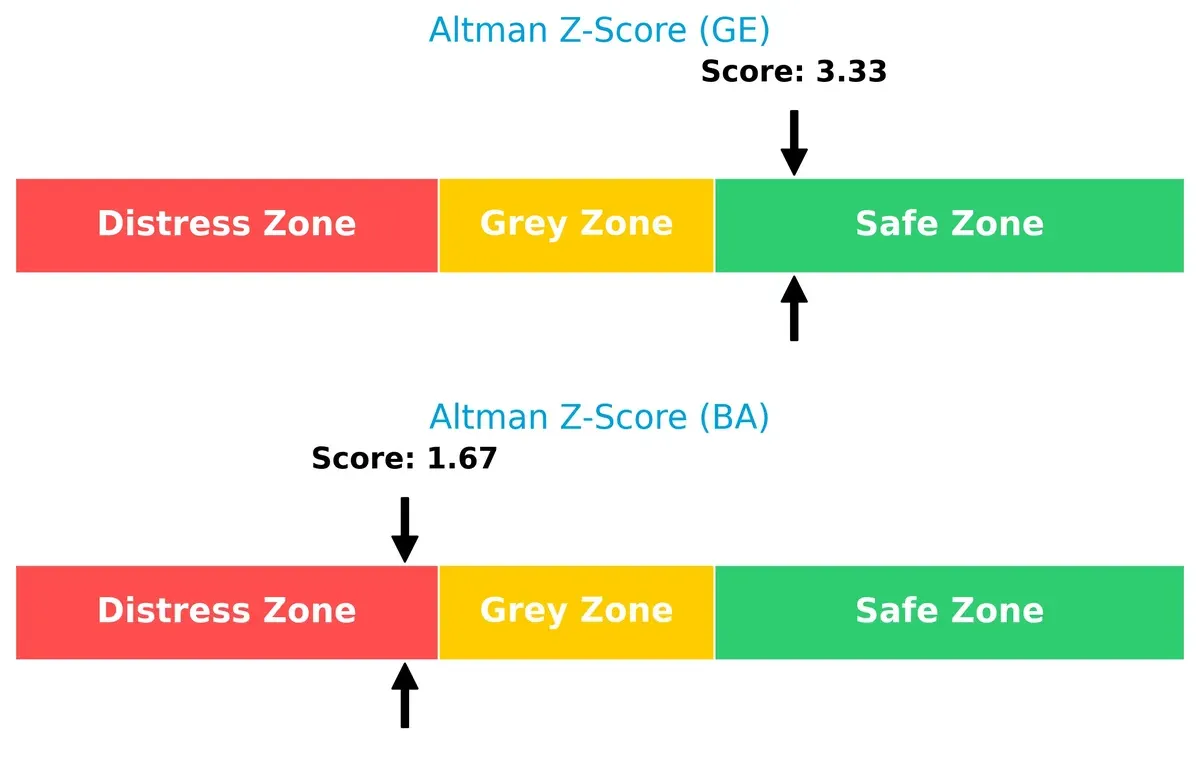
Bankruptcy Risk: Solvency Showdown
GE Aerospace’s Altman Z-Score of 3.33 places it comfortably in the safe zone, signaling strong long-term solvency. Boeing’s 1.67 score positions it in distress territory, raising red flags about its financial stability in this cycle:
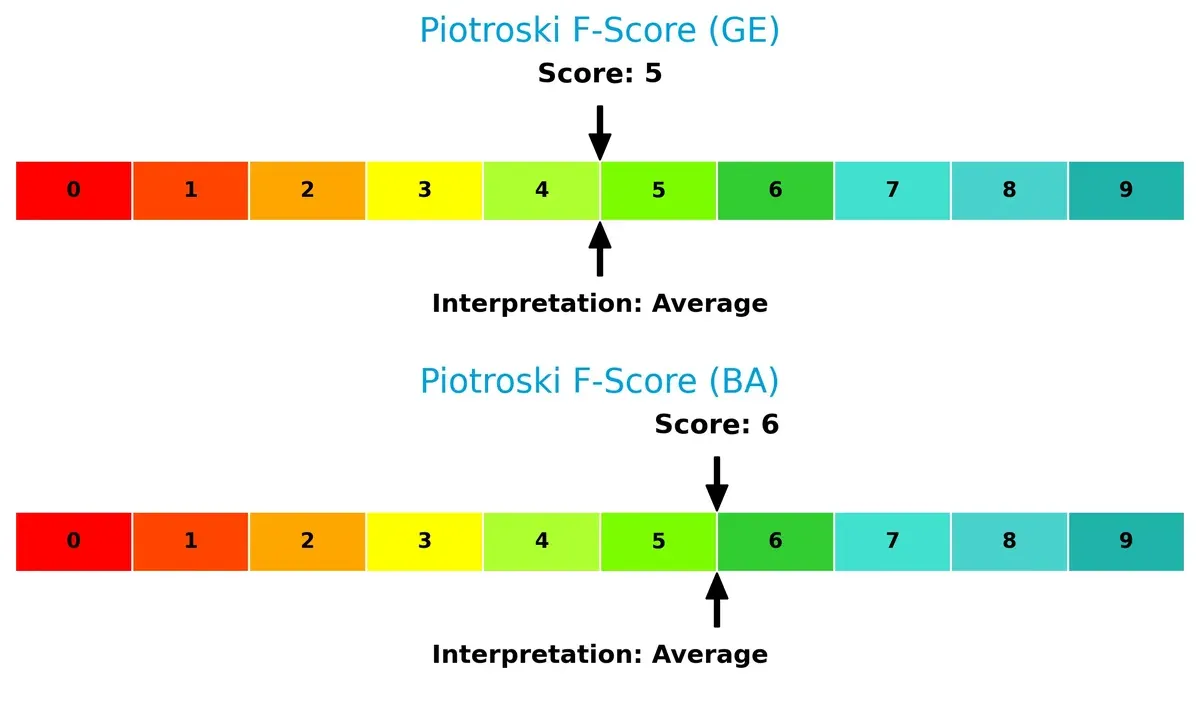
Financial Health: Quality of Operations
Both firms present average Piotroski F-Scores, with Boeing slightly ahead at 6 versus GE’s 5. This suggests neither company is in peak financial health, but Boeing’s marginally better score reflects a modestly stronger internal metric profile:
How are the two companies positioned?
This section dissects GE Aerospace and Boeing’s operational DNA by comparing revenue distribution and internal strengths and weaknesses. The goal is to confront their economic moats and identify which model offers a more resilient, sustainable advantage today.
Revenue Segmentation: The Strategic Mix
This visual comparison dissects how GE Aerospace and The Boeing Company diversify their income streams and where their primary sector bets lie:
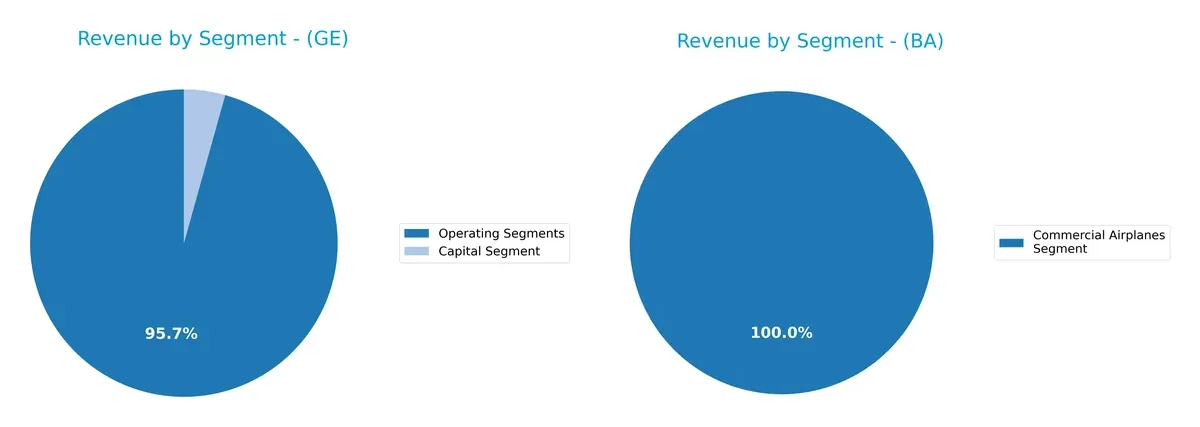
GE Aerospace shows a diverse revenue mix anchored by its Aerospace Segment at $31.7B, Power at $17.7B, and Renewable Energy at $15.1B. Boeing relies heavily on its Commercial Airplanes Segment, which dwarfs others at $41.5B in 2025. Boeing’s more concentrated mix pivots on aerospace manufacturing, increasing concentration risk but benefiting from ecosystem lock-in. GE’s broader base reflects strategic infrastructure dominance, cushioning volatility across sectors.
Strengths and Weaknesses Comparison
This table compares the Strengths and Weaknesses of GE Aerospace and The Boeing Company:
GE Strengths
- Diversified segments including Aerospace, Power, and Renewable Energy
- Favorable net margin at 19%
- High ROE at 46.6%
- Strong interest coverage at 12.86
- Favorable fixed asset turnover
Boeing Strengths
- Strong ROE at 41%
- Diversified operations with Commercial Airplanes, Defense, and Global Services
- Neutral current ratio at 1.27
- Global presence with significant U.S. revenue
- Moderate asset turnover at 0.53
GE Weaknesses
- Unfavorable valuation multiples (PE 37.76, PB 17.6)
- Unfavorable quick ratio at 0.74
- High debt-to-equity at 1.1
- Low asset turnover at 0.35
- Slightly unfavorable overall financial ratios
- Low dividend yield at 0.44%
Boeing Weaknesses
- Unfavorable net margin at 2.5%
- Negative ROIC at -6.71%
- High debt-to-equity at 9.92
- Poor interest coverage at 1.95
- Unfavorable valuation multiples (PE 74, PB 30)
- Low quick ratio at 0.49
- Low dividend yield at 0.2%
GE Aerospace’s strengths lie in profitability and balanced segment diversification. Boeing shows strengths in operational scale but faces deeper financial strain. Both companies exhibit valuation and liquidity concerns that could influence strategic priorities.
The Moat Duel: Analyzing Competitive Defensibility
A structural moat is the only true defense against competitors eroding long-term profits. Here’s how GE Aerospace and Boeing stack up:
GE Aerospace: Intangible Assets and Innovation Edge
GE’s moat stems from its intangible assets and advanced jet engine technology, reflected in stable, favorable margins near 24% EBIT. Its growing profitability in 2026 signals deeper moat potential via innovations in defense propulsion and additive manufacturing.
The Boeing Company: Scale and Integrated Systems
Boeing relies on scale and integration across commercial and defense aerospace. Despite strong revenue growth, its low and declining ROIC versus WACC signals weakening capital efficiency. Boeing faces pressure to restore profitability and sharpen focus on digital and space services for moat expansion.
Innovation Leadership vs. Scale Efficiency
GE Aerospace exhibits a slightly unfavorable moat but with rising ROIC and improving profitability, suggesting a deepening competitive edge. Boeing’s very unfavorable moat and declining returns raise red flags. I see GE better positioned to defend and grow its market share through technological leadership.
Which stock offers better returns?
The past year shows contrasting price dynamics for GE Aerospace and The Boeing Company, with GE’s gains slowing while Boeing accelerates its upward momentum.
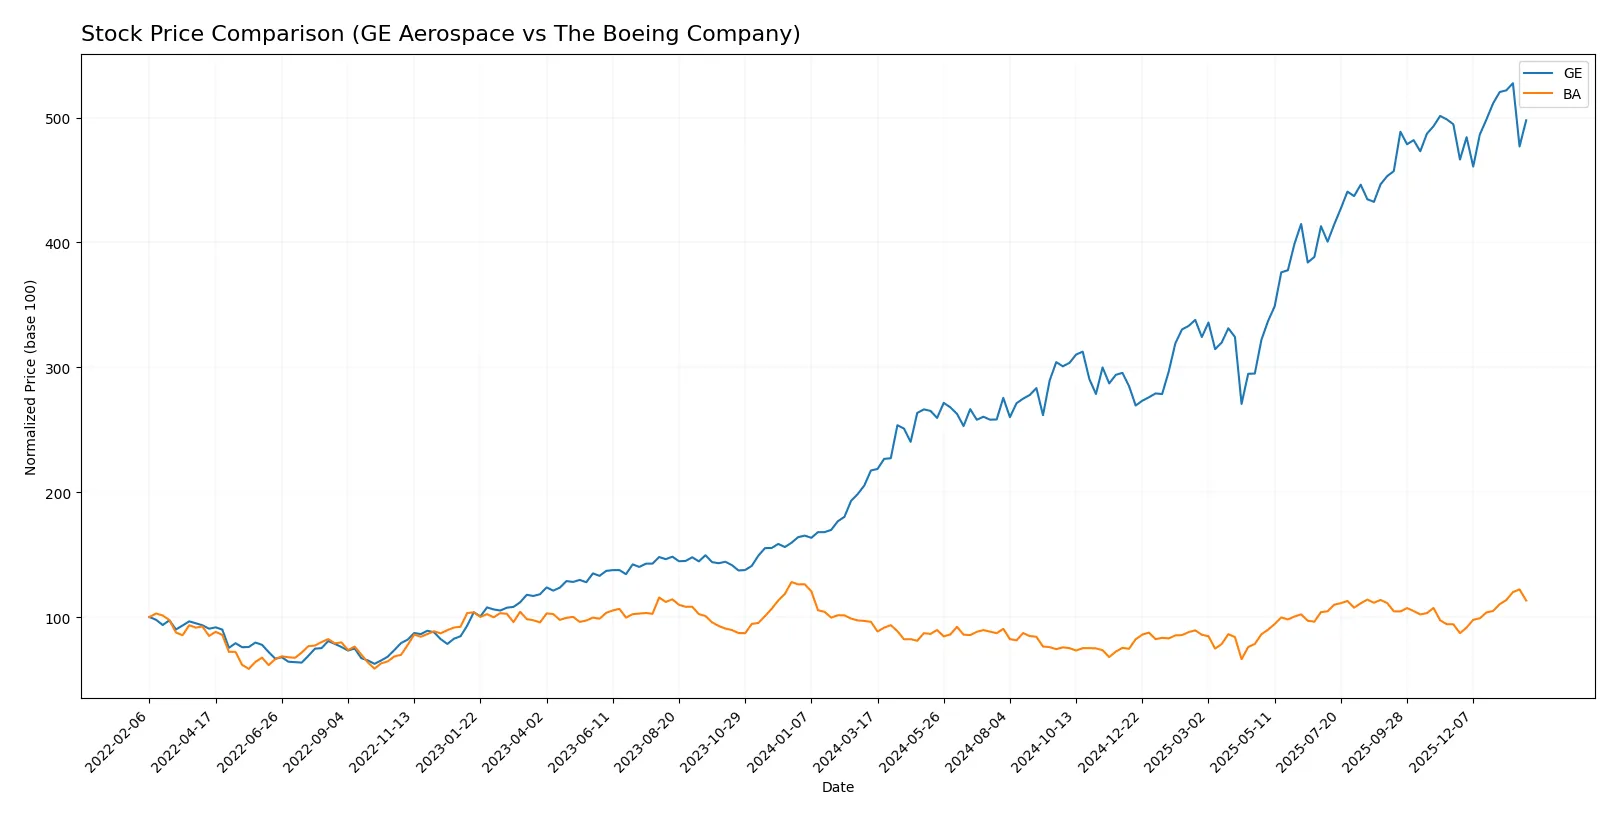
Trend Comparison
GE Aerospace’s stock rose 129.03% over the past year, signaling a strong bullish trend despite decelerating gains. The price ranged between 134 and 325, with high volatility (56.42 std dev).
The Boeing Company’s stock gained 17.75% over the same period, marking a bullish trend with accelerating momentum. Price fluctuated from 137 to 252, showing moderate volatility (26.41 std dev).
GE Aerospace delivered significantly higher returns than Boeing, though Boeing’s trend gained strength recently. GE’s trend decelerated despite larger overall gains.
Target Prices
Analysts show a bullish consensus with strong upside potential for both GE Aerospace and The Boeing Company.
| Company | Target Low | Target High | Consensus |
|---|---|---|---|
| GE Aerospace | 374 | 387 | 380.33 |
| The Boeing Company | 150 | 298 | 256.73 |
The target consensus for GE Aerospace implies a 24% upside from its current price of 306.79. Boeing’s target consensus suggests a 10% upside, reflecting mixed views but overall optimism.

Don’t Let Luck Decide Your Entry Point
Optimize your entry points with our advanced ProRealTime indicators. You’ll get efficient buy signals with precise price targets for maximum performance. Start outperforming now!
How do institutions grade them?
GE Aerospace Grades
Here are the recent grades from major financial institutions for GE Aerospace:
| Grading Company | Action | New Grade | Date |
|---|---|---|---|
| JP Morgan | Maintain | Overweight | 2026-01-26 |
| Citigroup | Maintain | Buy | 2026-01-23 |
| UBS | Maintain | Buy | 2026-01-23 |
| UBS | Maintain | Buy | 2026-01-15 |
| Citigroup | Maintain | Buy | 2026-01-13 |
| JP Morgan | Maintain | Overweight | 2025-10-27 |
| B of A Securities | Maintain | Buy | 2025-10-27 |
| UBS | Maintain | Buy | 2025-10-22 |
| RBC Capital | Maintain | Outperform | 2025-10-22 |
| Barclays | Maintain | Overweight | 2025-07-23 |
The Boeing Company Grades
Here are the recent grades from major financial institutions for The Boeing Company:
| Grading Company | Action | New Grade | Date |
|---|---|---|---|
| Citigroup | Maintain | Buy | 2026-01-28 |
| UBS | Maintain | Buy | 2026-01-28 |
| RBC Capital | Maintain | Outperform | 2026-01-28 |
| JP Morgan | Maintain | Overweight | 2026-01-28 |
| Bernstein | Maintain | Outperform | 2026-01-15 |
| Citigroup | Maintain | Buy | 2026-01-13 |
| JP Morgan | Maintain | Overweight | 2025-12-19 |
| Susquehanna | Maintain | Positive | 2025-11-12 |
| Freedom Capital Markets | Upgrade | Buy | 2025-11-03 |
| JP Morgan | Maintain | Overweight | 2025-10-30 |
Which company has the best grades?
Both companies receive strong grades from top-tier institutions, mostly Buy, Overweight, and Outperform. Boeing displays a slightly broader range of positive ratings, including a recent upgrade, potentially signaling stronger near-term confidence. Investors may interpret this as Boeing having marginally higher momentum in analyst sentiment.
Risks specific to each company
The following categories identify critical pressure points and systemic threats facing GE Aerospace and The Boeing Company in the 2026 market environment:
1. Market & Competition
GE Aerospace
- Strong net margin and ROE indicate competitive efficiency but faces high valuation risks.
The Boeing Company
- Lower net margin and negative ROIC signal operational struggles despite strong brand presence.
2. Capital Structure & Debt
GE Aerospace
- Moderate debt-to-assets (15.74%) and strong interest coverage (12.86) show manageable leverage.
The Boeing Company
- High debt-to-equity (9.92) and weak interest coverage (1.95) raise financial distress concerns.
3. Stock Volatility
GE Aerospace
- Beta of 1.403 suggests higher volatility than the market average, increasing risk.
The Boeing Company
- Beta of 1.163 reflects moderate volatility but less than GE, providing some stability.
4. Regulatory & Legal
GE Aerospace
- Subject to aerospace regulations but has diversified commercial and defense segments reducing regulatory risk.
The Boeing Company
- Faces intense scrutiny over safety and compliance, especially in commercial airplanes segment.
5. Supply Chain & Operations
GE Aerospace
- Asset turnover low (0.35) suggests operational inefficiencies despite favorable fixed asset turnover.
The Boeing Company
- Better asset turnover (0.53) but struggling with supply chain delays impacting deliveries and costs.
6. ESG & Climate Transition
GE Aerospace
- Actively investing in additive manufacturing and propulsion tech to reduce carbon footprint.
The Boeing Company
- Facing pressure to accelerate ESG initiatives amid legacy environmental issues and public scrutiny.
7. Geopolitical Exposure
GE Aerospace
- Global defense contracts provide steady revenue but expose to geopolitical risks.
The Boeing Company
- Heavy reliance on international commercial sales makes it vulnerable to trade tensions and sanctions.
Which company shows a better risk-adjusted profile?
GE Aerospace’s most impactful risk is its high stock valuation and moderate operational efficiency. Boeing’s critical risk lies in its heavy debt burden and fragile financial health. GE’s Altman Z-score in the safe zone contrasts sharply with Boeing’s distress zone. This gap underlines GE’s stronger risk-adjusted profile, supported by better interest coverage and profitability metrics despite higher volatility. Boeing’s financial distress signals and negative ROIC demand caution, especially given ongoing supply chain and regulatory pressures.
Final Verdict: Which stock to choose?
GE Aerospace’s superpower lies in its accelerating profitability and operational efficiency. Its improving ROIC, though still below WACC, signals a turnaround in value creation. A point of vigilance remains the stretched liquidity ratios and elevated valuation multiples. GE fits portfolios aiming for aggressive growth with an appetite for operational recovery stories.
The Boeing Company boasts a strategic moat in aerospace manufacturing scale and a robust backlog, underpinning steady revenue streams. However, its sharply declining ROIC and high leverage introduce notable financial risk, marking it as comparatively less stable than GE. Boeing suits investors favoring GARP—growth tempered by cautious valuation and moderate risk tolerance.
If you prioritize turnaround potential and operational momentum, GE Aerospace is the compelling choice due to its improving profitability and strong income growth. However, if you seek scale-driven aerospace exposure with stable long-term contracts, Boeing offers better stability despite its financial headwinds. Both present distinct analytical scenarios depending on risk appetite and investment horizon.
Disclaimer: Investment carries a risk of loss of initial capital. The past performance is not a reliable indicator of future results. Be sure to understand risks before making an investment decision.
Go Further
I encourage you to read the complete analyses of GE Aerospace and The Boeing Company to enhance your investment decisions: