Home > Comparison > Industrials > GE vs TXT
The strategic rivalry between GE Aerospace and Textron Inc. shapes the current trajectory of the aerospace and defense sector. GE Aerospace operates as a capital-intensive industrial giant, focusing on jet engines and integrated systems. Textron Inc. blends aerospace manufacturing with diversified industrial and finance services, targeting high-margin niches. This analysis dissects their competing models to identify which company offers a superior risk-adjusted return for a diversified portfolio in 2026.
Table of contents
Companies Overview
GE Aerospace and Textron Inc. stand as key pillars in the aerospace and defense sector, shaping industry dynamics with distinct approaches.
GE Aerospace: Powering Flight with Engine Innovation
GE Aerospace dominates as a premier jet engine manufacturer serving commercial, military, and business aviation. Its revenue stems from designing, building, and servicing high-performance engines and integrated aircraft systems. In 2026, GE sharpened its focus on propulsion technologies and additive manufacturing, leveraging its portfolio brands like Avio Aero and Dowty Propellers to sustain its competitive edge.
Textron Inc.: Diverse Aerospace and Industrial Solutions
Textron Inc. operates broadly across aerospace, defense, and industrial markets, generating revenue through manufacturing business jets, military trainers, helicopters, and specialty vehicles. The 2026 strategy emphasizes expanding its Textron Systems segment with advanced unmanned aircraft and electronic systems while maintaining strong aftermarket services for aviation and defense customers worldwide.
Strategic Collision: Similarities & Divergences
Both companies compete fiercely in aerospace propulsion and defense but diverge in business models: GE pursues a focused engine and propulsion ecosystem, while Textron adopts a diversified product and service portfolio. Their battleground centers on innovation and aftermarket services. GE offers a specialized investment profile with scale and technological moat, whereas Textron presents a broader, multi-segment exposure with diversified risk and growth avenues.
Income Statement Comparison
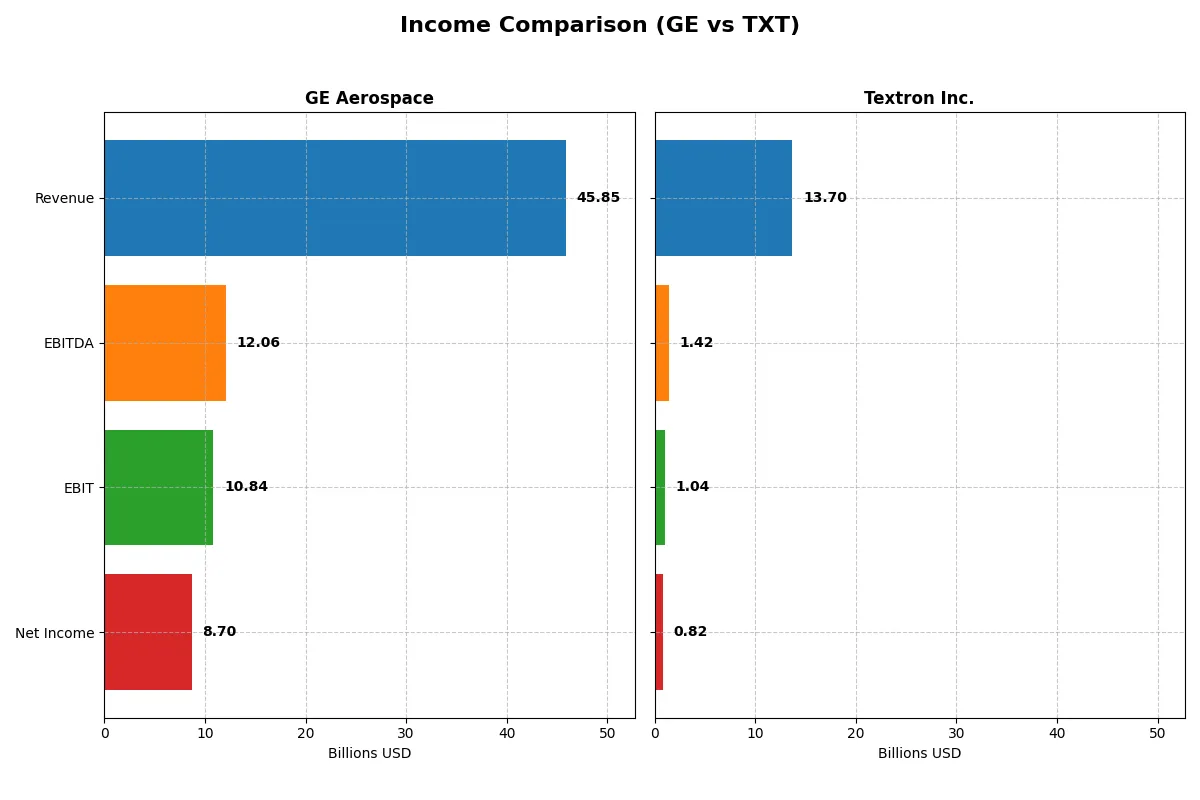
This data dissects the core profitability and scalability of both corporate engines to reveal who dominates the bottom line:
| Metric | GE Aerospace (GE) | Textron Inc. (TXT) |
|---|---|---|
| Revenue | 45.9B | 13.7B |
| Cost of Revenue | 28.97B | 11.2B |
| Operating Expenses | 8.12B | 1.65B |
| Gross Profit | 16.89B | 2.50B |
| EBITDA | 12.06B | 1.42B |
| EBIT | 10.84B | 1.04B |
| Interest Expense | 843M | 97M |
| Net Income | 8.70B | 824M |
| EPS | 8.16 | 5.11 |
| Fiscal Year | 2025 | 2025 |
Income Statement Analysis: The Bottom-Line Duel
This income statement comparison reveals the true operational efficiency and profitability momentum of two aerospace and industrial giants.
GE Aerospace Analysis
GE Aerospace’s revenue rose sharply to $45.9B in 2025, up 18.5% from 2024. Net income surged to $8.7B, reflecting strong margin expansion with a gross margin of 36.8% and net margin near 19%. The company demonstrates robust profitability and effective cost management, with EBIT growth accelerating 26% year-over-year.
Textron Inc. Analysis
Textron’s revenue stagnated at $13.7B in 2025, showing no growth from 2024. Net income held steady at $824M, yielding a modest 6% net margin. Margins remain thin, with an 18.3% gross margin and 7.6% EBIT margin, indicating tighter cost control but limited profitability gains. Earnings per share improved 18%, signaling some momentum despite flat top-line.
Earnings Muscle vs. Revenue Stability
GE Aerospace outpaces Textron decisively with higher revenue growth, superior margins, and stronger net income gains. Textron’s stable revenue but thin profitability contrasts sharply with GE’s dynamic margin expansion and earnings power. For investors seeking pronounced profitability and growth, GE’s profile commands greater fundamental appeal.
Financial Ratios Comparison
These vital ratios act as a diagnostic tool to expose the underlying fiscal health, valuation premiums, and capital efficiency of the companies compared below:
| Ratios | GE Aerospace (GE) | Textron Inc. (TXT) |
|---|---|---|
| ROE | 46.6% | 10.5% |
| ROIC | 8.1% | 6.9% |
| P/E | 37.8 | 19.0 |
| P/B | 17.6 | 2.0 |
| Current Ratio | 1.04 | 5.94 |
| Quick Ratio | 0.74 | 2.33 |
| D/E | 1.10 | 0.45 |
| Debt-to-Assets | 15.7% | 19.5% |
| Interest Coverage | 10.4 | 8.8 |
| Asset Turnover | 0.35 | 0.76 |
| Fixed Asset Turnover | 5.74 | 5.29 |
| Payout Ratio | 16.7% | 2.3% |
| Dividend Yield | 0.44% | 0.12% |
| Fiscal Year | 2025 | 2025 |
Efficiency & Valuation Duel: The Vital Signs
Financial ratios serve as a company’s DNA, exposing hidden risks and operational strengths that drive investor confidence.
GE Aerospace
GE Aerospace demonstrates robust profitability with a 46.6% ROE and a strong 18.98% net margin. However, its valuation appears stretched, marked by a high 37.76 P/E and 17.6 P/B ratios. Shareholder returns remain modest with a low 0.44% dividend yield, reflecting reinvestment in R&D and growth initiatives rather than generous payouts.
Textron Inc.
Textron presents moderate profitability with a 10.46% ROE and a neutral 6.01% net margin. Its valuation metrics are more reasonable, featuring a 19.04 P/E and 1.99 P/B, suggesting better price discipline. Despite a low 0.12% dividend yield, Textron maintains solid capital allocation, balancing reinvestment and manageable leverage with a favorable debt-to-equity ratio of 0.45.
Premium Valuation vs. Operational Safety
GE Aerospace offers superior profitability but at a stretched valuation and weaker liquidity metrics. Textron balances moderate returns with more conservative financial health and valuation. Investors seeking growth at a premium may favor GE, while those preferring operational prudence and lower valuation risk may find Textron’s profile more suitable.
Which one offers the Superior Shareholder Reward?
I see GE Aerospace delivers a modest 0.44% dividend yield with a sustainable 16.7% payout ratio, backed by strong free cash flow (FCF) coverage at 3.13x. Its buyback activity remains steady, supporting shareholder value. Textron Inc. pays a minimal 0.12% yield with a tiny 2.3% payout ratio, emphasizing capital reinvestment. Txt’s robust buybacks and high operating cash flow ratio (1.07) signal aggressive capital return alongside growth funding. Given GE’s balanced combination of dividends, buybacks, and sustainable payout, I favor GE Aerospace for superior total shareholder reward in 2026.
Comparative Score Analysis: The Strategic Profile
The radar chart reveals the fundamental DNA and trade-offs of both GE Aerospace and Textron Inc., highlighting their financial strengths and vulnerabilities:
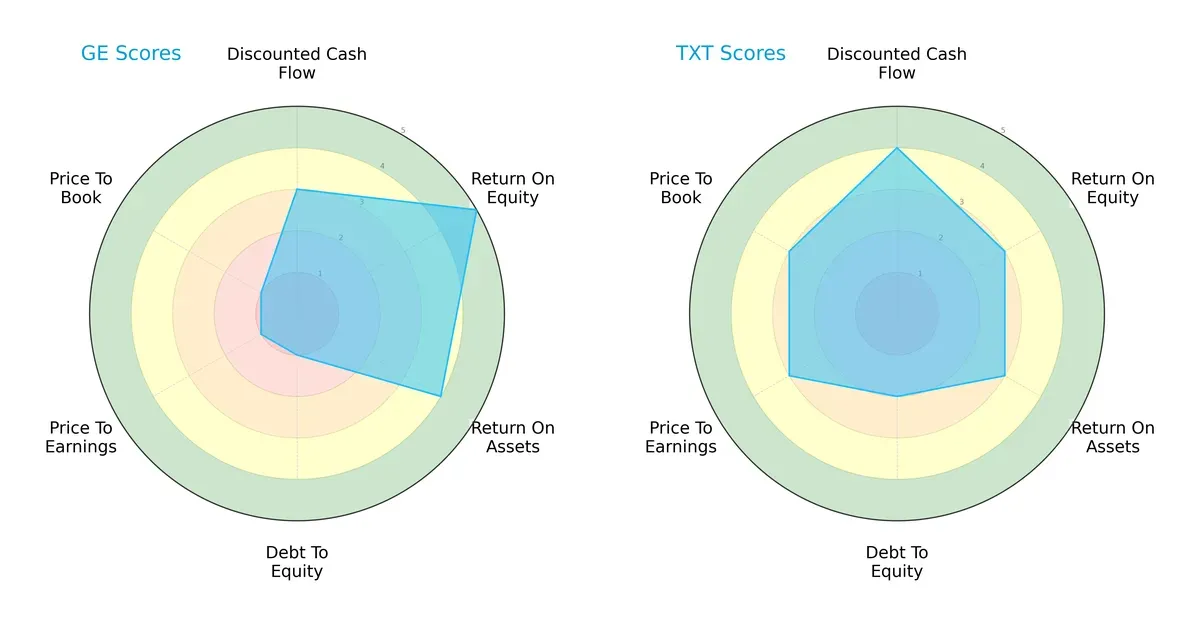
GE Aerospace excels in profitability with very favorable ROE (5) and favorable ROA (4) scores but suffers from weak valuation and balance sheet metrics, scoring very unfavorable (1) in debt-to-equity, P/E, and P/B ratios. Textron Inc. presents a more balanced profile with moderate to favorable scores across DCF (4), debt-to-equity (2), and valuation metrics (3), although its profitability metrics lag behind GE. I see GE relying heavily on operational efficiency, while Textron offers steadier financial stability and valuation appeal.
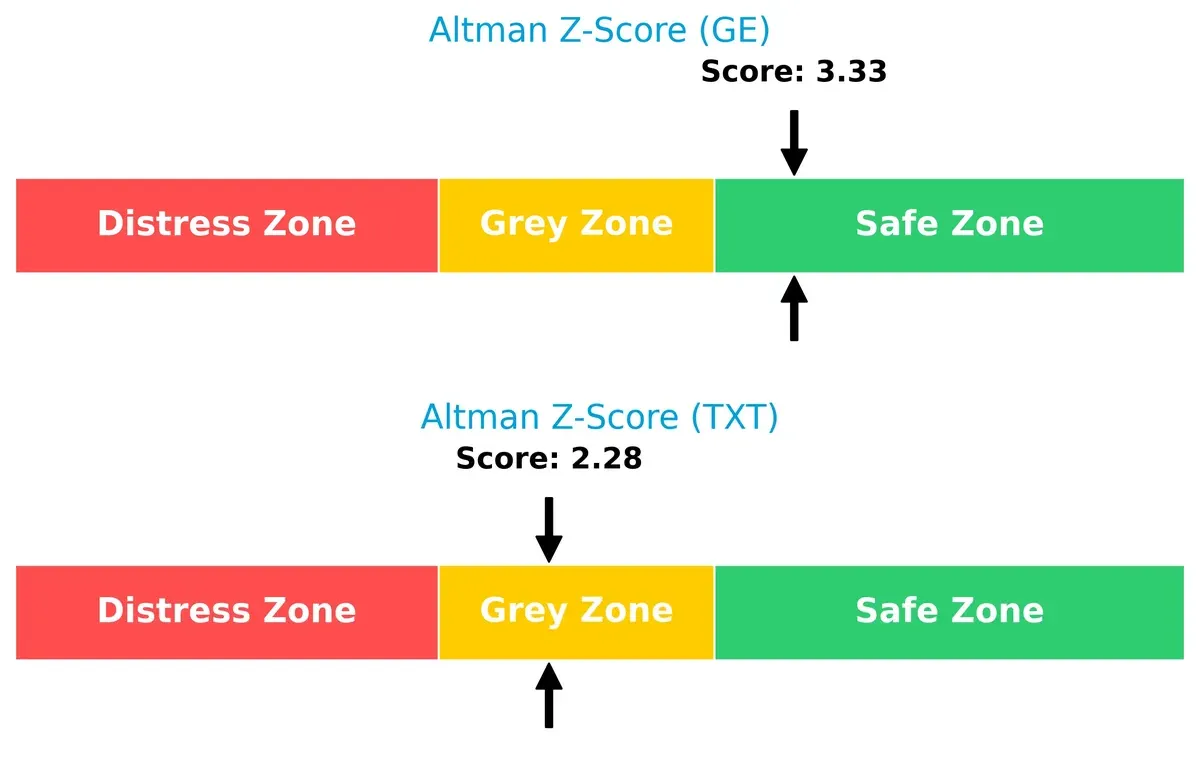
Bankruptcy Risk: Solvency Showdown
GE Aerospace’s Altman Z-Score of 3.33 places it safely in the low bankruptcy risk zone, whereas Textron Inc.’s 2.28 score lands in the grey zone, indicating moderate risk. This suggests GE is better positioned for long-term survival in this cycle:
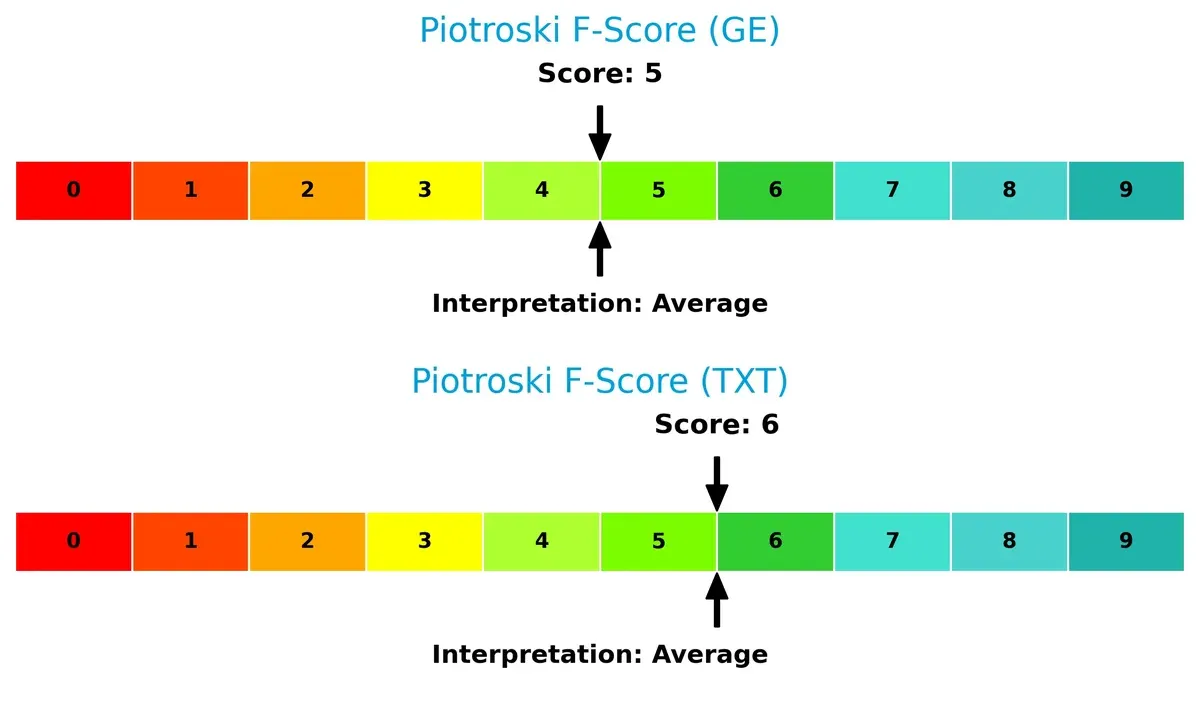
Financial Health: Quality of Operations
Both companies exhibit average financial health, with Piotroski scores of 5 for GE Aerospace and 6 for Textron Inc. While neither signals peak financial strength, Textron’s slightly higher score hints at marginally better internal metrics and operational quality:
How are the two companies positioned?
This section dissects the operational DNA of GE Aerospace and Textron Inc. by comparing their revenue distribution and internal dynamics. The goal is to confront their economic moats and reveal which model offers the most resilient competitive advantage today.
Revenue Segmentation: The Strategic Mix
The following visual comparison dissects how GE Aerospace and Textron Inc. diversify their income streams and where their primary sector bets lie:
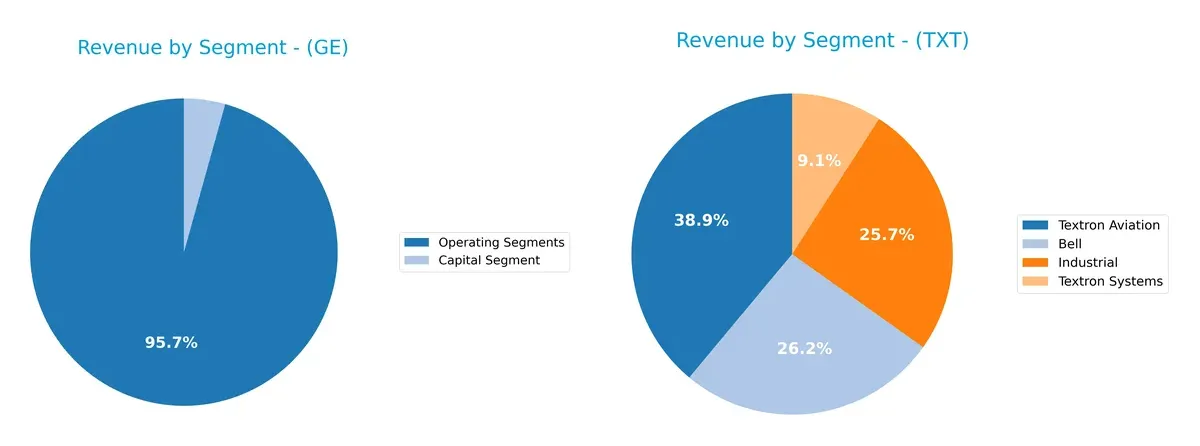
GE Aerospace’s revenue dwarfs Textron’s, anchored by its Aerospace Segment at $31.8B in 2023. GE’s mix spans Power ($17.7B) and Renewable Energy ($15B), showing a broad industrial footprint. Textron relies more evenly on four segments, with Textron Aviation leading at $5.3B and Bell close behind at $3.6B in 2024. GE’s concentration in aerospace signals ecosystem dominance, while Textron’s balanced split reduces single-segment risk.
Strengths and Weaknesses Comparison
This table compares the strengths and weaknesses of GE Aerospace and Textron Inc. based on diversification, profitability, financials, innovation, global presence, and market share:
GE Aerospace Strengths
- High net margin of 18.98%
- Strong ROE at 46.6%
- Favorable interest coverage at 12.86
- Diverse revenue streams across aerospace, power, and renewable energy segments
- Significant global presence with strong US and Asia revenues
- High fixed asset turnover at 5.74
Textron Inc. Strengths
- Favorable WACC at 7.56% supports capital efficiency
- Strong quick ratio of 2.33 and low debt-to-equity of 0.45
- Balanced portfolio including Bell, Industrial, Aviation, and Systems
- Stable US market share with growing international sales
- Favorable fixed asset turnover at 5.29
- Moderate PE and PB ratios suggest reasonable valuation
GE Aerospace Weaknesses
- PE of 37.76 and PB of 17.6 indicate high valuation risk
- Quick ratio of 0.74 suggests liquidity concerns
- Debt-to-equity ratio of 1.1 is relatively high
- Asset turnover at 0.35 is low, signaling less efficient asset use
- Slightly unfavorable global ratio opinion due to mixed metrics
- Low dividend yield at 0.44%
Textron Inc. Weaknesses
- Current ratio of 5.94 is unusually high, possibly inefficient working capital use
- Net margin at 6.01% is modest, indicating limited profitability
- ROE of 10.46% is neutral, reflecting average returns
- Dividend yield low at 0.12%
- Neutral global ratios suggest no clear financial advantage
GE Aerospace shows strength in profitability and diversified global operations but faces valuation and liquidity risks. Textron maintains financial prudence with solid capital structure and asset turnover but must address modest profitability and working capital efficiency.
The Moat Duel: Analyzing Competitive Defensibility
A structural moat is the only shield protecting long-term profits from relentless competition erosion. Let’s dissect two aerospace giants’ moats:
GE Aerospace: Intangible Assets Powerhouse
GE Aerospace’s moat hinges on its intangible assets—proprietary jet engine technology and integrated defense systems. This manifests as strong margin stability with a 23.65% EBIT margin in 2025. Its expanding global footprint and innovation in propulsion could deepen this moat, despite current ROIC trailing WACC.
Textron Inc.: Diversified Product Portfolio Moat
Textron’s moat rests on its diversified aerospace and defense products, spanning helicopters to unmanned systems. Unlike GE’s tech focus, Textron leverages operational flexibility with a 7.59% EBIT margin. Its steady ROIC growth signals improving capital efficiency, while expanding UAV and industrial segments offer future growth avenues.
Innovation Edge vs. Diversification Strength
GE’s intangible asset moat is deeper, driven by technological leadership and margin dominance, despite value destruction signs. Textron’s moat is wider in product scope but weaker financially. GE is better positioned to defend market share through innovation and scale.
Which stock offers better returns?
The past year reveals contrasting dynamics: GE Aerospace soared over 129%, while Textron Inc. declined nearly 4.5%, reflecting divergent investor sentiment and market performance.
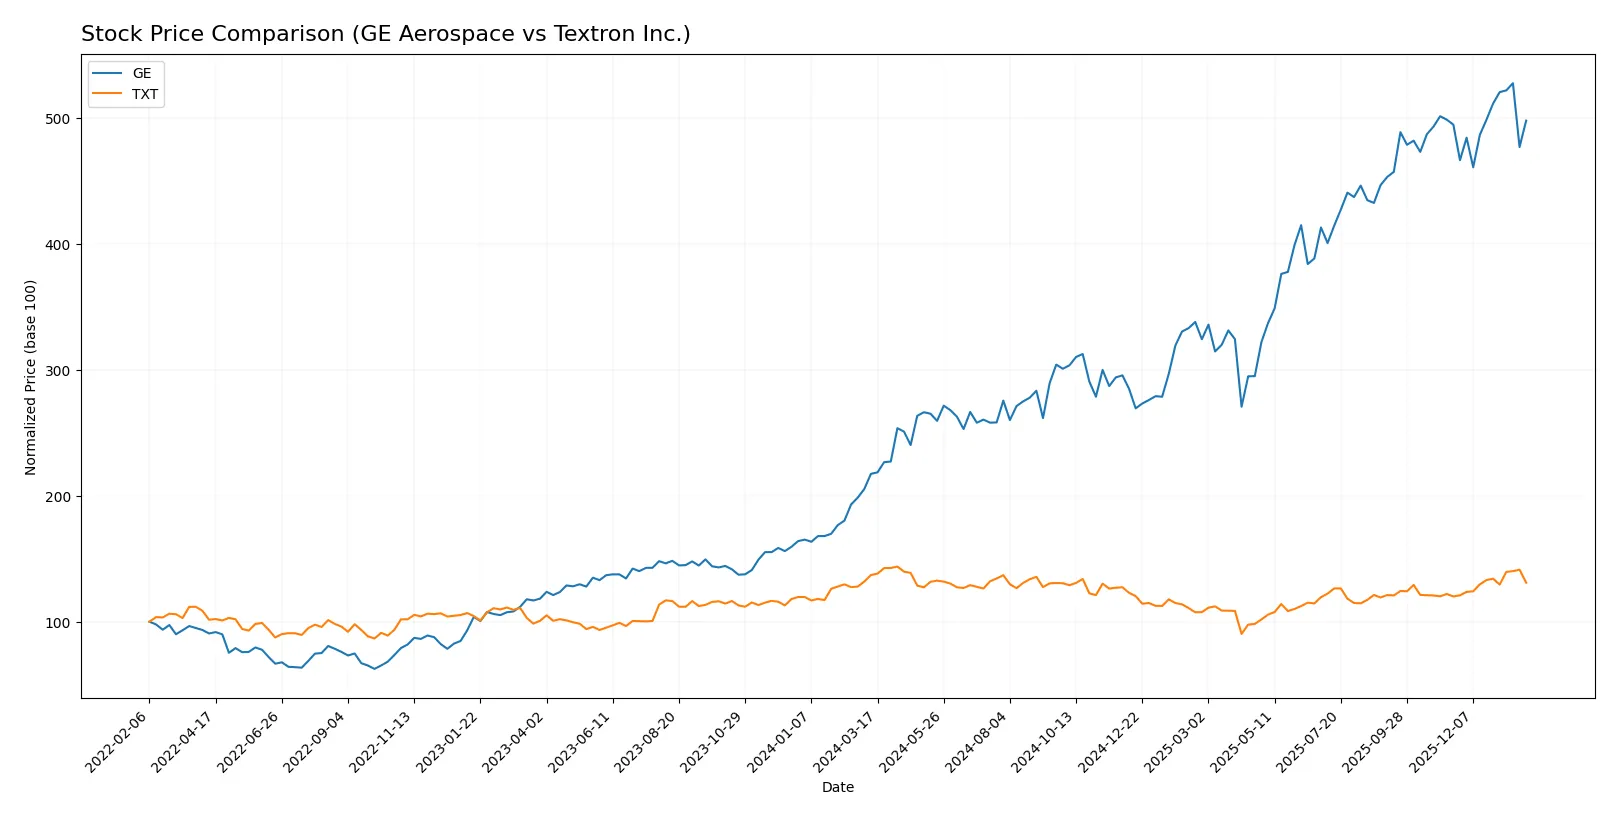
Trend Comparison
GE Aerospace’s stock gained 129.03% over the past year, marking a strong bullish trend despite decelerating momentum and elevated volatility (56.42 std deviation). It peaked at 325.12 and bottomed at 133.95.
Textron Inc. posted a 4.42% decline over the same period, signaling a bearish trend with accelerating downward momentum. Its price fluctuated between 60.72 and 96.65, exhibiting lower volatility (7.24 std deviation).
Comparing both, GE Aerospace delivered the highest market performance with a decisive bullish trend, while Textron’s stock faced a bearish trajectory despite recent short-term gains.
Target Prices
Analysts present a bullish consensus for both GE Aerospace and Textron Inc.
| Company | Target Low | Target High | Consensus |
|---|---|---|---|
| GE Aerospace | 374 | 387 | 380.33 |
| Textron Inc. | 92 | 110 | 101 |
The target consensus for GE Aerospace stands roughly 24% above its current 307 price, signaling strong upside potential. Textron’s consensus target is about 15% higher than its current 88, reflecting moderate but positive market expectations.

Don’t Let Luck Decide Your Entry Point
Optimize your entry points with our advanced ProRealTime indicators. You’ll get efficient buy signals with precise price targets for maximum performance. Start outperforming now!
How do institutions grade them?
GE Aerospace Grades
The following table summarizes recent institutional grades for GE Aerospace:
| Grading Company | Action | New Grade | Date |
|---|---|---|---|
| JP Morgan | maintain | Overweight | 2026-01-26 |
| Citigroup | maintain | Buy | 2026-01-23 |
| UBS | maintain | Buy | 2026-01-23 |
| UBS | maintain | Buy | 2026-01-15 |
| Citigroup | maintain | Buy | 2026-01-13 |
| JP Morgan | maintain | Overweight | 2025-10-27 |
| B of A Securities | maintain | Buy | 2025-10-27 |
| UBS | maintain | Buy | 2025-10-22 |
| RBC Capital | maintain | Outperform | 2025-10-22 |
| Barclays | maintain | Overweight | 2025-07-23 |
Textron Inc. Grades
The following table summarizes recent institutional grades for Textron Inc.:
| Grading Company | Action | New Grade | Date |
|---|---|---|---|
| Citigroup | maintain | Neutral | 2026-01-29 |
| JP Morgan | maintain | Neutral | 2026-01-29 |
| UBS | maintain | Neutral | 2026-01-15 |
| Citigroup | maintain | Neutral | 2026-01-13 |
| JP Morgan | maintain | Neutral | 2025-10-27 |
| UBS | maintain | Neutral | 2025-10-24 |
| TD Cowen | maintain | Hold | 2025-10-24 |
| Barclays | maintain | Overweight | 2025-07-29 |
| UBS | upgrade | Neutral | 2025-07-28 |
| Susquehanna | maintain | Positive | 2025-07-25 |
Which company has the best grades?
GE Aerospace consistently earns Buy and Overweight ratings from top-tier firms, signaling strong institutional confidence. Textron Inc. mostly receives Neutral or Hold grades, suggesting more cautious sentiment. Investors may view GE’s higher grades as a sign of better near-term prospects.
Risks specific to each company
The following categories identify the critical pressure points and systemic threats facing both firms in the 2026 market environment:
1. Market & Competition
GE Aerospace
- Dominates commercial and military jet engines but faces intense competition and high valuation multiples.
Textron Inc.
- Diversified aerospace and industrial segments with moderate margins; competes in niche aviation and defense markets.
2. Capital Structure & Debt
GE Aerospace
- High debt-to-equity ratio (1.1) signals financial leverage risk despite strong interest coverage.
Textron Inc.
- Lower leverage (0.45 debt-to-equity) reflects more prudent capital structure and financial flexibility.
3. Stock Volatility
GE Aerospace
- Beta of 1.40 suggests higher price volatility relative to the market.
Textron Inc.
- Beta near 1.00 indicates stock moves closely with overall market, implying moderate risk.
4. Regulatory & Legal
GE Aerospace
- Subject to stringent aerospace safety and export regulations globally.
Textron Inc.
- Faces complex defense contracting rules and environmental compliance across diverse operations.
5. Supply Chain & Operations
GE Aerospace
- Relies on advanced manufacturing and global supply chains vulnerable to disruptions.
Textron Inc.
- Operational complexity across aviation, defense, and industrial segments poses integration risks.
6. ESG & Climate Transition
GE Aerospace
- Under pressure to innovate cleaner engine technologies amid tightening emissions standards.
Textron Inc.
- Faces challenges in reducing environmental footprint in varied product lines including vehicles and aircraft.
7. Geopolitical Exposure
GE Aerospace
- Global sales expose it to geopolitical tensions affecting commercial and defense contracts.
Textron Inc.
- International defense and aviation sales subject to export controls and geopolitical risk.
Which company shows a better risk-adjusted profile?
Textron’s lower financial leverage and moderate stock volatility present a more balanced risk profile. GE’s high debt and valuation multiples elevate financial risk despite operational scale. GE’s Altman Z-score places it safely above distress, but its debt-to-equity and valuation scores are red flags. Textron’s Altman Z-score in the grey zone warns of moderate financial risk, yet its more conservative capital structure and favorable ratios suggest greater resilience. The critical risk for GE is its stretched capital structure amid high valuation. For Textron, operational complexity and geopolitical exposure remain key concerns, but its capital discipline offers a buffer. Recent 2025 data underscores Textron’s stronger balance sheet and more favorable cost of capital, justifying caution on GE’s leverage and valuation risks.
Final Verdict: Which stock to choose?
GE Aerospace’s superpower lies in its robust income growth and impressive return on equity, reflecting operational excellence and strong market positioning. However, its stretched valuation and moderate liquidity ratios warrant caution. It suits investors with an appetite for aggressive growth amid cyclical aerospace sector dynamics.
Textron Inc. benefits from a solid strategic moat grounded in diversified industrial operations and prudent capital structure. Its lower valuation multiples and healthier liquidity profile offer relative safety versus GE. This company fits well within a GARP (Growth at a Reasonable Price) portfolio seeking steady, measured growth.
If you prioritize high growth and can tolerate valuation premium and liquidity risks, GE Aerospace outshines with superior profitability momentum. However, if you seek better financial stability and a more balanced risk-reward, Textron provides a more conservative option with consistent fundamentals. Both present viable analytical scenarios depending on your investment strategy.
Disclaimer: Investment carries a risk of loss of initial capital. The past performance is not a reliable indicator of future results. Be sure to understand risks before making an investment decision.
Go Further
I encourage you to read the complete analyses of GE Aerospace and Textron Inc. to enhance your investment decisions: