Home > Comparison > Industrials > GE vs RTX
The strategic rivalry between GE Aerospace and RTX Corporation shapes the Aerospace & Defense sector’s future. GE Aerospace operates as a capital-intensive industrial leader focused on jet engines and propulsion systems. RTX Corporation, by contrast, blends aerospace manufacturing with advanced defense technologies and comprehensive service solutions. This analysis pits GE’s specialized engine expertise against RTX’s diversified portfolio to determine which offers superior risk-adjusted returns for a balanced, industrials-focused portfolio in 2026.
Table of contents
Companies Overview
GE Aerospace and RTX Corporation stand as pivotal players in the aerospace and defense sector, shaping industry innovation and competition.
GE Aerospace: Engine Powerhouse and System Innovator
GE Aerospace dominates as a leading aircraft engine manufacturer, generating revenue primarily through jet and turboprop engines for commercial and military aviation. The company’s core strength lies in its dual-segment model: Commercial Engines & Services and Defense & Propulsion Technologies. In 2026, its strategic focus centers on advancing integrated propulsion systems and expanding aftermarket services to sustain long-term growth.
RTX Corporation: Integrated Aerospace & Defense Giant
RTX Corporation operates as a diversified aerospace and defense company, earning revenue via three main segments: Collins Aerospace, Pratt & Whitney, and Raytheon. Its competitive advantage resides in delivering comprehensive aerospace systems, from engines to defense technologies. The firm’s 2026 strategy emphasizes innovation in aerospace systems and enhancing defense capabilities to capture broader market demand across civil and military sectors.
Strategic Collision: Similarities & Divergences
Both companies compete fiercely in aerospace propulsion and defense technologies, yet their business models diverge. GE Aerospace concentrates on engine manufacturing and propulsion systems, focusing on a specialized product line. RTX pursues a broader, integrated approach combining aerospace systems with defense solutions. This creates distinct investment profiles: GE offers focused engine expertise, while RTX provides diversified aerospace and defense exposure.
Income Statement Comparison
This table dissects the core profitability and scalability of both corporate engines to reveal who dominates the bottom line:
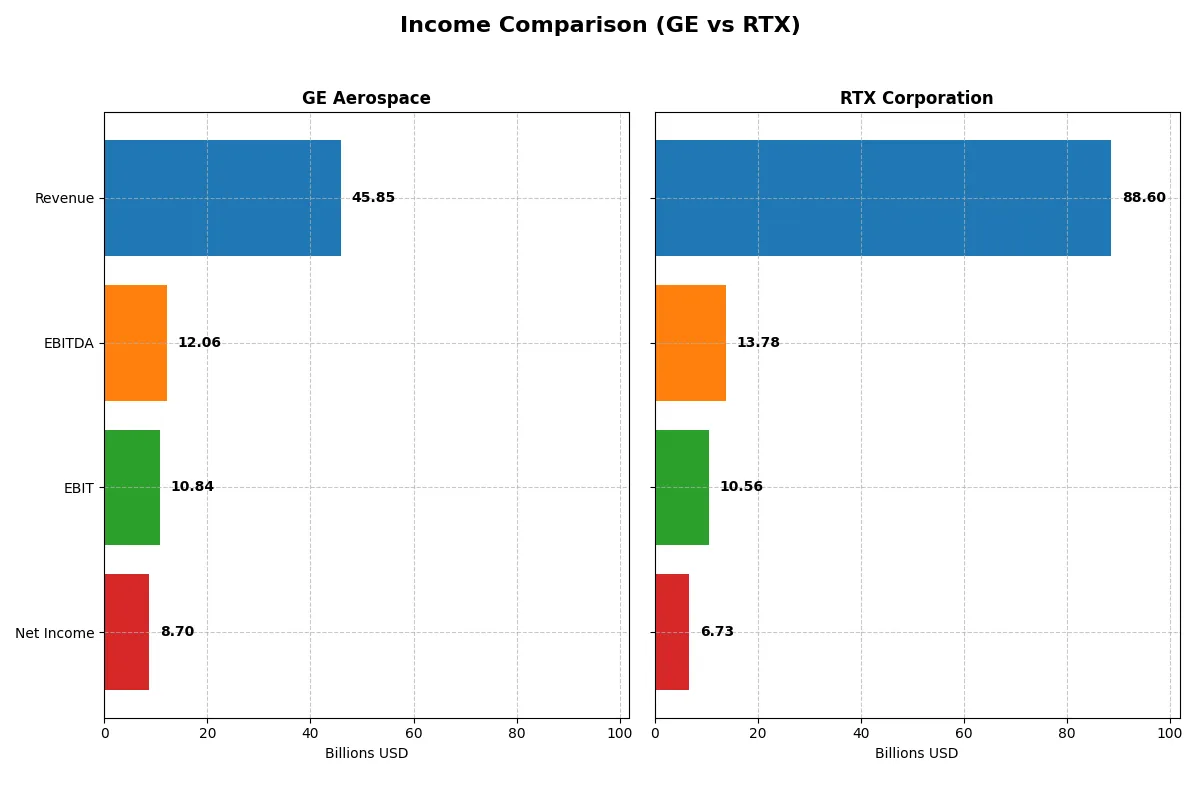
| Metric | GE Aerospace (GE) | RTX Corporation (RTX) |
|---|---|---|
| Revenue | 45.9B | 88.6B |
| Cost of Revenue | 28.97B | 70.81B |
| Operating Expenses | 8.12B | 8.90B |
| Gross Profit | 16.89B | 17.79B |
| EBITDA | 12.06B | 13.78B |
| EBIT | 10.84B | 10.56B |
| Interest Expense | 0.84B | 1.83B |
| Net Income | 8.70B | 6.73B |
| EPS | 8.16 | 5.03 |
| Fiscal Year | 2025 | 2025 |
Income Statement Analysis: The Bottom-Line Duel
This income statement comparison reveals which company operates with the greatest efficiency and momentum in converting sales into profits.
GE Aerospace Analysis
GE Aerospace’s revenue rose sharply by 18.5% in 2025, reaching $45.9B, while net income surged 32.7% to $8.7B. Its gross margin stands at a strong 36.8%, and net margin at 19%, both favorable. The company’s EBIT margin expanded impressively to 23.7%, signaling enhanced operational efficiency and robust profitability momentum.
RTX Corporation Analysis
RTX Corporation grew revenue steadily by 9.7% to $88.6B in 2025, with net income climbing 41% to $6.7B. Despite a lower gross margin of 20.1% and net margin of 7.6% compared to GE, RTX’s EBIT margin at nearly 12% improved markedly. This reflects resilient cost control and solid earnings growth in a competitive landscape.
Margin Strength vs. Revenue Scale
GE Aerospace outperforms with superior margins and faster net income growth, reflecting operational excellence and efficient capital use. RTX boasts higher revenue scale and consistent top-line growth but lags on profitability margins. For investors prioritizing profit quality and margin strength, GE’s profile appears more compelling.
Financial Ratios Comparison
These vital ratios act as a diagnostic tool to expose the underlying fiscal health, valuation premiums, and capital efficiency of the companies compared below:
| Ratios | GE Aerospace (GE) | RTX Corporation (RTX) |
|---|---|---|
| ROE | 46.60% | 7.94% |
| ROIC | 8.12% | 4.74% |
| P/E | 37.76 | 36.64 |
| P/B | 17.60 | — |
| Current Ratio | 1.04 | — |
| Quick Ratio | 0.74 | — |
| D/E (Debt/Equity) | 1.10 | — |
| Debt-to-Assets | 15.74% | — |
| Interest Coverage | 10.40 | 4.86 |
| Asset Turnover | 0.35 | — |
| Fixed Asset Turnover | 5.74 | — |
| Payout Ratio | 16.68% | 53.09% |
| Dividend Yield | 0.44% | 1.45% |
| Fiscal Year | 2025 | 2025 |
Efficiency & Valuation Duel: The Vital Signs
Financial ratios serve as the company’s DNA, uncovering hidden risks and operational strengths that raw numbers alone cannot reveal.
GE Aerospace
GE Aerospace exhibits robust profitability with a 46.6% ROE and strong net margins near 19%, signaling operational excellence. However, its P/E of 37.8 and P/B of 17.6 mark the stock as expensive. It returns modest dividends at 0.44%, indicating limited cash returns to shareholders amid reinvestment in growth and R&D.
RTX Corporation
RTX shows a neutral net margin of 7.6% but lacks reported ROE and ROIC, clouding profitability assessment. Its P/E ratio of 36.6 suggests a stretched valuation, though a favorable WACC at 5.56% supports capital efficiency. Dividend yield at 1.45% offers moderate income, balancing limited visible profitability metrics.
Premium Valuation vs. Operational Clarity
Both companies face slightly unfavorable ratio profiles, with GE delivering superior profitability but at a higher valuation and lower dividend yield. RTX’s valuation is similarly stretched but lacks clear profitability metrics. Investors seeking operational strength may lean toward GE, while those favoring yield might consider RTX’s profile.
Which one offers the Superior Shareholder Reward?
I compare GE Aerospace and RTX Corporation’s distribution strategies. GE yields a modest 0.44% with a low payout ratio near 17%, supported by strong free cash flow coverage above 85%. GE’s buybacks are moderate, enhancing total returns but preserving capital for growth. RTX delivers a higher dividend yield of 1.45% but pays out over 53% of earnings, raising sustainability concerns given its thinner free cash flow coverage at 75%. RTX’s buyback program appears robust, yet the heavier dividend reliance may pressure cash flow during downturns. I find GE Aerospace’s balanced dividend and share repurchase model more sustainable, offering superior long-term shareholder reward in 2026.
Comparative Score Analysis: The Strategic Profile
The radar chart reveals the fundamental DNA and trade-offs of GE Aerospace and RTX Corporation, highlighting their competitive strengths and valuation dynamics:
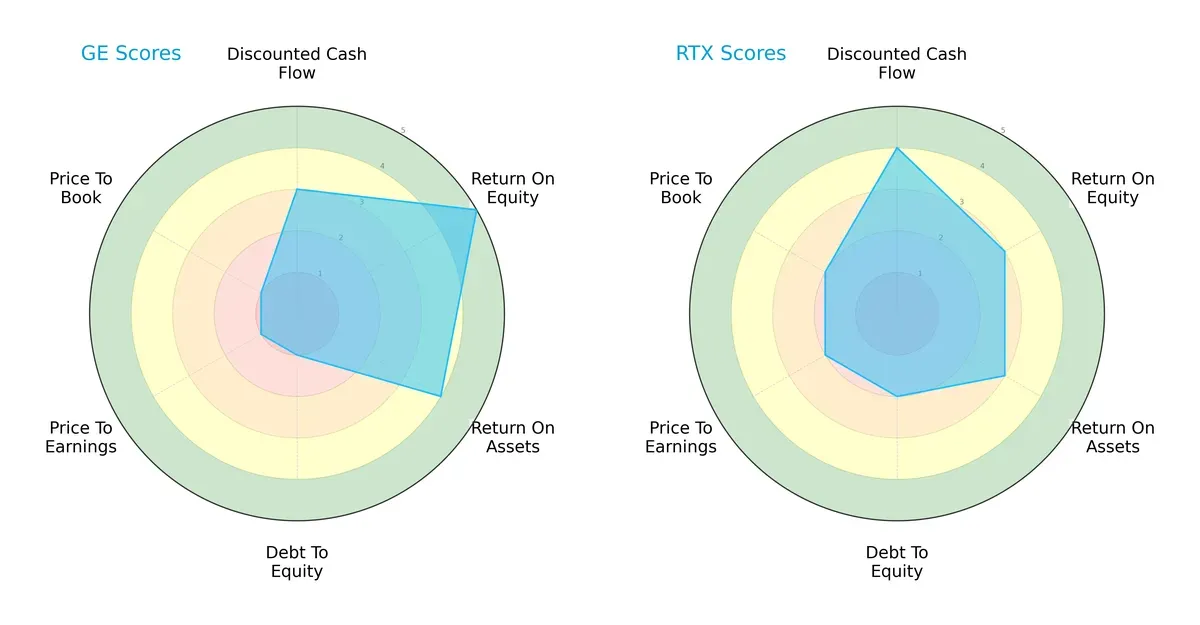
GE Aerospace excels in profitability metrics with a high ROE (5) and ROA (4) but suffers from a highly unfavorable debt-to-equity and valuation profile (both scores at 1). RTX Corporation demonstrates a more balanced scorecard, with moderately strong DCF (4), debt-to-equity (2), and valuation metrics (P/E and P/B at 2). GE relies heavily on operational efficiency but carries significant financial risk and valuation concerns. RTX offers a steadier risk-return trade-off, appealing to investors favoring stability over concentrated strengths.
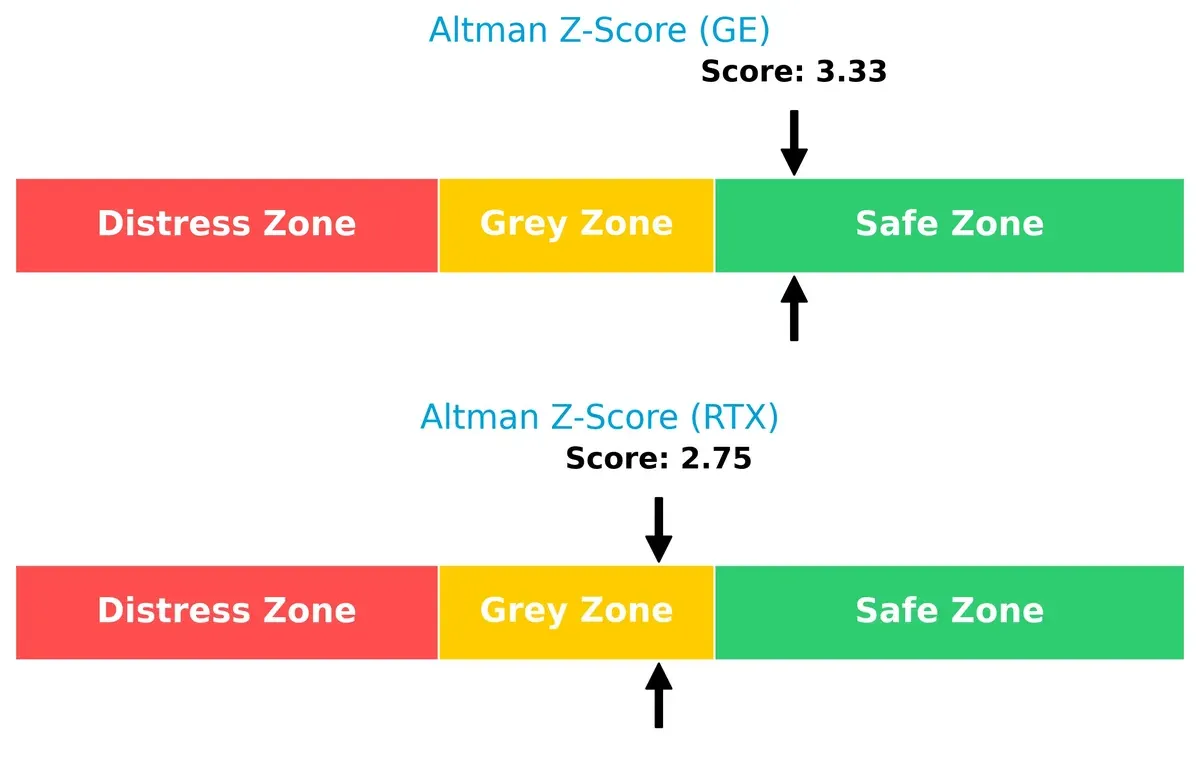
Bankruptcy Risk: Solvency Showdown
GE Aerospace’s Altman Z-Score (3.33) places it securely in the safe zone, signaling strong solvency. RTX Corporation’s score (2.75) lands in the grey zone, indicating moderate bankruptcy risk amid current market pressures:
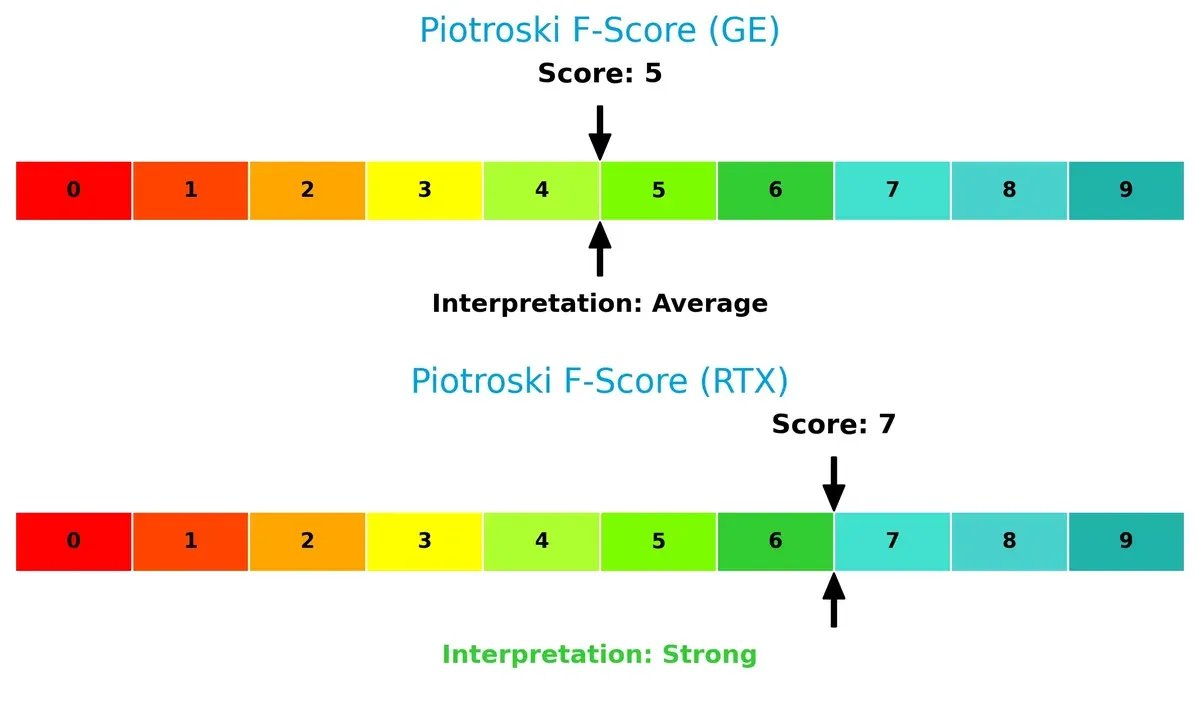
Financial Health: Quality of Operations
RTX Corporation’s Piotroski F-Score of 7 signals robust financial health, outperforming GE Aerospace’s average score of 5. GE’s weaker internal metrics suggest caution compared to RTX’s stronger operational quality:
How are the two companies positioned?
This section dissects GE Aerospace and RTX Corporation’s operational DNA by comparing their revenue distribution and internal dynamics. The goal is to confront their economic moats to determine which offers the most resilient, sustainable competitive advantage today.
Revenue Segmentation: The Strategic Mix
This visual comparison dissects how GE Aerospace and RTX Corporation diversify their income streams and where their primary sector bets lie:
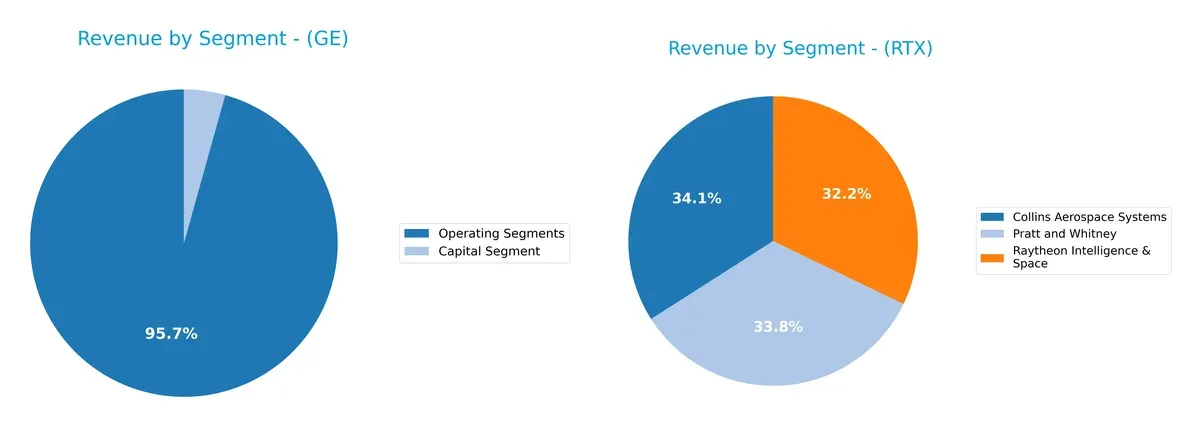
GE Aerospace pivots around its Aerospace Segment, generating $31.8B in 2023, dwarfing its Power ($17.7B) and Renewable Energy ($15.1B) units. RTX Corporation delivers a more balanced spread, with Collins Aerospace ($28.3B), Pratt & Whitney ($28.1B), and Raytheon Intelligence & Space ($26.7B) closely matched in 2024. GE’s concentration risks hinge on aerospace reliance, while RTX leverages ecosystem lock-in across defense and aerospace sectors. RTX’s diversified portfolio cushions cyclical shocks better than GE’s focused aerospace dominance.
Strengths and Weaknesses Comparison
This table compares the strengths and weaknesses of GE Aerospace and RTX Corporation based on diversification, profitability, financials, innovation, global presence, and market share:
GE Aerospace Strengths
- Diverse segments including aerospace, power, and renewable energy
- Strong net margin at 19% and ROE at 46.6%
- Favorable debt-to-assets ratio at 16%
- High fixed asset turnover at 5.74
RTX Corporation Strengths
- Balanced revenue across Collins Aerospace, Pratt & Whitney, and Raytheon units
- Favorable WACC at 5.56%
- Low debt and favorable debt-to-assets ratio
- Solid interest coverage at 5.77
GE Aerospace Weaknesses
- Unfavorable valuation with PE at 37.76 and PB at 17.6
- Quick ratio below 1 at 0.74 indicates liquidity concerns
- Debt to equity at 1.1 is relatively high
- Asset turnover low at 0.35
- Dividend yield low at 0.44%
RTX Corporation Weaknesses
- Zero or unavailable ROE and ROIC raise profitability concerns
- Current and quick ratios at zero indicate liquidity and reporting gaps
- Unfavorable asset and fixed asset turnover
- PE remains high at 36.64 despite weak profitability
GE Aerospace benefits from strong profitability and diversified industrial segments, but faces challenges in valuation and liquidity. RTX shows a balanced revenue mix and strong capital structure, yet profitability metrics and liquidity ratios signal caution. Both companies must address weaknesses to sustain competitive advantage.
The Moat Duel: Analyzing Competitive Defensibility
A structural moat shields long-term profits from competitive erosion. Without it, profits erode quickly. Let’s dissect the moats of GE Aerospace and RTX Corporation:
GE Aerospace: Innovation and Service Integration Moat
GE Aerospace leverages intangible assets and service integration. Its high 23.65% EBIT margin reflects operational strength and pricing power. Expansion in defense propulsion deepens this moat in 2026.
RTX Corporation: Diversified Aerospace Systems Moat
RTX’s moat stems from diversified aerospace systems and broad government contracts. Unlike GE, RTX shows weaker margin stability with an 11.92% EBIT margin. Market disruption risks persist amid declining ROIC trends.
Innovation Leadership vs. Diversification Breadth
GE Aerospace holds a deeper moat driven by innovation and margin resilience, despite current value destruction. RTX’s broad portfolio lacks ROIC durability, weakening its moat. GE is better positioned to defend market share.
Which stock offers better returns?
Over the past year, both GE Aerospace and RTX Corporation showed strong price appreciation with distinct momentum patterns and evolving buyer dynamics.
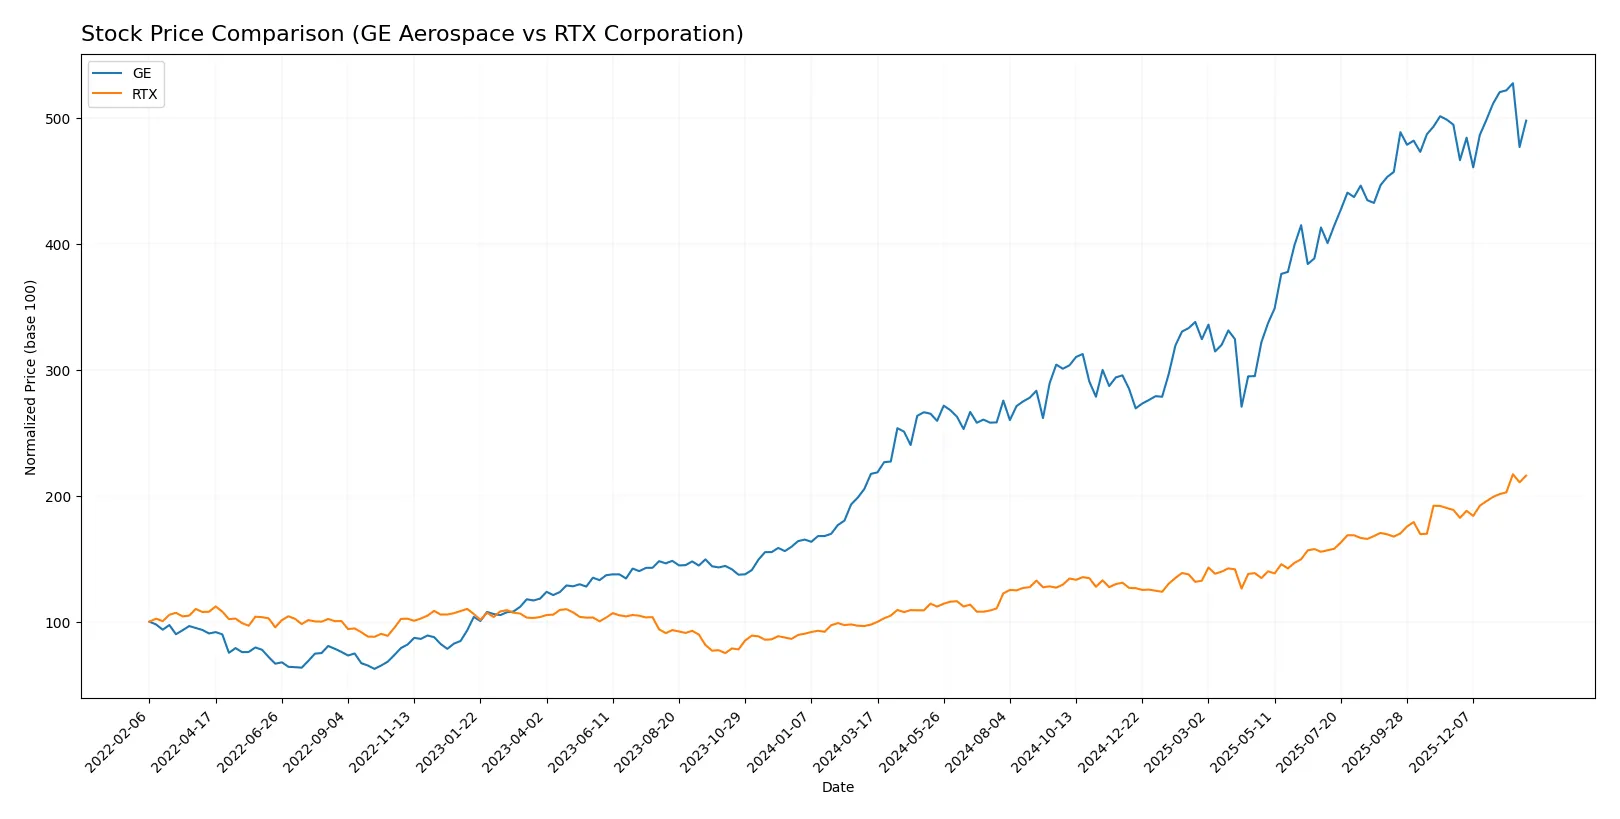
Trend Comparison
GE Aerospace’s stock price rose 129.03% over the last 12 months, marking a bullish trend with decelerating momentum and high volatility. The price peaked at 325.12 and bottomed at 133.95.
RTX Corporation gained 121.09% in the same period, also bullish but with accelerating momentum and lower volatility. Its price ranged between 90.88 and 201.92, showing strengthening upward pressure.
Comparing trends, GE Aerospace delivered a slightly higher total return but with slowing acceleration. RTX showed robust gains with accelerating momentum, indicating stronger recent market performance.
Target Prices
Analysts present a confident consensus on target prices for GE Aerospace and RTX Corporation.
| Company | Target Low | Target High | Consensus |
|---|---|---|---|
| GE Aerospace | 374 | 387 | 380.33 |
| RTX Corporation | 168 | 235 | 214.7 |
The consensus target prices suggest both stocks have upside potential from current levels. GE trades at 306.79, well below its 380 consensus, while RTX’s 200.93 price sits under its 214.7 target, indicating moderate analyst optimism.

Don’t Let Luck Decide Your Entry Point
Optimize your entry points with our advanced ProRealTime indicators. You’ll get efficient buy signals with precise price targets for maximum performance. Start outperforming now!
How do institutions grade them?
GE Aerospace Grades
Here are the recent grades assigned to GE Aerospace by major financial institutions:
| Grading Company | Action | New Grade | Date |
|---|---|---|---|
| JP Morgan | Maintain | Overweight | 2026-01-26 |
| Citigroup | Maintain | Buy | 2026-01-23 |
| UBS | Maintain | Buy | 2026-01-23 |
| UBS | Maintain | Buy | 2026-01-15 |
| Citigroup | Maintain | Buy | 2026-01-13 |
| JP Morgan | Maintain | Overweight | 2025-10-27 |
| B of A Securities | Maintain | Buy | 2025-10-27 |
| UBS | Maintain | Buy | 2025-10-22 |
| RBC Capital | Maintain | Outperform | 2025-10-22 |
| Barclays | Maintain | Overweight | 2025-07-23 |
RTX Corporation Grades
Below are the latest grades issued by reputable firms for RTX Corporation:
| Grading Company | Action | New Grade | Date |
|---|---|---|---|
| UBS | Maintain | Neutral | 2026-01-28 |
| JP Morgan | Maintain | Overweight | 2026-01-28 |
| RBC Capital | Maintain | Outperform | 2026-01-28 |
| Citigroup | Maintain | Buy | 2026-01-13 |
| UBS | Downgrade | Neutral | 2026-01-05 |
| JP Morgan | Maintain | Overweight | 2025-12-19 |
| B of A Securities | Maintain | Buy | 2025-10-27 |
| UBS | Maintain | Buy | 2025-10-22 |
| Goldman Sachs | Maintain | Neutral | 2025-10-22 |
| Susquehanna | Maintain | Positive | 2025-10-22 |
Which company has the best grades?
GE Aerospace consistently earns Buy and Overweight ratings, reflecting steady confidence from analysts. RTX Corporation shows a wider range, including Neutral grades and a recent downgrade, indicating more mixed sentiment. Investors might view GE’s grades as a stronger signal of institutional support.
Risks specific to each company
The following categories identify critical pressure points and systemic threats facing GE Aerospace and RTX Corporation in the 2026 market environment:
1. Market & Competition
GE Aerospace
- Faces intense competition in commercial and military aerospace with high P/E and P/B ratios signaling market premium risk.
RTX Corporation
- Operates a diversified portfolio but shows neutral net margin and moderate valuation, facing competition across multiple defense segments.
2. Capital Structure & Debt
GE Aerospace
- Debt-to-equity ratio at 1.1 is high, reflecting financial leverage risk despite favorable debt-to-assets and interest coverage.
RTX Corporation
- Displays strong balance sheet metrics with no reported debt, lowering financial risk substantially.
3. Stock Volatility
GE Aerospace
- Beta of 1.403 indicates higher volatility and sensitivity to market swings.
RTX Corporation
- Beta of 0.438 shows lower volatility, offering more stability to investors.
4. Regulatory & Legal
GE Aerospace
- Subject to aerospace and defense regulations with potential compliance costs impacting margins.
RTX Corporation
- Similar regulatory exposure but diversified defense segments may mitigate isolated regulatory impacts.
5. Supply Chain & Operations
GE Aerospace
- Reliant on complex supply chains for engine manufacturing; operational efficiency pressure exists given low asset turnover.
RTX Corporation
- Larger scale with 185K employees and diversified operations may buffer supply chain disruptions better.
6. ESG & Climate Transition
GE Aerospace
- Growing pressure to innovate cleaner propulsion systems amid climate transition mandates.
RTX Corporation
- Faces similar ESG demands but with broader product lines, including defense tech potentially less exposed to climate regulation risk.
7. Geopolitical Exposure
GE Aerospace
- Exposure to global military contracts creates risk from geopolitical tensions and policy shifts.
RTX Corporation
- International defense and government contracts increase geopolitical risk but also diversify geographic dependencies.
Which company shows a better risk-adjusted profile?
GE Aerospace’s most impactful risk is its elevated financial leverage amid market valuation pressures, raising solvency concerns despite strong profitability. RTX Corporation’s key risk lies in its zero reported leverage data gaps, which obscure true financial health, despite its stable stock volatility and diversified operations. I find RTX’s lower volatility and stronger balance sheet metrics suggest a better risk-adjusted profile. Recent data showing GE’s beta above 1.4 versus RTX’s 0.44 confirms greater market sensitivity for GE, reinforcing my caution.
Final Verdict: Which stock to choose?
GE Aerospace’s superpower lies in its robust profit engine and growing profitability despite some value destruction. Its rising ROIC signals improving capital efficiency. A point of vigilance remains its high leverage and stretched valuation multiples. GE suits portfolios targeting aggressive growth with a tolerance for balance sheet risk.
RTX Corporation boasts a strategic moat through solid recurring revenues and prudent capital allocation, reflected in a strong income quality score. Its safer debt profile and better Altman Z-Score indicate more financial stability than GE. RTX fits well for GARP investors who seek steady growth with reasonable risk controls.
If you prioritize dynamic profitability and are comfortable with higher leverage, GE Aerospace outshines with superior earnings growth and operational momentum. However, if you seek a more stable investment with consistent cash flow and stronger financial health, RTX Corporation offers better stability and risk management. Both present slightly unfavorable ratio profiles, underscoring the need for careful risk evaluation.
Disclaimer: Investment carries a risk of loss of initial capital. The past performance is not a reliable indicator of future results. Be sure to understand risks before making an investment decision.
Go Further
I encourage you to read the complete analyses of GE Aerospace and RTX Corporation to enhance your investment decisions: