Home > Comparison > Industrials > GE vs NOC
The strategic rivalry between GE Aerospace and Northrop Grumman Corporation defines the current trajectory of the Aerospace & Defense sector. GE Aerospace operates as a diversified industrial powerhouse focusing on jet engines and propulsion systems, while Northrop Grumman emphasizes advanced aerospace, defense systems, and mission-critical technologies. This analysis evaluates their distinct operational models to identify which offers superior risk-adjusted returns for a diversified portfolio in a complex geopolitical landscape.
Table of contents
Companies Overview
GE Aerospace and Northrop Grumman Corporation stand as titans in the aerospace and defense sector, shaping global aviation and security landscapes.
GE Aerospace: Powering Flight with Engine Innovation
GE Aerospace leads in jet and turboprop engines, driving revenue through design, manufacturing, and servicing for commercial, military, and business aircraft. Its 2026 strategy focuses on integrating advanced propulsion technologies across commercial and defense markets, leveraging brands like Avio Aero and GE Additive to enhance engine performance and reliability.
Northrop Grumman Corporation: Defense Systems and Aerospace Integration
Northrop Grumman dominates with a broad portfolio of aerospace and defense systems, including unmanned aircraft, mission systems, and space technologies. Its 2026 strategic emphasis lies in expanding advanced ISR capabilities, precision weapons, and cyber solutions to maintain superiority in aerospace defense and integrated battle management.
Strategic Collision: Similarities & Divergences
Both companies excel in aerospace and defense but diverge in approach: GE Aerospace centers on engine propulsion and integrated systems, while Northrop Grumman emphasizes end-to-end defense solutions and space technologies. They battle chiefly in military aerospace markets, with GE focusing on propulsion innovation and Northrop on system integration. Their distinct profiles reflect GE’s specialization versus Northrop’s diversified defense ecosystem.
Income Statement Comparison
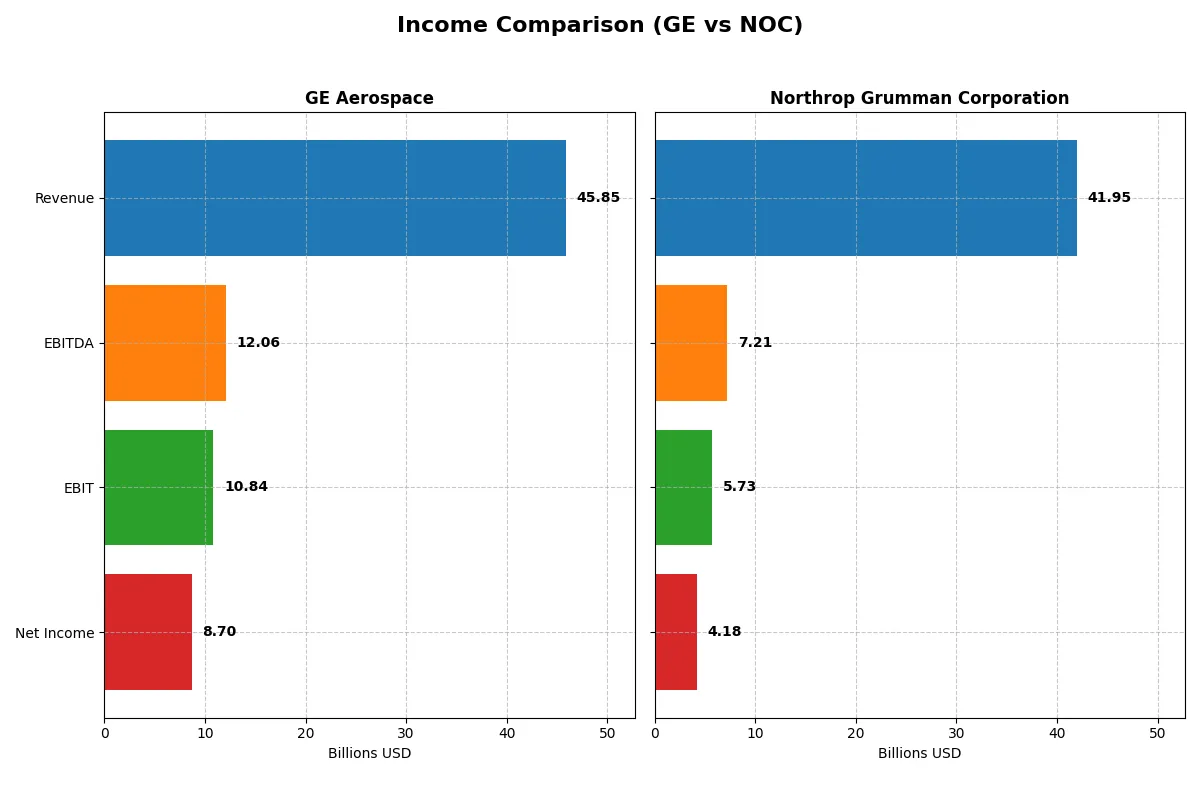
This data dissects the core profitability and scalability of both corporate engines to reveal who dominates the bottom line:
| Metric | GE Aerospace (GE) | Northrop Grumman Corporation (NOC) |
|---|---|---|
| Revenue | 45.9B | 41.95B |
| Cost of Revenue | 28.97B | 33.64B |
| Operating Expenses | 8.12B | 4.03B |
| Gross Profit | 16.89B | 8.31B |
| EBITDA | 12.06B | 7.21B |
| EBIT | 10.84B | 5.73B |
| Interest Expense | 843M | 665M |
| Net Income | 8.70B | 4.18B |
| EPS | 8.16 | 29.14 |
| Fiscal Year | 2025 | 2025 |
Income Statement Analysis: The Bottom-Line Duel
This income statement comparison reveals which company operates its business with greater financial efficiency and momentum.
GE Aerospace Analysis
GE Aerospace’s revenue rose strongly by 18.5% in 2025, hitting $45.9B. Net income surged to $8.7B, reflecting robust profitability. The company sustains strong gross (36.8%) and net margins (19.0%), signaling efficient cost control. Year-over-year growth in EBIT (26.0%) and EPS (36.2%) demonstrates accelerating operational momentum and margin expansion.
Northrop Grumman Corporation Analysis
Northrop Grumman’s revenue grew modestly by 2.2% to $41.9B in 2025, with net income at $4.2B. Gross margin remains subdued at 19.8%, though EBIT and net margins are healthier at 13.7% and 10.0%. Growth metrics are mixed: slight EBIT improvement contrasts with a 2% net margin decline, indicating pressure on profitability despite stable operational performance.
Verdict: Margin Strength vs. Revenue Resilience
GE Aerospace outperforms Northrop Grumman on margin quality and profit growth, with a clear trajectory of expanding earnings and efficiency. Northrop Grumman shows steadier revenue gains but weaker profitability trends. For investors prioritizing earnings power and operational leverage, GE Aerospace presents the more compelling fundamental profile.
Financial Ratios Comparison
These vital ratios act as a diagnostic tool to expose the underlying fiscal health, valuation premiums, and capital efficiency of the companies analyzed:
| Ratios | GE Aerospace (GE) | Northrop Grumman Corporation (NOC) |
|---|---|---|
| ROE | 46.6% | 25.1% |
| ROIC | 8.1% | 9.9% |
| P/E | 37.8 | 19.6 |
| P/B | 17.6 | 4.9 |
| Current Ratio | 1.04 | 1.10 |
| Quick Ratio | 0.74 | 1.10 |
| D/E | 1.10 | 0.11 |
| Debt-to-Assets | 15.7% | 3.6% |
| Interest Coverage | 10.4 | -6.8 |
| Asset Turnover | 0.35 | 0.82 |
| Fixed Asset Turnover | 5.74 | 3.27 |
| Payout ratio | 16.7% | 30.9% |
| Dividend yield | 0.44% | 1.58% |
| Fiscal Year | 2025 | 2025 |
Efficiency & Valuation Duel: The Vital Signs
Financial ratios act as a company’s DNA, unveiling hidden risks and operational strengths critical for sound investment decisions.
GE Aerospace
GE Aerospace exhibits a robust 46.6% ROE and an 18.98% net margin, signaling strong profitability. However, its P/E ratio at 37.76 appears stretched compared to typical industry levels. The stock shows moderate operational efficiency but offers a weak 0.44% dividend yield, suggesting capital reinvestment favors growth and R&D over shareholder payouts.
Northrop Grumman Corporation
Northrop Grumman delivers a solid 25.08% ROE and a 9.97% net margin, reflecting steady profitability. Its P/E ratio of 19.57 is more reasonable, indicating fair valuation. The company maintains a stronger dividend yield of 1.58% and displays favorable leverage and liquidity metrics, emphasizing balanced capital allocation and shareholder returns.
Premium Valuation vs. Operational Safety
GE Aerospace commands a premium valuation with exceptional profitability but carries stretched multiples and weaker liquidity. Northrop Grumman offers a more balanced risk-reward profile with moderate profitability, reasonable valuation, and stronger financial health. Investors seeking growth may lean toward GE, while those prioritizing stability and income may prefer Northrop Grumman.
Which one offers the Superior Shareholder Reward?
I observe GE Aerospace pays a modest 0.44% dividend yield with a low 17% payout ratio, preserving ample free cash flow for reinvestment. Its buybacks remain limited. Northrop Grumman yields 1.58%, with a 31% payout ratio and robust buybacks fueling total returns. Northrop’s higher yield and aggressive buybacks offer a more sustainable, shareholder-friendly distribution model. I favor Northrop Grumman’s superior total return profile for 2026 investors.
Comparative Score Analysis: The Strategic Profile
The radar chart highlights the core financial DNA and trade-offs defining GE Aerospace and Northrop Grumman Corporation:
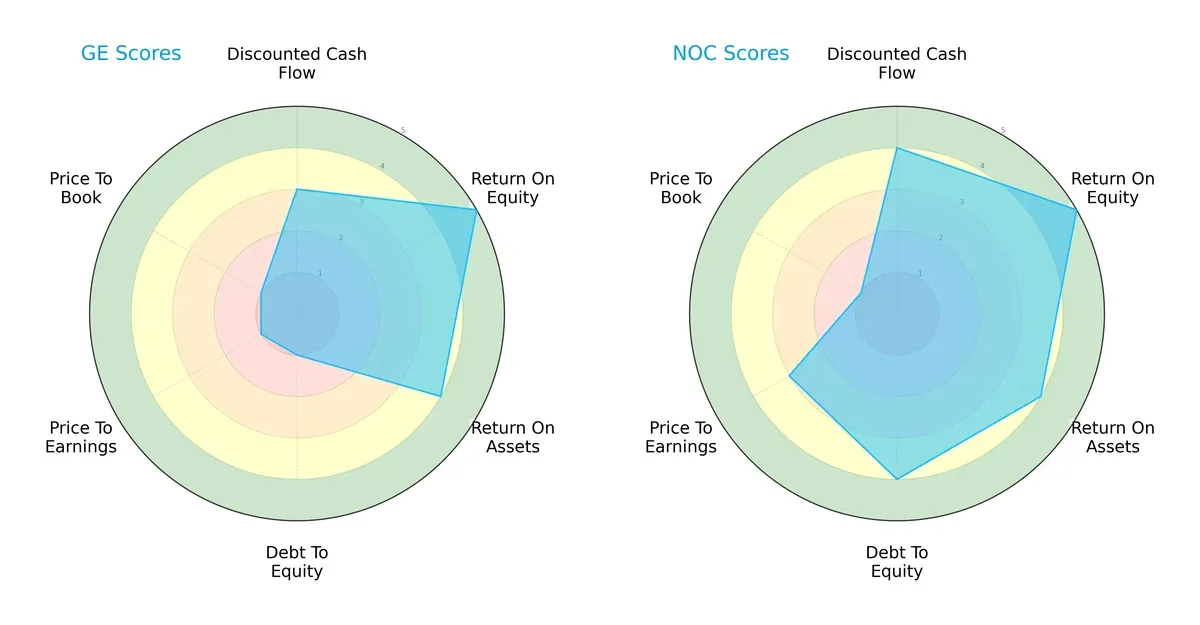
Northrop Grumman delivers a more balanced profile, excelling in debt management (4 vs. 1) and valuation metrics (PE 3 vs. 1), alongside strong DCF and profitability scores. GE Aerospace depends heavily on its profitability edge (ROE 5) but shows red flags in leverage and valuation, indicating higher financial risk and potential overvaluation.
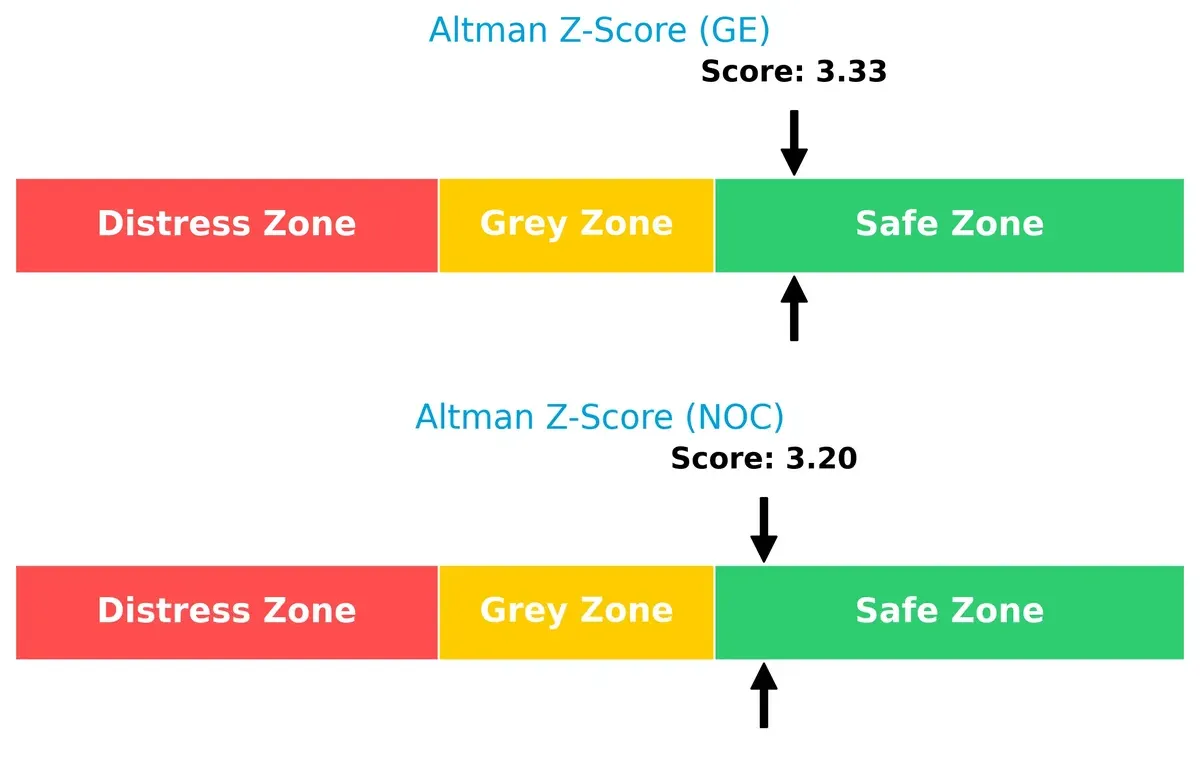
Bankruptcy Risk: Solvency Showdown
Both firms stand safely above the distress threshold, with Altman Z-Scores indicating solid solvency and low bankruptcy risk in the current cycle:
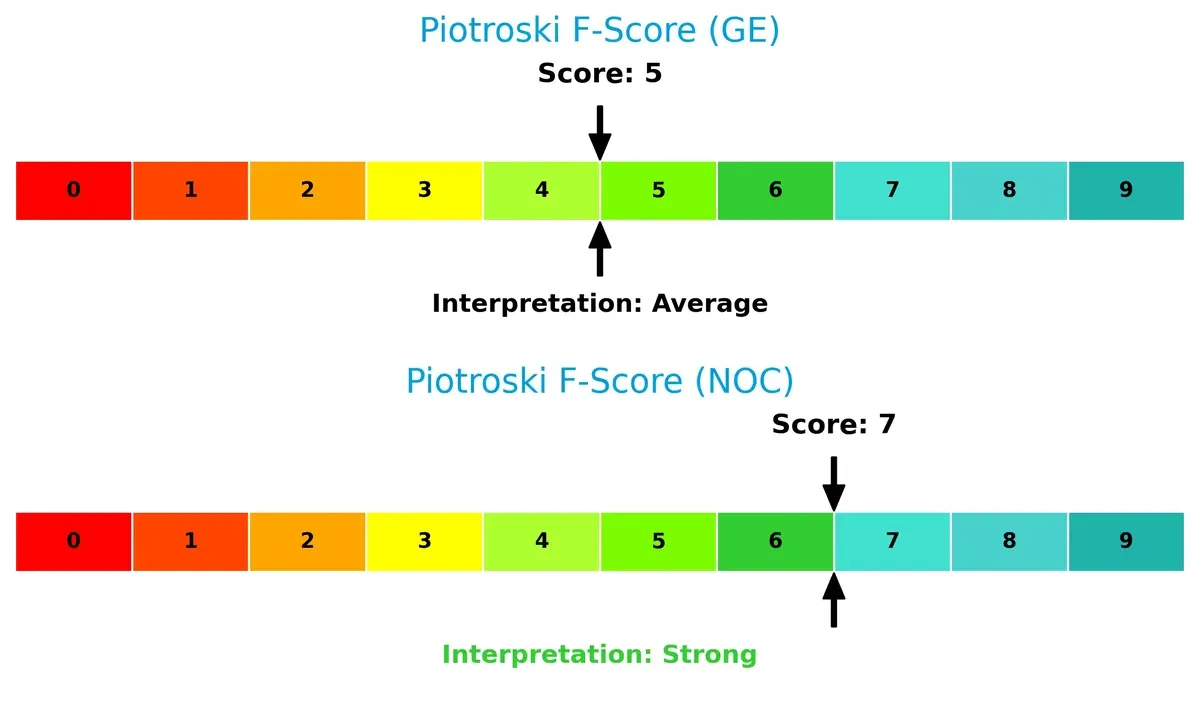
Financial Health: Quality of Operations
Northrop Grumman’s Piotroski F-Score of 7 signals stronger financial health and operational quality than GE Aerospace’s moderate 5, suggesting better internal metrics and fewer red flags:
How are the two companies positioned?
This section dissects the operational DNA of GE and NOC by comparing their revenue distribution and internal strengths and weaknesses. The goal is to confront their economic moats and identify which business model offers the most resilient competitive advantage today.
Revenue Segmentation: The Strategic Mix
This comparison dissects how GE Aerospace and Northrop Grumman diversify income streams and where their primary sector bets lie:
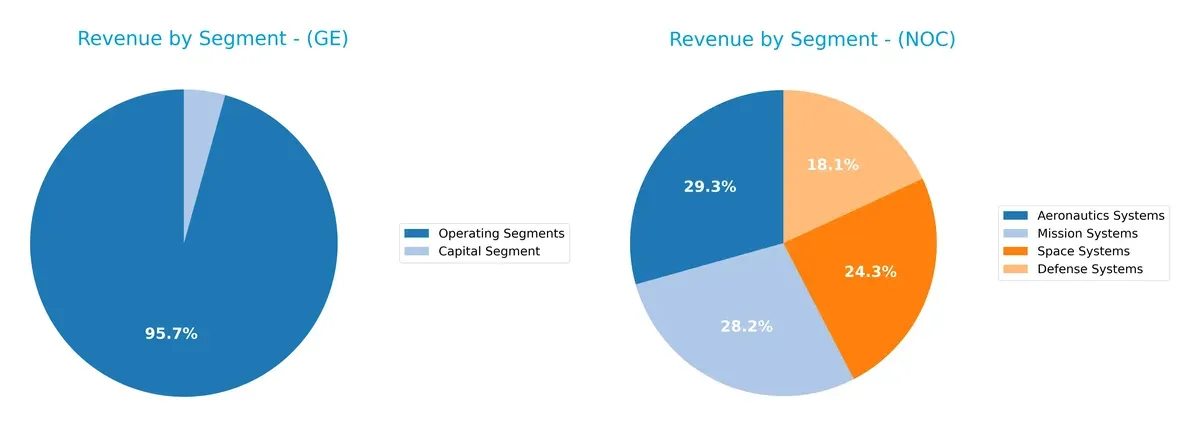
GE Aerospace’s revenue leans heavily on the Aerospace Segment at $31.8B (2023), supported by Power and Renewable Energy segments, showing moderate diversification. Northrop Grumman spreads revenue more evenly across Aeronautics Systems ($13B), Mission Systems ($12.5B), Space Systems ($10.8B), and Defense Systems ($8B) in 2025. GE’s concentration in aerospace anchors its ecosystem dominance, while Northrop’s balanced mix mitigates concentration risk and underpins its defense infrastructure strength.
Strengths and Weaknesses Comparison
This table compares the strengths and weaknesses of GE Aerospace and Northrop Grumman Corporation based on diversification, profitability, financials, innovation, global presence, and market share:
GE Aerospace Strengths
- Diverse segments including aerospace, power, renewable energy, and healthcare
- Favorable net margin at 19% and strong ROE at 46.6%
- Solid interest coverage at 12.86x
- Global presence with significant US and non-US revenues
- High fixed asset turnover at 5.74
Northrop Grumman Corporation Strengths
- Balanced defense segments like aeronautics, mission, space, and defense systems
- Favorable ROE at 25.1% and low WACC at 4.47%
- Strong quick ratio at 1.1 and low debt-to-equity at 0.11
- Dominant US revenue base with growing Asia Pacific and Europe presence
- Favorable fixed asset turnover at 3.27
GE Aerospace Weaknesses
- High valuation multiples with PE of 37.76 and PB of 17.6
- Unfavorable quick ratio at 0.74 and debt-to-equity of 1.1
- Asset turnover low at 0.35
- Dividend yield low at 0.44%
- Slightly unfavorable overall financial ratios
Northrop Grumman Corporation Weaknesses
- Net margin moderate at 9.97% and some neutral ratios
- PB at 4.91 is unfavorable
- Heavy reliance on US market limits global diversification
- Neutral asset turnover at 0.82
- Dividend yield moderate at 1.58%
Both companies show strong profitability and solid market positions in aerospace and defense sectors. GE Aerospace’s broader diversification contrasts with Northrop’s more focused defense segments and stronger balance sheet metrics. Each faces valuation and liquidity challenges, which will affect capital allocation strategies going forward.
The Moat Duel: Analyzing Competitive Defensibility
A structural moat is the sole shield protecting long-term profits from relentless competitive erosion. Let’s dissect how GE Aerospace and Northrop Grumman defend their turf:
GE Aerospace: Intangible Assets and Technological Expertise
GE Aerospace leverages deep intangible assets and advanced jet engine technology. This reflects in its high and improving EBIT margin (23.65%) and net margin (19%). In 2026, expanding integrated systems could solidify its moat despite current ROIC slightly below WACC.
Northrop Grumman Corporation: Defense Systems and Scale Advantage
Northrop Grumman’s moat stems from its expansive defense systems portfolio and scale in mission-critical aerospace tech. It maintains positive ROIC over WACC, signaling value creation, though margins are thinner than GE’s. Future hypersonic and cyber innovations may offset its declining ROIC trend.
The Moat Battle: Intangible Innovation vs. Scale-Driven Defense
GE’s moat is deeper in profitability and innovation, but it currently sheds value with ROIC below WACC. Northrop Grumman creates value with a positive ROIC, though its moat narrows as profitability declines. GE is better positioned to defend market share through technological leadership.
Which stock offers better returns?
Over the past year, both GE Aerospace and Northrop Grumman Corporation show significant price appreciation, with distinct momentum shifts and trading volume dynamics shaping their trajectories.
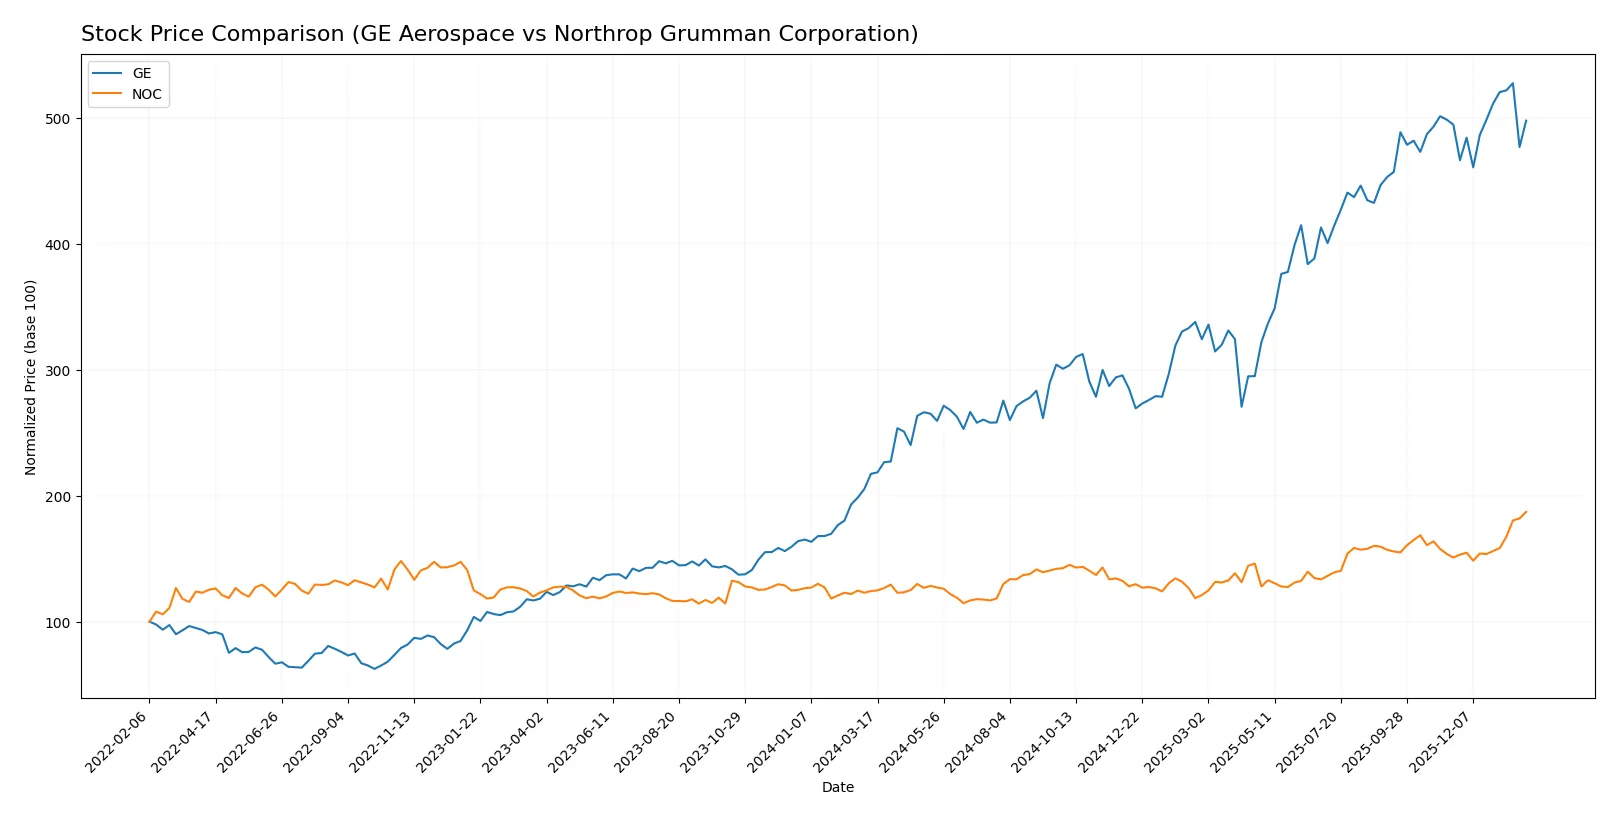
Trend Comparison
GE Aerospace’s stock surged 129.03% over the last 12 months, marking a bullish trend with decelerating momentum and a high volatility of 56.42. The price ranged between 134 and 325.12.
Northrop Grumman’s stock rose 50.66% in the same period, also bullish but accelerating, with volatility slightly higher at 57.5 and price fluctuations from 424.09 to 692.26.
GE leads in total percentage gains, though Northrop Grumman shows accelerating strength and stronger buyer dominance recently, indicating differentiated market dynamics.
Target Prices
Analysts present a bullish target consensus for both GE Aerospace and Northrop Grumman Corporation.
| Company | Target Low | Target High | Consensus |
|---|---|---|---|
| GE Aerospace | 374 | 387 | 380.33 |
| Northrop Grumman Corporation | 623 | 815 | 732.25 |
GE Aerospace’s target consensus exceeds its current price of 306.79 by nearly 24%. Northrop Grumman’s consensus target of 732.25 suggests a 5.7% upside from the current 692.26 price, reflecting moderate optimism.

Don’t Let Luck Decide Your Entry Point
Optimize your entry points with our advanced ProRealTime indicators. You’ll get efficient buy signals with precise price targets for maximum performance. Start outperforming now!
How do institutions grade them?
GE Aerospace Grades
These are the most recent institutional grades for GE Aerospace:
| Grading Company | Action | New Grade | Date |
|---|---|---|---|
| JP Morgan | Maintain | Overweight | 2026-01-26 |
| Citigroup | Maintain | Buy | 2026-01-23 |
| UBS | Maintain | Buy | 2026-01-23 |
| UBS | Maintain | Buy | 2026-01-15 |
| Citigroup | Maintain | Buy | 2026-01-13 |
| JP Morgan | Maintain | Overweight | 2025-10-27 |
| B of A Securities | Maintain | Buy | 2025-10-27 |
| UBS | Maintain | Buy | 2025-10-22 |
| RBC Capital | Maintain | Outperform | 2025-10-22 |
| Barclays | Maintain | Overweight | 2025-07-23 |
Northrop Grumman Corporation Grades
These are the most recent institutional grades for Northrop Grumman Corporation:
| Grading Company | Action | New Grade | Date |
|---|---|---|---|
| B of A Securities | Maintain | Buy | 2026-01-28 |
| BTIG | Maintain | Buy | 2026-01-28 |
| UBS | Maintain | Buy | 2026-01-28 |
| RBC Capital | Maintain | Outperform | 2026-01-28 |
| Citigroup | Maintain | Buy | 2026-01-28 |
| UBS | Maintain | Buy | 2026-01-15 |
| Citigroup | Maintain | Buy | 2026-01-13 |
| Truist Securities | Downgrade | Hold | 2026-01-09 |
| Morgan Stanley | Maintain | Overweight | 2025-12-16 |
| Alembic Global | Upgrade | Overweight | 2025-12-15 |
Which company has the best grades?
Both companies receive predominantly positive grades with consistent Buy or Overweight ratings. GE Aerospace shows stable Buy and Overweight grades, while Northrop Grumman also holds Outperform ratings but includes one recent Hold downgrade. GE’s grades appear slightly more uniform, potentially suggesting steadier analyst confidence. Investors may interpret this as GE having marginally stronger institutional support.
Risks specific to each company
The following categories identify the critical pressure points and systemic threats facing both firms in the 2026 market environment:
1. Market & Competition
GE Aerospace
- Faces intense competition in commercial and military engines; high P/E and PB ratios suggest investor caution.
Northrop Grumman Corporation
- Competes in diverse defense segments with strong ROE and favorable WACC; valuation appears more balanced.
2. Capital Structure & Debt
GE Aerospace
- High debt-to-equity (1.1) is a red flag; interest coverage is strong but leverage poses risk.
Northrop Grumman Corporation
- Low debt-to-equity (0.11) and solid interest coverage underline a conservative balance sheet.
3. Stock Volatility
GE Aerospace
- Beta of 1.403 indicates higher volatility and sensitivity to market swings.
Northrop Grumman Corporation
- Extremely low beta (0.049) reflects defensive stock behavior and lower volatility.
4. Regulatory & Legal
GE Aerospace
- Subject to aerospace and defense regulations; commercial exposure adds complexity.
Northrop Grumman Corporation
- Heavy reliance on defense contracts increases regulatory scrutiny but offers stable government revenue.
5. Supply Chain & Operations
GE Aerospace
- Global supply chains for complex engine parts expose it to operational risks.
Northrop Grumman Corporation
- Diverse product lines and in-house systems reduce supply chain vulnerabilities.
6. ESG & Climate Transition
GE Aerospace
- Pressure to innovate cleaner engine technology amid climate regulations.
Northrop Grumman Corporation
- Faces challenges balancing defense production with ESG expectations; less exposed to commercial emissions.
7. Geopolitical Exposure
GE Aerospace
- Global commercial and military sales subject to geopolitical tensions and trade policy shifts.
Northrop Grumman Corporation
- Concentrated defense contracts mostly with US government limit international geopolitical risk.
Which company shows a better risk-adjusted profile?
Northrop Grumman’s lower leverage, defensive stock volatility, and diversified defense portfolio create a more stable risk profile. GE Aerospace’s high debt and market sensitivity increase its vulnerability despite strong profitability. Notably, GE’s debt-to-equity ratio remains a significant risk, while Northrop’s low beta confirms defensive resilience.
Final Verdict: Which stock to choose?
GE Aerospace’s superpower lies in its accelerating profitability and exceptional return on equity, showcasing a powerful turnaround. However, its capital structure and valuation multiples remain points of vigilance. This stock fits well in aggressive growth portfolios willing to tolerate balance sheet risks for outsized earnings growth.
Northrop Grumman commands a strategic moat through efficient capital use and a robust safety profile, evidenced by low leverage and solid free cash flow. Compared to GE, it offers better financial stability and consistent returns, making it suitable for GARP investors seeking steady growth with moderate risk.
If you prioritize rapid profit expansion and are comfortable with leverage concerns, GE Aerospace outshines as the compelling choice due to its improving operating returns. However, if you seek better stability and capital discipline, Northrop Grumman offers a slightly favorable moat and a more conservative risk profile, commanding a premium in stable income generation.
Disclaimer: Investment carries a risk of loss of initial capital. The past performance is not a reliable indicator of future results. Be sure to understand risks before making an investment decision.
Go Further
I encourage you to read the complete analyses of GE Aerospace and Northrop Grumman Corporation to enhance your investment decisions: