Home > Comparison > Industrials > GE vs LMT
The strategic rivalry between GE Aerospace and Lockheed Martin defines the current trajectory of the aerospace and defense sector. GE Aerospace operates as a diversified engine manufacturer with a strong commercial focus, while Lockheed Martin leads as a defense technology integrator with broad military systems. This head-to-head highlights a contrast between industrial manufacturing scale and advanced defense innovation. This analysis will determine which trajectory offers superior risk-adjusted returns for a diversified portfolio.

Table of contents
Companies Overview
GE Aerospace and Lockheed Martin Corporation are pivotal players shaping the Aerospace & Defense industry landscape.
GE Aerospace: Engine Powerhouse and Systems Innovator
GE Aerospace dominates the aircraft engine market by designing and servicing jet and turboprop engines for commercial, military, and business aviation. Its core revenue stems from Commercial Engines & Services and Defense & Propulsion Technologies segments. In 2026, GE prioritizes integrated systems innovation and propulsion technology leadership, leveraging brands like Avio Aero and GE Additive to sustain its competitive advantage.
Lockheed Martin Corporation: Defense Systems and Aerospace Leader
Lockheed Martin leads in aerospace and security by developing advanced aircraft, missile defense, and space systems. Its revenue streams come from Aeronautics, Missiles and Fire Control, Rotary and Mission Systems, and Space segments. The company’s 2026 focus centers on cutting-edge defense technologies and network-enabled situational awareness, supporting U.S. government and allied military contracts as its market position.
Strategic Collision: Similarities & Divergences
Both firms operate in aerospace and defense but differ strategically; GE emphasizes propulsion and integrated engines, while Lockheed Martin pursues a broad defense technology ecosystem. Their primary battleground lies in military aviation and advanced propulsion systems. Investment profiles diverge sharply—GE’s innovation in engine tech contrasts with Lockheed’s expansive defense portfolio and government reliance, defining distinct risk and growth dynamics.
Income Statement Comparison
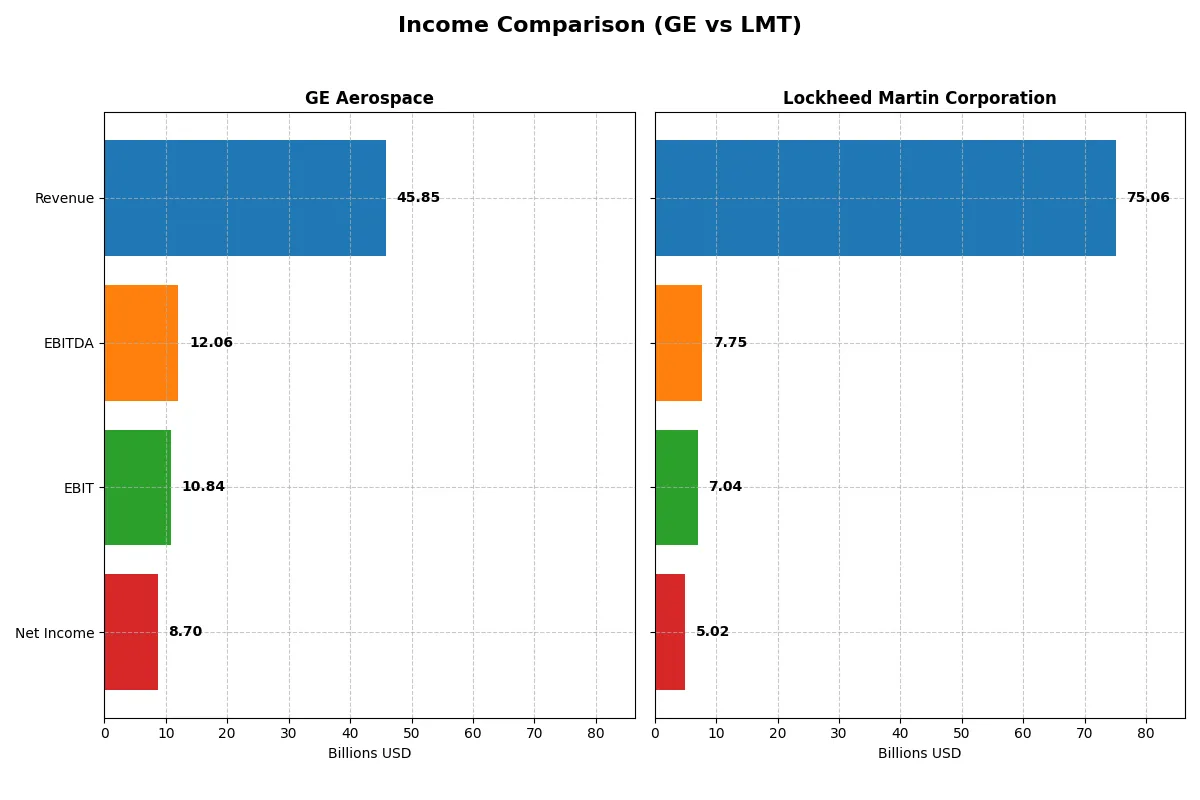
This data dissects the core profitability and scalability of both corporate engines to reveal who dominates the bottom line:
| Metric | GE Aerospace (GE) | Lockheed Martin Corporation (LMT) |
|---|---|---|
| Revenue | 45.9B | 75.1B |
| Cost of Revenue | 28.97B | 67.43B |
| Operating Expenses | 8.12B | -0.10B |
| Gross Profit | 16.89B | 7.62B |
| EBITDA | 12.06B | 7.75B |
| EBIT | 10.84B | 7.04B |
| Interest Expense | 843M | 1.12B |
| Net Income | 8.70B | 5.02B |
| EPS | 8.16 | 21.56 |
| Fiscal Year | 2025 | 2025 |
Income Statement Analysis: The Bottom-Line Duel
This income statement comparison reveals which company operates its financial engine with greater efficiency and profitability.
GE Aerospace Analysis
GE Aerospace’s revenue rose steadily from $29B in 2022 to $45.9B in 2025, reflecting solid top-line momentum. Its net income surged from $336M in 2022 to $8.7B in 2025, demonstrating impressive bottom-line recovery. Gross margin improved to 36.8%, and net margin reached nearly 19%, signaling enhanced operational efficiency and strong profitability gains in 2025.
Lockheed Martin Corporation Analysis
Lockheed Martin’s revenue grew moderately from $66B in 2022 to $75B in 2025, showing stable scale expansion. However, net income declined from $5.7B in 2022 to $5B in 2025, indicating margin pressure. Its gross margin stood at a modest 10.2%, with a net margin of 6.7%, reflecting constrained profitability despite consistent revenue growth and controlled interest expense.
Verdict: Efficiency Surge vs. Scale Stability
GE Aerospace outperforms Lockheed Martin by delivering superior margin expansion and robust net income growth. While Lockheed Martin maintains higher revenue scale, its shrinking margins and net income lag behind GE’s sharp profitability gains. For investors, GE’s profile signals a more attractive blend of efficiency and earnings momentum in the current market cycle.
Financial Ratios Comparison
These vital ratios act as a diagnostic tool to expose the underlying fiscal health, valuation premiums, and capital efficiency of the companies compared below:
| Ratios | GE Aerospace (GE) | Lockheed Martin Corporation (LMT) |
|---|---|---|
| ROE | 46.60% | 74.65% |
| ROIC | 8.12% | 17.39% |
| P/E | 37.76 | 22.26 |
| P/B | 17.60 | 16.62 |
| Current Ratio | 1.04 | 1.09 |
| Quick Ratio | 0.74 | 0.94 |
| D/E | 1.10 | 0.17 |
| Debt-to-Assets | 15.74% | 1.95% |
| Interest Coverage | 10.40 | 6.92 |
| Asset Turnover | 0.35 | 1.25 |
| Fixed Asset Turnover | 5.74 | 8.46 |
| Payout Ratio | 16.68% | 62.41% |
| Dividend Yield | 0.44% | 2.80% |
| Fiscal Year | 2025 | 2025 |
Efficiency & Valuation Duel: The Vital Signs
Ratios act as a company’s DNA, revealing hidden risks and operational excellence that shape investment decisions clearly and decisively.
GE Aerospace
GE Aerospace posts a strong 46.6% ROE and an 18.98% net margin, signaling robust profitability. However, its valuation appears stretched with a 37.76 P/E and 17.6 P/B, indicating market optimism. The firm’s dividend yield is low at 0.44%, reflecting limited shareholder payouts amid reinvestment in R&D and growth initiatives.
Lockheed Martin Corporation
Lockheed Martin delivers an exceptional 74.65% ROE and a solid 6.68% net margin, underscoring operational efficiency. Its P/E of 22.26 is reasonable, though a 16.62 P/B flags some valuation caution. The company offers a healthy 2.8% dividend yield, balancing shareholder returns with conservative leverage and strong capital discipline.
Premium Valuation vs. Operational Safety
Lockheed Martin offers a better balance of risk and reward, combining high profitability with a more reasonable valuation and attractive dividends. GE’s elevated valuation and lower payout suggest a growth-oriented profile suited for investors prioritizing reinvestment over immediate income.
Which one offers the Superior Shareholder Reward?
I see GE Aerospace pays a modest 0.44% dividend yield with a low 17% payout ratio, signaling ample room to reinvest or grow dividends. Its free cash flow covers dividends 3.1x, confirming sustainability. GE’s buyback activity is less intense, limiting total shareholder return. Conversely, Lockheed Martin offers a strong 2.8% yield with a higher 62% payout ratio but still maintains solid free cash flow coverage at 1.8x. LMT aggressively repurchases shares, fueling total return alongside dividends. Historically, Lockheed’s distribution mix suits income and capital gains seekers, while GE prioritizes cautious reinvestment. For 2026, I prefer Lockheed Martin’s robust yield and buybacks, which deliver superior total shareholder rewards.
Comparative Score Analysis: The Strategic Profile
The radar chart reveals the fundamental DNA and trade-offs of GE Aerospace and Lockheed Martin Corporation, highlighting their strategic financial profiles:
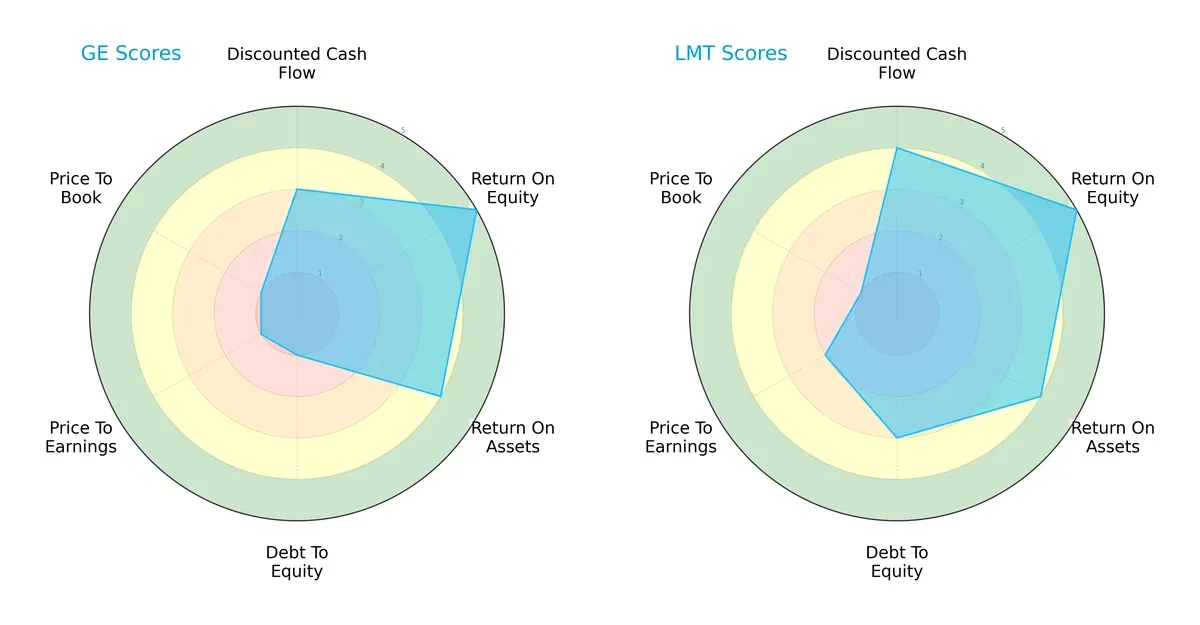
Lockheed Martin shows stronger discounted cash flow and debt-to-equity scores, signaling better valuation and financial risk management. GE matches Lockheed on return metrics but suffers from high leverage and expensive valuation multiples. Lockheed delivers a more balanced profile; GE depends heavily on operational returns while carrying financial risk.
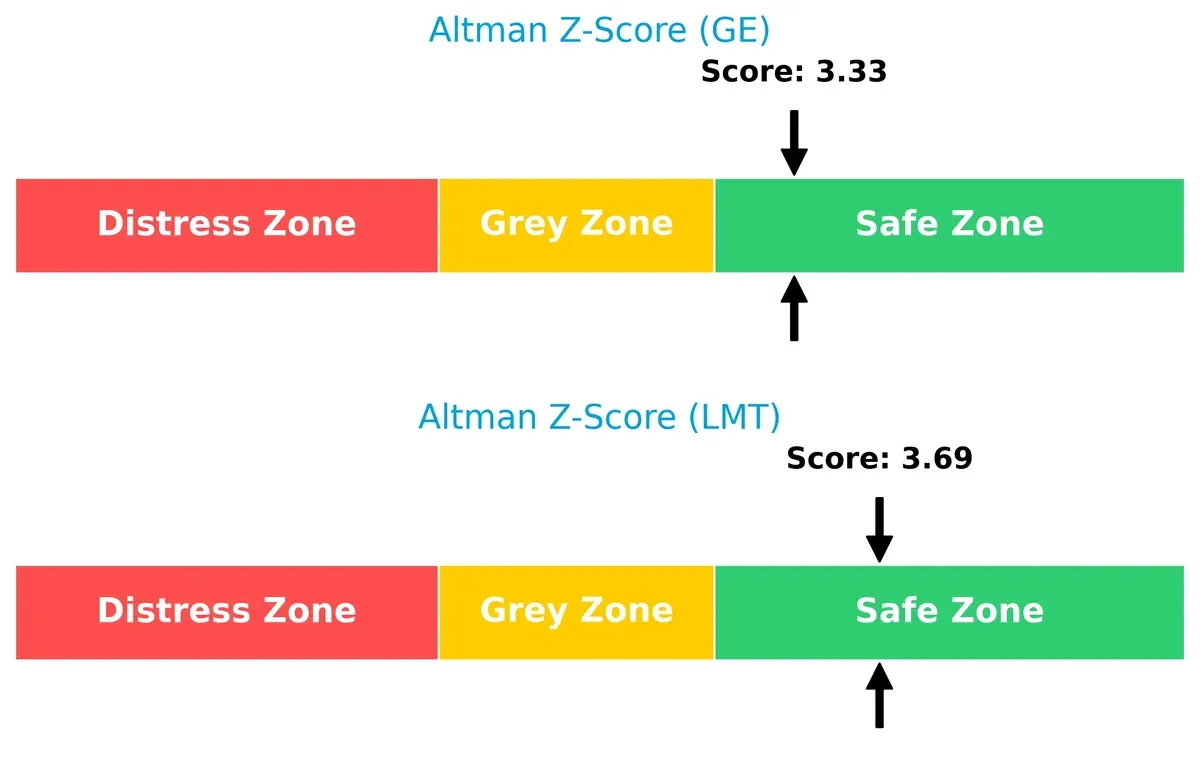
Bankruptcy Risk: Solvency Showdown
The Altman Z-Scores place both firms in the safe zone, with Lockheed Martin slightly more secure. This implies both have solid long-term survival prospects, though Lockheed maintains a stronger buffer:
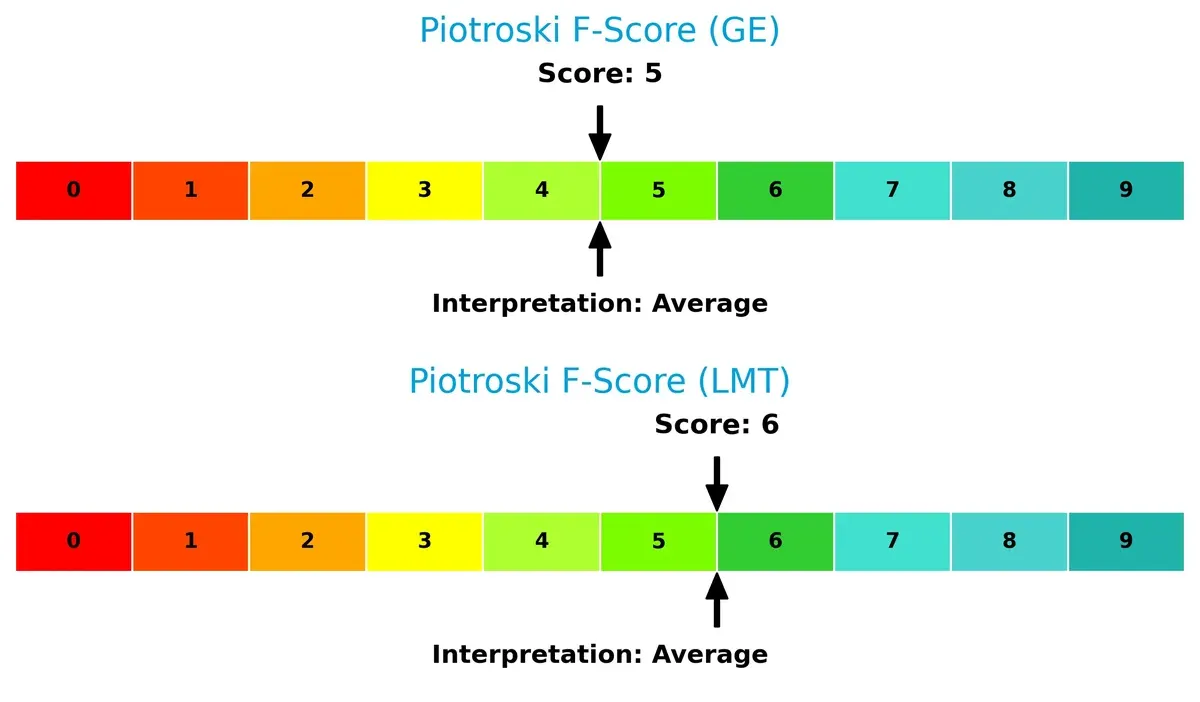
Financial Health: Quality of Operations
Lockheed Martin’s Piotroski F-Score of 6 edges out GE’s 5, indicating marginally better financial health. Neither shows red flags, but Lockheed’s internal metrics demonstrate a more consistent operational quality:
How are the two companies positioned?
This section dissects GE Aerospace and Lockheed Martin’s operational DNA by comparing their revenue distribution and internal strengths and weaknesses. The goal is to confront their economic moats and identify which business model offers the most resilient, sustainable competitive advantage today.
Revenue Segmentation: The Strategic Mix
This visual comparison dissects how GE Aerospace and Lockheed Martin diversify their income streams and where their primary sector bets lie:
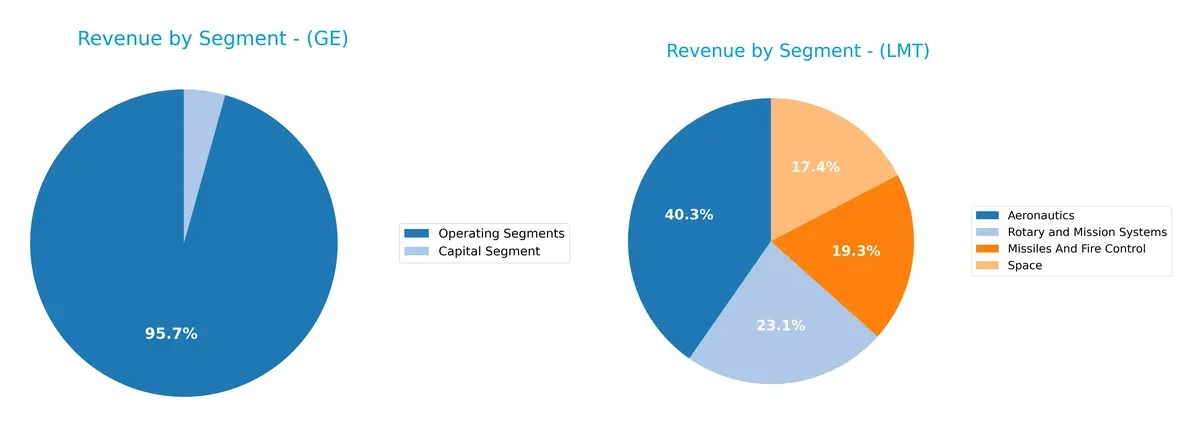
GE Aerospace anchors its revenue in the Aerospace Segment at $31.8B for 2023, with significant contributions from Power ($17.7B) and Renewable Energy ($15.1B). This mix reflects a diversified industrial portfolio balancing commercial aviation and energy infrastructure. Lockheed Martin, by contrast, pivots heavily on Aeronautics at $30.3B in 2025 but maintains strong stakes in Rotary & Mission Systems ($17.3B) and Space ($13.0B), showing a focused defense ecosystem with less diversification risk but higher dependence on government contracts.
Strengths and Weaknesses Comparison
This table compares the Strengths and Weaknesses of GE Aerospace and Lockheed Martin Corporation:
GE Aerospace Strengths
- Diverse revenue streams across aerospace, power, renewable energy
- Strong ROE at 46.6% indicates efficient equity use
- Favorable net margin near 19%
- Solid interest coverage at 12.86 supports debt service
- Significant global presence with $27.7B non-US revenue
Lockheed Martin Corporation Strengths
- High ROE at 74.65% and strong ROIC at 17.39% show excellent capital efficiency
- Low WACC at 4.87% reduces capital costs
- Favorable debt metrics with D/E at 0.17 and 1.95% debt-to-assets
- Robust asset turnover at 1.25 enhances revenue generation
- Attractive dividend yield at 2.8% supports investor returns
GE Aerospace Weaknesses
- Unfavorable high P/E at 37.76 and P/B at 17.6 suggest valuation risk
- Quick ratio of 0.74 signals liquidity concerns
- Elevated debt-to-equity at 1.1 may increase financial risk
- Low asset turnover at 0.35 limits operational efficiency
- Dividend yield low at 0.44%
Lockheed Martin Corporation Weaknesses
- Net margin moderate at 6.68% limits profitability
- P/B ratio unfavorable at 16.62 could imply overvaluation
- Quick ratio neutral at 0.94 may pressure short-term liquidity
Overall, GE Aerospace demonstrates broad diversification and respectable profitability but faces valuation and liquidity challenges. Lockheed Martin excels in capital efficiency and financial strength, with modest profitability and valuation concerns. These factors reflect distinct strategic priorities and financial structures.
The Moat Duel: Analyzing Competitive Defensibility
A structural moat is the only shield protecting long-term profits from relentless competition and market shifts. Let’s dissect the competitive moats of GE Aerospace and Lockheed Martin Corporation:
GE Aerospace: Innovation-Driven Intangible Assets
GE Aerospace’s moat stems from its intangible assets, including proprietary jet engine technology and integrated systems. This advantage fuels high EBIT margins (~23.7%) and robust net margins (~19%). The firm’s expanding presence in Asia and new propulsion tech in 2026 could deepen this moat, but value destruction indicated by ROIC below WACC signals caution.
Lockheed Martin Corporation: Government-Backed Contractual Moat
Lockheed Martin relies on long-term government contracts and defense integration expertise. Its moat contrasts with GE’s innovation edge, delivering stable, albeit lower, margins (EBIT ~9.4%, net margin ~6.7%). Despite a strong ROIC well above WACC, Lockheed faces margin pressure and declining profitability trends. Expansion into cyber and space domains offers growth potential amidst these headwinds.
Innovation Intangibles vs. Government Contractual Moats
GE Aerospace’s growing ROIC trend, despite current value erosion, hints at emerging profitability leverage. Lockheed Martin’s wider economic moat, reflected in ROIC exceeding WACC by 12.5%, is offset by margin compression and declining returns. I find Lockheed better positioned to defend market share long term, though GE’s innovation pipeline demands close watch.
Which stock offers better returns?
The past year shows distinct dynamics: GE Aerospace’s price surged 129%, decelerating recently, while Lockheed Martin gained 46.5%, accelerating with strong recent momentum.

Trend Comparison
GE Aerospace’s stock rose 129.03% over 12 months, a bullish trend with marked deceleration. The price ranged from 134 to 325, showing high volatility (56.42 std deviation).
Lockheed Martin’s stock increased 46.5%, also bullish but accelerating. Prices moved between 421 and 634, with volatility at 47.89 std deviation, and a strong recent gain of 36.17%.
GE’s return outpaces Lockheed Martin’s significantly, despite slowing recent growth. GE leads in market performance over the analyzed period.
Target Prices
Analysts show a bullish consensus for both GE Aerospace and Lockheed Martin Corporation with solid upside potential.
| Company | Target Low | Target High | Consensus |
|---|---|---|---|
| GE Aerospace | 374 | 387 | 380.33 |
| Lockheed Martin Corporation | 519 | 695 | 607.7 |
The target consensus for GE Aerospace exceeds its current price of 307 by about 24%. Lockheed Martin’s consensus target stands slightly below its current 634, suggesting limited near-term upside.

Don’t Let Luck Decide Your Entry Point
Optimize your entry points with our advanced ProRealTime indicators. You’ll get efficient buy signals with precise price targets for maximum performance. Start outperforming now!
How do institutions grade them?
GE Aerospace Grades
Here are the latest institutional grades from well-known financial firms:
| Grading Company | Action | New Grade | Date |
|---|---|---|---|
| JP Morgan | Maintain | Overweight | 2026-01-26 |
| Citigroup | Maintain | Buy | 2026-01-23 |
| UBS | Maintain | Buy | 2026-01-23 |
| UBS | Maintain | Buy | 2026-01-15 |
| Citigroup | Maintain | Buy | 2026-01-13 |
| JP Morgan | Maintain | Overweight | 2025-10-27 |
| B of A Securities | Maintain | Buy | 2025-10-27 |
| UBS | Maintain | Buy | 2025-10-22 |
| RBC Capital | Maintain | Outperform | 2025-10-22 |
| Barclays | Maintain | Overweight | 2025-07-23 |
Lockheed Martin Corporation Grades
Here are the latest institutional grades from well-known financial firms:
| Grading Company | Action | New Grade | Date |
|---|---|---|---|
| RBC Capital | Maintain | Sector Perform | 2026-01-30 |
| TD Cowen | Maintain | Hold | 2026-01-30 |
| UBS | Maintain | Neutral | 2026-01-15 |
| Citigroup | Maintain | Neutral | 2026-01-13 |
| Jefferies | Maintain | Hold | 2026-01-12 |
| Truist Securities | Upgrade | Buy | 2026-01-09 |
| JP Morgan | Downgrade | Neutral | 2025-12-19 |
| Morgan Stanley | Downgrade | Equal Weight | 2025-12-16 |
| UBS | Maintain | Neutral | 2025-10-22 |
| Bernstein | Maintain | Market Perform | 2025-10-20 |
Which company has the best grades?
GE Aerospace consistently receives Buy and Overweight ratings from top institutions, signaling strong confidence. Lockheed Martin shows mixed Neutral and Hold grades, with some recent downgrades. Investors might view GE’s higher grades as a vote of stronger near-term potential.
Risks specific to each company
The following categories identify the critical pressure points and systemic threats facing both firms in the 2026 market environment:
1. Market & Competition
GE Aerospace
- Faces intense competition in commercial and military jet engines; innovation pace is crucial to maintain market share.
Lockheed Martin Corporation
- Dominates U.S. defense contracts but faces risks from budget cuts and shifting international alliances.
2. Capital Structure & Debt
GE Aerospace
- High debt-to-equity ratio (1.1) signals leverage risk; debt management remains a concern despite solid interest coverage.
Lockheed Martin Corporation
- Maintains low debt-to-equity (0.17), reflecting stronger balance sheet and lower financial risk.
3. Stock Volatility
GE Aerospace
- Beta of 1.403 indicates higher stock volatility, exposing investors to greater market risk.
Lockheed Martin Corporation
- Beta of 0.245 shows low volatility, offering defensive characteristics in turbulent markets.
4. Regulatory & Legal
GE Aerospace
- Subject to regulatory scrutiny in both commercial aviation and defense sectors; compliance costs may rise.
Lockheed Martin Corporation
- Faces complex regulatory environment, especially in international arms sales and classified program oversight.
5. Supply Chain & Operations
GE Aerospace
- Supply chain disruptions could impact engine production; reliance on specialized components increases operational risk.
Lockheed Martin Corporation
- Large-scale operations diversify supply chain risks but complex integration challenges persist across segments.
6. ESG & Climate Transition
GE Aerospace
- Pressure to innovate greener engine technologies amid tightening emissions regulations.
Lockheed Martin Corporation
- Increasing focus on sustainable defense solutions; ESG compliance impacts contract eligibility.
7. Geopolitical Exposure
GE Aerospace
- Global commercial exposure subjects it to geopolitical trade tensions and tariffs.
Lockheed Martin Corporation
- High dependency on U.S. government contracts limits geopolitical risk but exposes it to U.S. foreign policy shifts.
Which company shows a better risk-adjusted profile?
Lockheed Martin faces fewer leverage and volatility risks, with a robust capital structure and stable earnings. GE Aerospace’s high debt and stock volatility raise red flags. Lockheed’s favorable Altman Z-Score (3.69 vs. GE’s 3.33) and stronger Piotroski score confirm better financial health. GE’s most impactful risk is financial leverage. Lockheed’s is geopolitical dependency on U.S. defense spending. Lockheed Martin’s more balanced risk profile makes it a safer choice amid 2026 uncertainties.
Final Verdict: Which stock to choose?
GE Aerospace’s superpower lies in its impressive earnings momentum and operational efficiency, demonstrated by a soaring return on equity and strong income growth. However, its high valuation multiples and modest liquidity ratios are points of vigilance. It suits investors with an appetite for aggressive growth willing to navigate valuation risks.
Lockheed Martin commands a strategic moat through exceptional capital efficiency and robust free cash flow generation. Its conservative leverage and consistent dividend yield offer a safety buffer compared to GE Aerospace. This stock fits well within a GARP portfolio seeking steady growth with reasonable risk exposure.
If you prioritize aggressive growth and can tolerate valuation premiums, GE Aerospace is the compelling choice due to its accelerating profitability and operational improvements. However, if you seek a blend of value and growth with better financial stability, Lockheed Martin offers superior capital discipline and income reliability, albeit with a more tempered growth outlook.
Disclaimer: Investment carries a risk of loss of initial capital. The past performance is not a reliable indicator of future results. Be sure to understand risks before making an investment decision.
Go Further
I encourage you to read the complete analyses of GE Aerospace and Lockheed Martin Corporation to enhance your investment decisions: