Home > Comparison > Industrials > GE vs LHX
The strategic rivalry between GE Aerospace and L3Harris Technologies defines the current trajectory of the aerospace & defense sector. GE Aerospace operates as a capital-intensive industrial giant focused on jet engines and propulsion systems. In contrast, L3Harris emphasizes advanced mission-critical technology and integrated defense solutions. This analysis will determine which company’s operational model offers a superior risk-adjusted return for diversified portfolios navigating this complex industry landscape.

Table of contents
Companies Overview
GE Aerospace and L3Harris Technologies, Inc. both hold pivotal roles in the aerospace and defense market, shaping industry innovation and security.
GE Aerospace: Engine Powerhouse with Integrated Systems
GE Aerospace commands a leading position in aircraft engines and integrated systems. Its revenue stems chiefly from commercial and military jet engine design, manufacturing, and servicing. In 2026, the company sharpens its focus on advancing propulsion technologies and expanding its Commercial Engines & Services and Defense & Propulsion segments.
L3Harris Technologies, Inc.: Mission-Critical Solutions Leader
L3Harris Technologies excels in aerospace and defense technology, generating revenue through intelligence, surveillance, reconnaissance (ISR) systems, tactical communications, and avionics. Its 2026 strategy centers on enhancing multi-domain mission systems and expanding secure communications for government and commercial clients worldwide.
Strategic Collision: Similarities & Divergences
Both firms emphasize aerospace and defense but diverge in approach: GE Aerospace specializes in propulsion and engine systems, while L3Harris leads in integrated mission and communication technologies. Their primary battleground is government and commercial defense contracts. GE offers a capital-intensive manufacturing profile; L3Harris delivers technology-driven solutions, defining distinct investment risk and return profiles.
Income Statement Comparison
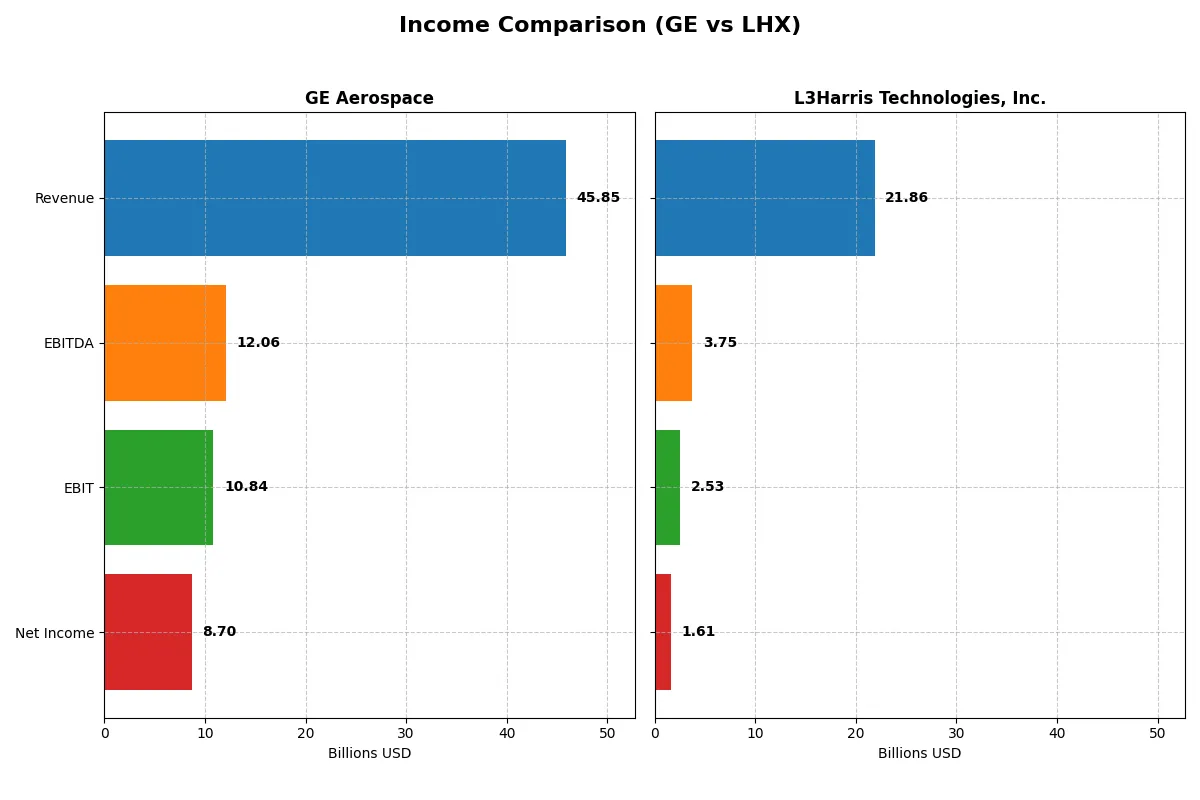
This data dissects the core profitability and scalability of both corporate engines to reveal who dominates the bottom line:
| Metric | GE Aerospace (GE) | L3Harris Technologies, Inc. (LHX) |
|---|---|---|
| Revenue | 45.9B | 21.9B |
| Cost of Revenue | 28.97B | 16.24B |
| Operating Expenses | 8.12B | 3.43B |
| Gross Profit | 16.89B | 5.63B |
| EBITDA | 12.06B | 3.75B |
| EBIT | 10.84B | 2.53B |
| Interest Expense | 843M | 597M |
| Net Income | 8.70B | 1.61B |
| EPS | 8.16 | 8.57 |
| Fiscal Year | 2025 | 2025 |
Income Statement Analysis: The Bottom-Line Duel
This income statement comparison reveals how efficiently GE Aerospace and L3Harris Technologies power their profit engines under current market conditions.
GE Aerospace Analysis
GE Aerospace steadily built revenue from $29.1B in 2022 to $45.9B in 2025, with net income surging from $336M to $8.7B. Its gross margin holds strong near 37%, while net margin climbs to 19%, signaling robust cost control. In 2025, GE’s momentum accelerates, posting 18.5% revenue growth and a 36% EPS jump, reflecting operational efficiency and margin expansion.
L3Harris Technologies Analysis
L3Harris grew revenue from $17.1B in 2022 to $21.9B in 2025, though net income slipped from $1.06B to $1.61B, with net margin at a modest 7.4%. Gross margin improved to 25.7%, but revenue growth slowed to just 2.5% in 2025. Despite EBIT growth of 11%, L3Harris faces margin pressure and uneven bottom-line results, indicating tighter cost dynamics.
Margin Strength vs. Revenue Expansion
GE Aerospace dominates with superior margin expansion and impressive net income growth, translating revenue gains into profit powerfully. L3Harris shows respectable scale growth but weaker margin leverage and volatile net income. For investors prioritizing operational efficiency and profitability, GE’s profile offers clearer fundamental strength and momentum.
Financial Ratios Comparison
These vital ratios act as a diagnostic tool to expose the underlying fiscal health, valuation premiums, and capital efficiency of the companies compared below:
| Ratios | GE Aerospace (GE) | L3Harris Technologies, Inc. (LHX) |
|---|---|---|
| ROE | 46.6% | 8.2% |
| ROIC | 8.1% | 5.4% |
| P/E | 37.8 | 34.3 |
| P/B | 17.6 | 2.8 |
| Current Ratio | 1.04 | 1.19 |
| Quick Ratio | 0.74 | 1.02 |
| D/E | 1.10 | 0.53 |
| Debt-to-Assets | 15.7% | 25.4% |
| Interest Coverage | 10.4 | 3.7 |
| Asset Turnover | 0.35 | 0.53 |
| Fixed Asset Turnover | 5.74 | 8.20 |
| Payout Ratio | 16.7% | 56.2% |
| Dividend Yield | 0.44% | 1.64% |
| Fiscal Year | 2025 | 2025 |
Efficiency & Valuation Duel: The Vital Signs
Financial ratios serve as a company’s DNA, unveiling hidden risks and operational strengths that raw numbers alone cannot reveal.
GE Aerospace
GE Aerospace delivers a powerful 46.6% ROE and a strong 19% net margin, signaling robust profitability. However, its valuation appears stretched with a P/E of 37.8 and a high P/B of 17.6. The dividend yield is modest at 0.44%, indicating limited shareholder payouts, possibly favoring reinvestment for growth or R&D.
L3Harris Technologies, Inc.
L3Harris posts a moderate 8.2% ROE and a 7.4% net margin, reflecting steady but less aggressive profitability. Its P/E of 34.3 is still high but slightly more reasonable than GE’s. The company offers a higher dividend yield of 1.64%, balancing shareholder returns with prudent capital allocation and a solid quick ratio of 1.02.
Premium Valuation vs. Operational Safety
GE Aerospace trades at a premium with superior profitability but faces valuation and liquidity concerns. L3Harris offers a more balanced profile, with moderate returns and a healthier liquidity base. Investors seeking growth might prefer GE’s aggressive stance, while those favoring stability may align better with L3Harris.
Which one offers the Superior Shareholder Reward?
I find L3Harris (LHX) delivers superior shareholder reward compared to GE Aerospace. LHX yields 1.64% with a higher payout ratio near 56%, supported by robust free cash flow coverage (~86%). GE’s yield lags at 0.44% and payout ratio at 17%, signaling more retained capital. Both companies engage in consistent buybacks, but LHX’s free cash flow per share ($14.3) significantly outpaces GE’s ($6.8), fueling sustainable distributions. LHX’s balance of dividends and aggressive buybacks aligns with stronger total return potential in 2026. GE’s conservative payout and lower yield may appeal to risk-averse investors but limit immediate income. For total return seekers, LHX’s distribution model is more compelling and sustainable.
Comparative Score Analysis: The Strategic Profile
The radar chart reveals the fundamental DNA and trade-offs of GE Aerospace and L3Harris Technologies, Inc., highlighting their distinct financial strengths and valuation approaches:
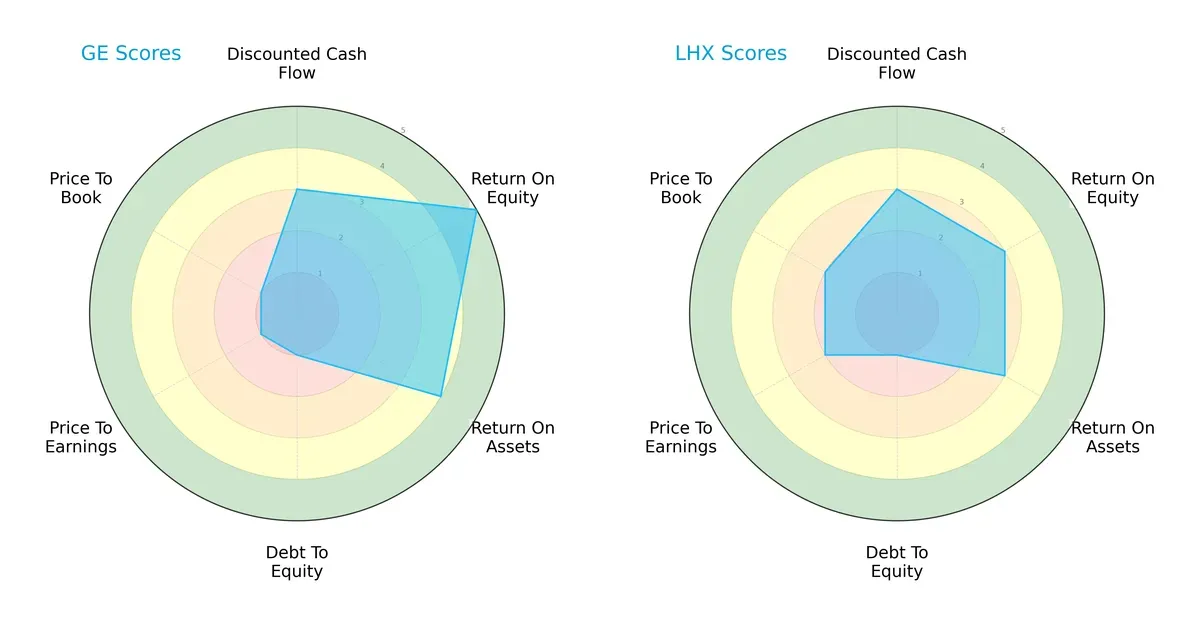
GE Aerospace posts a higher efficiency with very favorable ROE (5) and favorable ROA (4) scores, but suffers from very unfavorable debt-to-equity (1) and valuation metrics (PE and PB scores at 1). L3Harris shows a more moderate but balanced profile with consistent moderate scores across ROE (3), ROA (3), and valuation (PE 2, PB 2). GE relies heavily on profitability metrics but struggles with leverage and valuation, while L3Harris offers steadier financial stability but less profitability punch.
Bankruptcy Risk: Solvency Showdown
The Altman Z-Score delta positions GE Aerospace comfortably in the safe zone, while L3Harris lingers in the grey zone, signaling differing resilience:
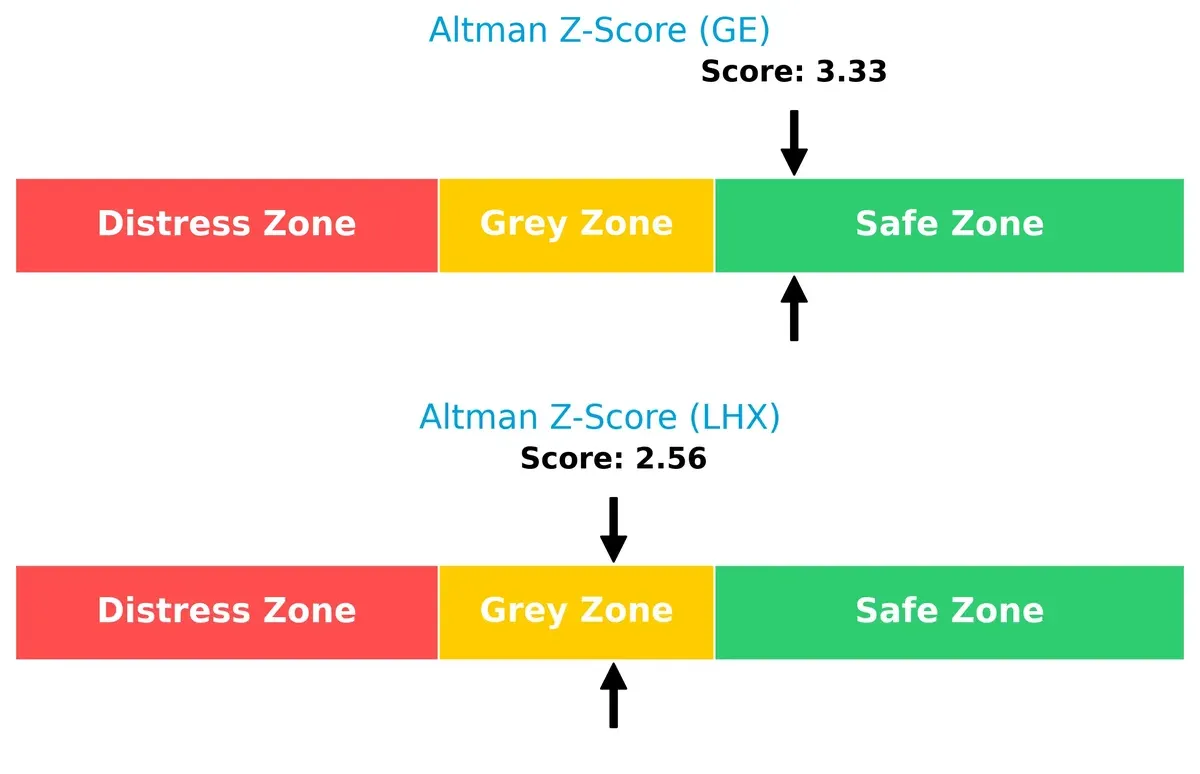
GE’s Z-score above 3.3 indicates robust long-term solvency, reducing bankruptcy risk in this volatile cycle. L3Harris’s 2.56 score, although not alarming, suggests moderate financial stress and a higher likelihood of distress under adverse conditions.
Financial Health: Quality of Operations
Piotroski F-Scores reveal a stark contrast in operational quality and internal financial health between the two firms:
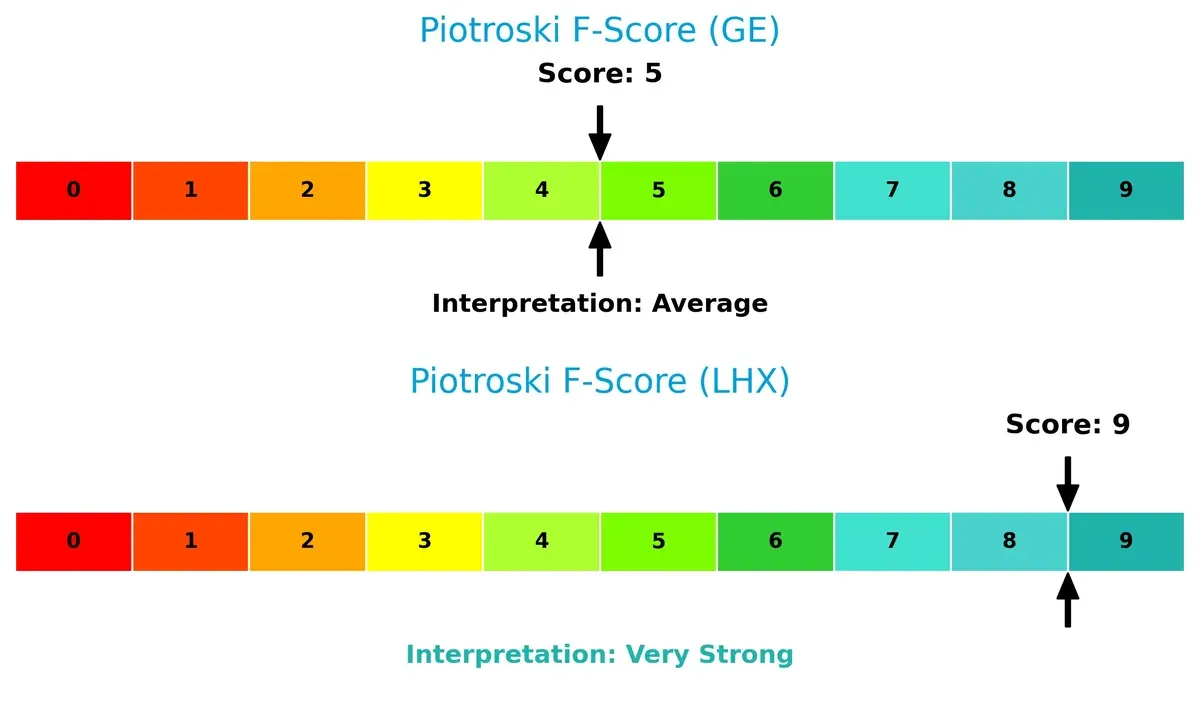
L3Harris scores a very strong 9, signaling excellent financial health and operational efficiency. GE’s average 5 raises caution about internal weaknesses and uneven fundamentals, warranting close monitoring for red flags in profitability or liquidity.
How are the two companies positioned?
This section dissects GE Aerospace and L3Harris’s operational DNA by comparing revenue distribution and internal strengths and weaknesses. The goal is to confront their economic moats and identify which model offers the most resilient, sustainable competitive advantage today.
Revenue Segmentation: The Strategic Mix
This visual comparison dissects how GE Aerospace and L3Harris diversify their income streams and where their primary sector bets lie:
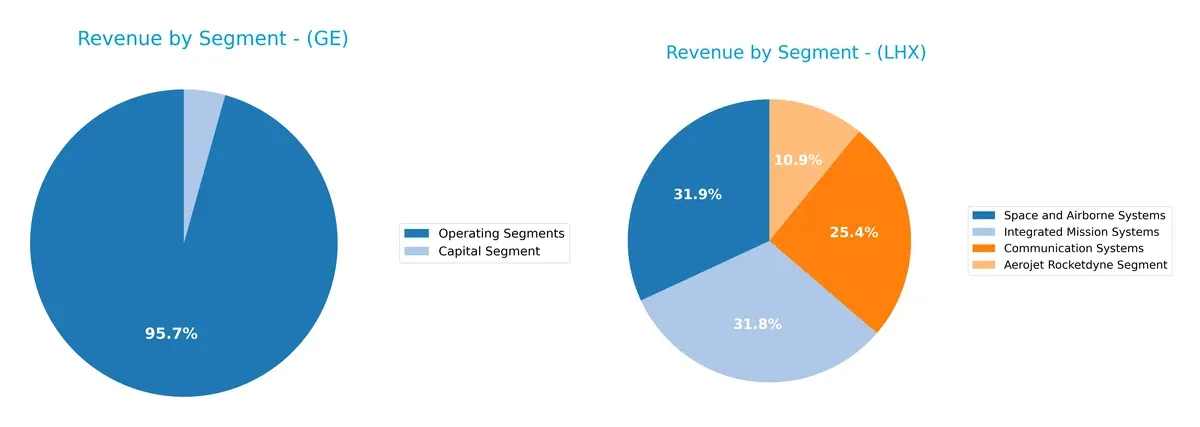
GE Aerospace anchors its revenue in Aerospace at $31.8B, with significant contributions from Power ($17.7B) and Renewable Energy ($15.1B). L3Harris spreads revenue more evenly across Communication Systems ($5.5B), Integrated Mission Systems ($6.8B), and Space and Airborne Systems ($6.9B). GE’s concentration in aerospace shows infrastructure dominance but heightens sector risk. L3Harris’s balanced mix reduces dependence on any single segment, offering resilience amid defense spending shifts.
Strengths and Weaknesses Comparison
This table compares the Strengths and Weaknesses of GE Aerospace and L3Harris Technologies, Inc.:
GE Aerospace Strengths
- Strong profitability with 18.98% net margin and 46.6% ROE
- Favorable debt-to-assets ratio at 15.74%
- High fixed asset turnover at 5.74
- Significant global presence with diversified revenue across Americas, Asia, Europe, and Middle East
- Diverse operating segments including aerospace, power, and renewable energy
L3Harris Technologies Strengths
- Favorable WACC at 6.65% indicating efficient capital cost management
- Solid quick ratio at 1.02 showing good liquidity
- Favorable fixed asset turnover at 8.2
- Diversified segments including communication, mission systems, and aerospace propulsion
- Lower overall debt levels with D/E at 0.53
GE Aerospace Weaknesses
- Unfavorable valuation metrics with P/E at 37.76 and P/B at 17.6
- Lower quick ratio at 0.74 indicating liquidity risk
- High debt-to-equity ratio at 1.1
- Asset turnover low at 0.35, suggesting inefficiencies
- Dividend yield low at 0.44%
L3Harris Technologies Weaknesses
- Lower profitability with 7.35% net margin and 8.18% ROE
- Neutral to unfavorable valuation with P/E at 34.26 and P/B at 2.8
- Interest coverage moderate at 4.24
- Net margin and ROIC only neutral or unfavorable
Both companies show diversified operations and global reach, but GE Aerospace leads in profitability and global scale. L3Harris demonstrates stronger liquidity and capital efficiency but lags in profitability. These strengths and weaknesses highlight distinct strategic priorities for each firm.
The Moat Duel: Analyzing Competitive Defensibility
A structural moat is the only thing protecting long-term profits from the erosion of competition. Let’s dissect how GE Aerospace and L3Harris Technologies defend their turf:
GE Aerospace: Engineered Scale and Intangible Assets
GE Aerospace leverages its vast scale and deep intangible assets in jet engine technology. This shows in its robust 23.65% EBIT margin and margin stability. New defense contracts and expanding commercial engine services in Asia could further deepen this moat in 2026.
L3Harris Technologies, Inc.: Integrated Mission Systems Excellence
L3Harris relies on integrated mission systems and specialized ISR technology, differing from GE’s broader scale. Despite lower margins (11.57% EBIT), it actively innovates in cyber defense and space payloads. However, a declining ROIC signals pressure on its competitive edge.
Scale Dominance vs. Specialized Systems: Who Holds the Moat Deeper?
GE Aerospace’s scale and growing profitability create a wider moat than L3Harris’s specialized but shrinking returns. GE’s expanding global footprint better equips it to defend market share in 2026.
Which stock offers better returns?
Over the past year, both GE Aerospace and L3Harris Technologies, Inc. showed significant price appreciation, with distinct trading dynamics and volume trends shaping their market performance.
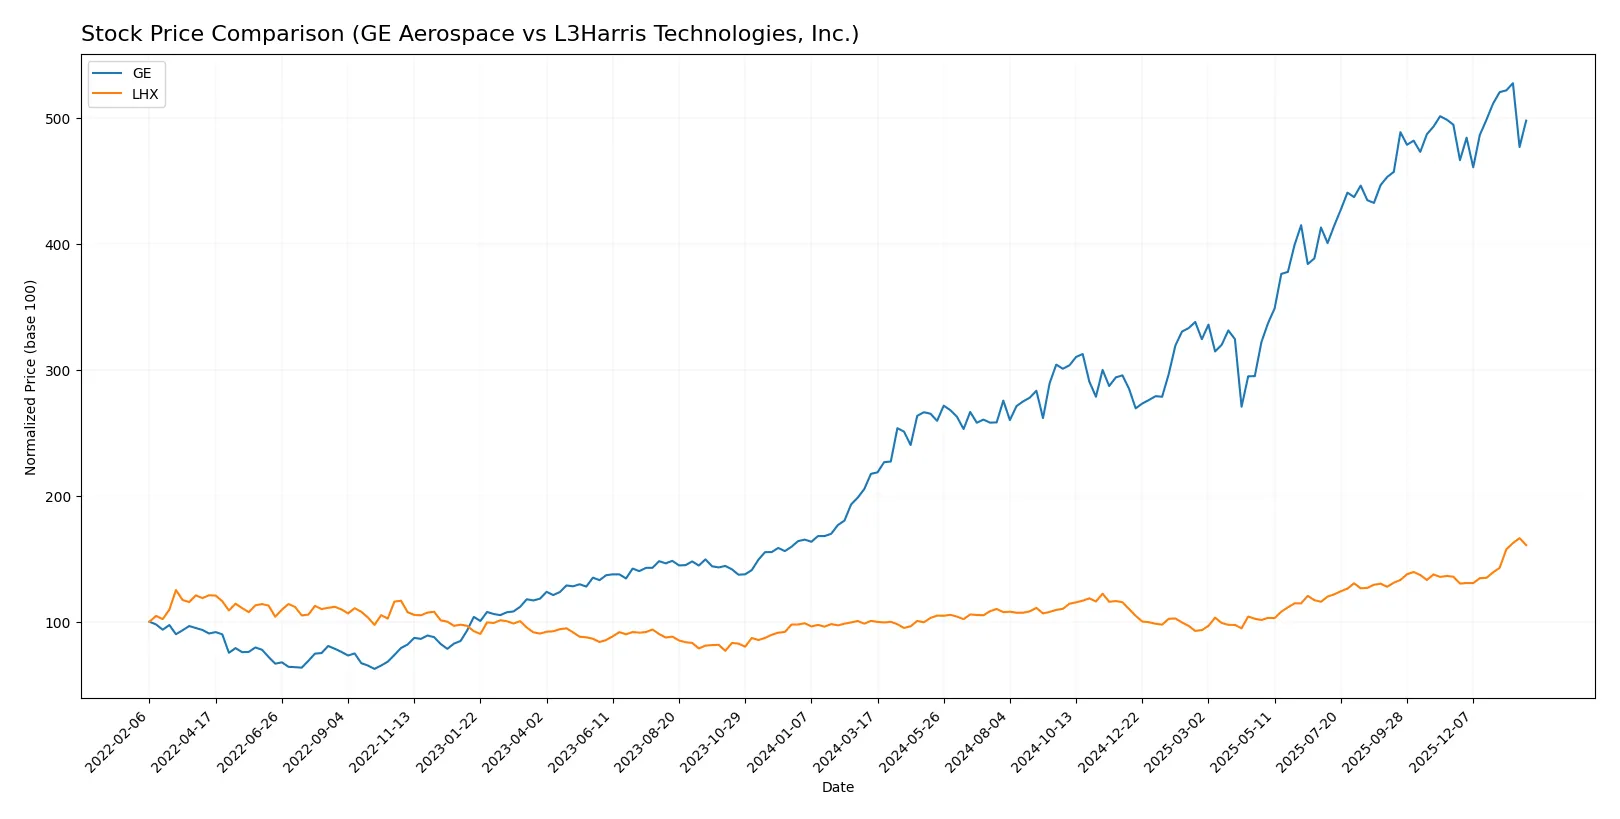
Trend Comparison
GE Aerospace’s stock rose 129.03% over the past 12 months, marking a bullish trend with decelerating momentum. Its price ranged between 134 and 325, showing high volatility (56.42 std deviation).
L3Harris Technologies gained 59.76% over the same period, also bullish but with accelerating momentum. The price fluctuated from 198 to 355, with moderate volatility (35.05 std deviation).
Between the two, GE Aerospace delivered the highest market performance, doubling L3Harris’s return despite slowing acceleration.
Target Prices
Analysts project solid upside potential for both GE Aerospace and L3Harris Technologies, signaling confidence in their aerospace & defense growth prospects.
| Company | Target Low | Target High | Consensus |
|---|---|---|---|
| GE Aerospace | 374 | 387 | 380.33 |
| L3Harris Technologies, Inc. | 323 | 367 | 352.25 |
The consensus targets for GE Aerospace and L3Harris exceed current prices by roughly 24% and 3% respectively, indicating more bullish sentiment on GE’s valuation.

Don’t Let Luck Decide Your Entry Point
Optimize your entry points with our advanced ProRealTime indicators. You’ll get efficient buy signals with precise price targets for maximum performance. Start outperforming now!
How do institutions grade them?
GE Aerospace Grades
The following table summarizes recent grades from reputable financial institutions for GE Aerospace:
| Grading Company | Action | New Grade | Date |
|---|---|---|---|
| JP Morgan | Maintain | Overweight | 2026-01-26 |
| Citigroup | Maintain | Buy | 2026-01-23 |
| UBS | Maintain | Buy | 2026-01-23 |
| UBS | Maintain | Buy | 2026-01-15 |
| Citigroup | Maintain | Buy | 2026-01-13 |
| JP Morgan | Maintain | Overweight | 2025-10-27 |
| B of A Securities | Maintain | Buy | 2025-10-27 |
| UBS | Maintain | Buy | 2025-10-22 |
| RBC Capital | Maintain | Outperform | 2025-10-22 |
| Barclays | Maintain | Overweight | 2025-07-23 |
L3Harris Technologies, Inc. Grades
The following table provides recent grades from established grading firms for L3Harris Technologies, Inc.:
| Grading Company | Action | New Grade | Date |
|---|---|---|---|
| RBC Capital | Maintain | Sector Perform | 2026-01-30 |
| UBS | Maintain | Neutral | 2026-01-15 |
| RBC Capital | Maintain | Sector Perform | 2026-01-14 |
| Citigroup | Maintain | Buy | 2026-01-13 |
| Morgan Stanley | Upgrade | Overweight | 2025-12-16 |
| JP Morgan | Maintain | Overweight | 2025-11-04 |
| UBS | Maintain | Neutral | 2025-10-31 |
| Truist Securities | Maintain | Buy | 2025-10-15 |
| Morgan Stanley | Maintain | Equal Weight | 2025-10-15 |
| Barclays | Maintain | Overweight | 2025-07-29 |
Which company has the best grades?
GE Aerospace holds consistently higher and more positive grades, including multiple “Buy” and “Overweight” ratings, plus an “Outperform” grade. L3Harris shows more mixed grades, with several “Neutral” and “Sector Perform” ratings. Investors may interpret GE’s stronger consensus as greater confidence from analysts.
Risks specific to each company
The following categories identify critical pressure points and systemic threats facing GE Aerospace and L3Harris Technologies, Inc. in the 2026 market environment:
1. Market & Competition
GE Aerospace
- Faces intense competition in commercial and military aerospace segments amid slowing commercial airframe demand.
L3Harris Technologies, Inc.
- Operates in niche defense tech markets with diversified ISR and communications offerings, but faces pressure from evolving tech and government budgets.
2. Capital Structure & Debt
GE Aerospace
- High debt-to-equity ratio (1.1) signals leverage risk despite favorable interest coverage.
L3Harris Technologies, Inc.
- Moderate leverage (de 0.53) with stronger debt-to-assets ratio; overall capital structure is more conservative.
3. Stock Volatility
GE Aerospace
- Elevated beta (1.40) indicates higher stock price volatility and market sensitivity.
L3Harris Technologies, Inc.
- Lower beta (0.66) suggests more stable stock performance relative to market swings.
4. Regulatory & Legal
GE Aerospace
- Subject to stringent aerospace safety and export controls; potential delays from regulatory approvals.
L3Harris Technologies, Inc.
- Faces complex defense contracting regulations and cybersecurity compliance risks.
5. Supply Chain & Operations
GE Aerospace
- Vulnerable to raw material price fluctuations and supply disruptions impacting engine production.
L3Harris Technologies, Inc.
- Complex supply chains for advanced electronics face risks from component shortages and geopolitical tensions.
6. ESG & Climate Transition
GE Aerospace
- Pressure to develop greener propulsion systems amid rising climate regulation and stakeholder demands.
L3Harris Technologies, Inc.
- ESG risks lower but increasing focus on sustainable defense technologies and emissions from operations.
7. Geopolitical Exposure
GE Aerospace
- Global sales exposed to trade tensions and export restrictions, especially with key commercial markets.
L3Harris Technologies, Inc.
- Heavily dependent on U.S. government contracts; geopolitical shifts could impact defense spending and alliances.
Which company shows a better risk-adjusted profile?
L3Harris Technologies faces moderate operational and regulatory risks but benefits from a more conservative capital structure and lower stock volatility. GE Aerospace bears higher leverage and market sensitivity, with significant exposure to cyclical commercial aerospace demand. L3Harris’s stronger Piotroski score (9 vs. 5) and safer Altman Z-Score zone (grey vs. safe) reflect better financial resilience. However, GE’s stronger profitability metrics warrant attention. The primary risk for GE is its high leverage amid sector cyclicality; for L3Harris, it is geopolitical dependence on U.S. defense budgets. Given these factors, L3Harris presents a more balanced risk-adjusted profile in 2026.
Final Verdict: Which stock to choose?
GE Aerospace’s superpower lies in its robust profitability and impressive return on equity, signaling efficient capital use despite a challenging capital structure. Its point of vigilance is the stretched valuation and moderate liquidity, which could pressure risk-sensitive investors. GE fits aggressive growth portfolios seeking turnaround stories with improving margins.
L3Harris Technologies commands a strategic moat through solid operational efficiency and stable cash flow generation, supported by a conservative balance sheet. While its profitability metrics trail GE’s, L3Harris offers a safer profile with less valuation risk. It suits GARP investors looking for steady growth at a reasonable price.
If you prioritize high-margin expansion and are comfortable with valuation premiums, GE Aerospace outshines with its accelerating profitability and market momentum. However, if you seek better stability and a more balanced risk-reward profile, L3Harris offers superior financial discipline and operational resilience. Each presents a distinct scenario aligned with different investor risk tolerances and growth expectations.
Disclaimer: Investment carries a risk of loss of initial capital. The past performance is not a reliable indicator of future results. Be sure to understand risks before making an investment decision.
Go Further
I encourage you to read the complete analyses of GE Aerospace and L3Harris Technologies, Inc. to enhance your investment decisions: