Home > Comparison > Industrials > GE vs HII
The strategic rivalry between GE Aerospace and Huntington Ingalls Industries defines the current trajectory of the aerospace and defense sector. GE Aerospace operates as a diversified industrial powerhouse focused on jet engines and integrated aircraft systems, while Huntington Ingalls specializes in highly technical military shipbuilding and sustainment. This analysis pits industrial scale against niche expertise to reveal which business model offers a superior risk-adjusted return for a diversified portfolio in 2026.
Table of contents
Companies Overview
GE Aerospace and Huntington Ingalls Industries, Inc. hold pivotal roles in the U.S. aerospace and defense sectors, shaping military and commercial capabilities.
GE Aerospace: Powering Flight Innovation
GE Aerospace dominates the aerospace engine market by designing and servicing jet and turboprop engines for commercial and military aircraft. Its revenue stems from integrated engine systems and aftermarket services. In 2026, the company focuses strategically on expanding its Commercial Engines & Services segment while advancing Defense & Propulsion Technologies to maintain technological leadership.
Huntington Ingalls Industries, Inc.: Naval Defense Backbone
Huntington Ingalls Industries specializes in designing and constructing military ships, including nuclear-powered carriers and submarines. It earns revenue through shipbuilding, repair, and lifecycle sustainment for the U.S. Navy and Coast Guard. The firm’s 2026 strategy emphasizes sustaining its shipbuilding dominance and expanding technical solutions for defense and federal clients.
Strategic Collision: Similarities & Divergences
Both companies serve defense markets but diverge sharply in focus—GE Aerospace excels in propulsion and engine systems, while Huntington Ingalls centers on naval vessel construction. They compete indirectly across defense budgets but battle for dominance in military innovation and sustainment. Their distinct investment profiles reflect this contrast: GE leans on broad aerospace innovation, Huntington Ingalls on specialized shipbuilding expertise.
Income Statement Comparison
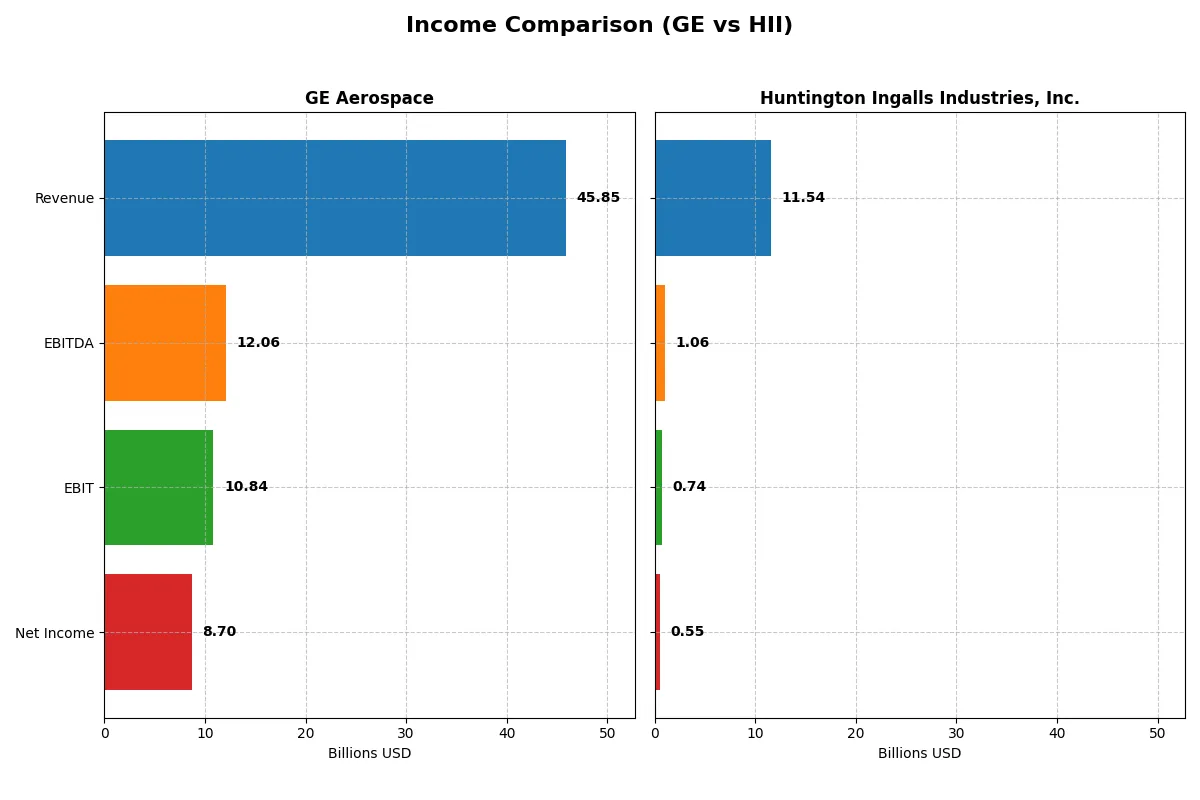
This data dissects the core profitability and scalability of both corporate engines to reveal who dominates the bottom line:
| Metric | GE Aerospace (GE) | Huntington Ingalls Industries, Inc. (HII) |
|---|---|---|
| Revenue | 45.9B | 11.5B |
| Cost of Revenue | 28.97B | 10.09B |
| Operating Expenses | 8.12B | 915M |
| Gross Profit | 16.89B | 1.45B |
| EBITDA | 12.06B | 1.06B |
| EBIT | 10.84B | 738M |
| Interest Expense | 843M | 95M |
| Net Income | 8.70B | 550M |
| EPS | 8.16 | 13.96 |
| Fiscal Year | 2025 | 2024 |
Income Statement Analysis: The Bottom-Line Duel
This income statement comparison reveals which company converts revenue into profit most efficiently and sustainably.
GE Aerospace Analysis
GE Aerospace’s revenue rose sharply from $35B in 2023 to $46B in 2025, with net income surging from $9.2B to $8.7B, showing strong profitability despite some volatility. Gross margin holds steady near 37%, and net margin improved to 19%, reflecting disciplined cost control and operational leverage. The 2025 performance signals robust momentum and expanding margins.
Huntington Ingalls Industries, Inc. Analysis
Huntington Ingalls Industries shows modest revenue growth, reaching $11.5B in 2024 from $9.5B in 2021, but net income declined to $550M in 2024 from $696M in 2020. Gross margin contracts to 12.6%, with net margin weakening to under 5%, indicating margin pressure and less operational efficiency. The recent year reveals slowing momentum and margin compression.
Margin Strength vs. Growth Trajectory
GE Aerospace clearly outperforms Huntington Ingalls in margin quality and profitability growth. GE’s robust 19% net margin and strong earnings momentum contrast with Huntington’s shrinking net margin below 5%. Investors seeking operational efficiency and profit expansion will find GE’s profile more attractive than Huntington’s subdued and margin-challenged earnings.
Financial Ratios Comparison
These vital ratios act as a diagnostic tool to expose the underlying fiscal health, valuation premiums, and capital efficiency of the companies analyzed:
| Ratios | GE Aerospace (GE) | Huntington Ingalls Industries, Inc. (HII) |
|---|---|---|
| ROE | 46.6% | 11.8% |
| ROIC | 8.1% | 4.7% |
| P/E | 37.8 | 13.5 |
| P/B | 17.6 | 1.60 |
| Current Ratio | 1.04 | 1.08 |
| Quick Ratio | 0.74 | 1.01 |
| D/E (Debt-to-Equity) | 1.10 | 0.73 |
| Debt-to-Assets | 15.7% | 28.1% |
| Interest Coverage | 10.4 | 5.63 |
| Asset Turnover | 0.35 | 0.95 |
| Fixed Asset Turnover | 5.74 | 3.13 |
| Payout ratio | 16.7% | 37.5% |
| Dividend yield | 0.44% | 2.77% |
| Fiscal Year | 2025 | 2024 |
Efficiency & Valuation Duel: The Vital Signs
Financial ratios act as a company’s DNA, unlocking insights into hidden risks and operational efficiency that raw numbers alone cannot reveal.
GE Aerospace
GE Aerospace delivers a powerful 46.6% ROE with a strong 19% net margin, showcasing robust profitability. However, its elevated P/E of 37.8 and P/B of 17.6 mark the stock as expensive and stretched. Dividend yield lags at 0.44%, signaling limited shareholder payout, likely favoring reinvestment in growth and R&D.
Huntington Ingalls Industries, Inc.
HII posts moderate profitability with an 11.8% ROE and a modest 4.8% net margin, reflecting operational challenges. Its P/E of 13.5 and P/B of 1.6 position it as reasonably valued and efficient. A healthy 2.77% dividend yield rewards shareholders, highlighting a balanced capital allocation between income and growth.
Premium Valuation vs. Operational Safety
GE Aerospace commands a premium valuation backed by exceptional profitability but risks overvaluation. HII offers a more conservative profile with fair valuation and steady dividends. Investors seeking growth may lean toward GE; those prioritizing risk management and income might prefer HII.
Which one offers the Superior Shareholder Reward?
I compare GE Aerospace and Huntington Ingalls Industries, Inc. on dividends, payout ratios, and buybacks. GE Aerospace yields 0.44% with a 16.7% payout ratio, signaling conservative dividend use supported by 85% FCF coverage. Its buybacks are moderate but consistent. Huntington Ingalls yields 2.77%, with a higher 37.5% payout, but free cash flow coverage is weak at 6.6%, suggesting dividend risk. HII’s buybacks are less intense, focusing more on dividends. GE’s balanced approach, combining modest dividends with strong cash flow and measured buybacks, offers more sustainable total shareholder return in 2026. I see GE Aerospace as the superior investment for patient investors seeking long-term value and risk control.
Comparative Score Analysis: The Strategic Profile
The radar chart reveals the fundamental DNA and trade-offs of GE Aerospace and Huntington Ingalls Industries, Inc., highlighting their strategic strengths and vulnerabilities:
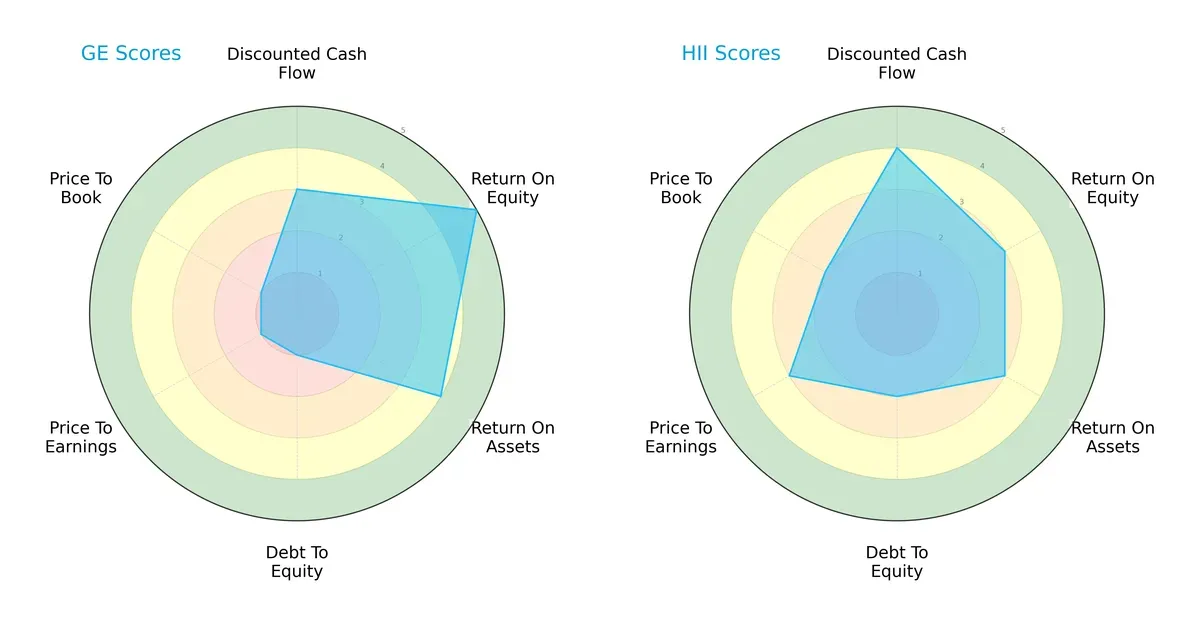
GE Aerospace excels in profitability with top ROE (5) and ROA (4) scores but suffers from heavy leverage and valuation concerns, scoring very unfavorably in debt-to-equity (1), P/E (1), and P/B (1). Huntington Ingalls offers a more balanced profile with moderate scores across DCF (4), ROE (3), ROA (3), and improved debt-to-equity (2) and valuation metrics (P/E 3, P/B 2). I see GE relying heavily on operational efficiency while Huntington Ingalls maintains steadier financial stability and valuation discipline.
Bankruptcy Risk: Solvency Showdown
The Altman Z-Scores for both companies place them safely above the distress threshold, indicating solid long-term survival prospects in this cycle:
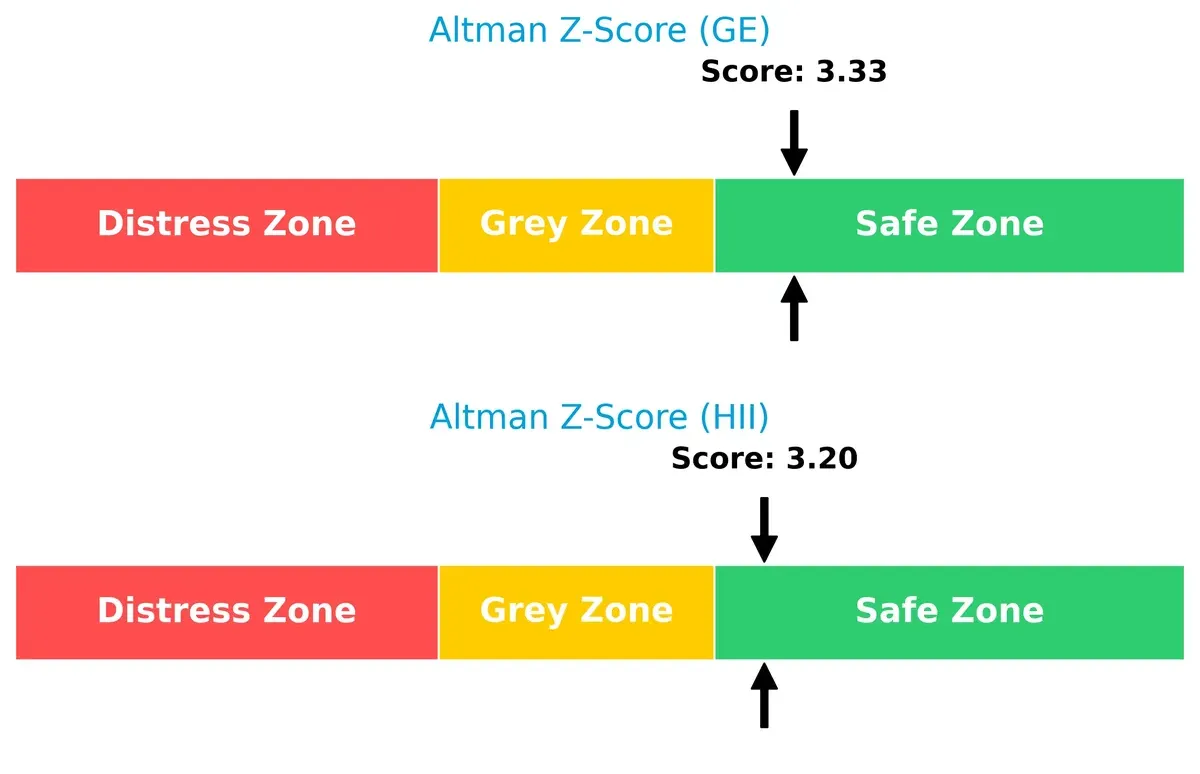
GE Aerospace posts a slightly higher Z-Score at 3.33, reflecting marginally better financial stability than Huntington Ingalls, which scores 3.20. Both firms reside comfortably in the safe zone, signaling low bankruptcy risk despite sector cyclicality.
Financial Health: Quality of Operations
Huntington Ingalls outperforms GE Aerospace on the Piotroski F-Score, signaling stronger operational quality and fewer internal red flags:
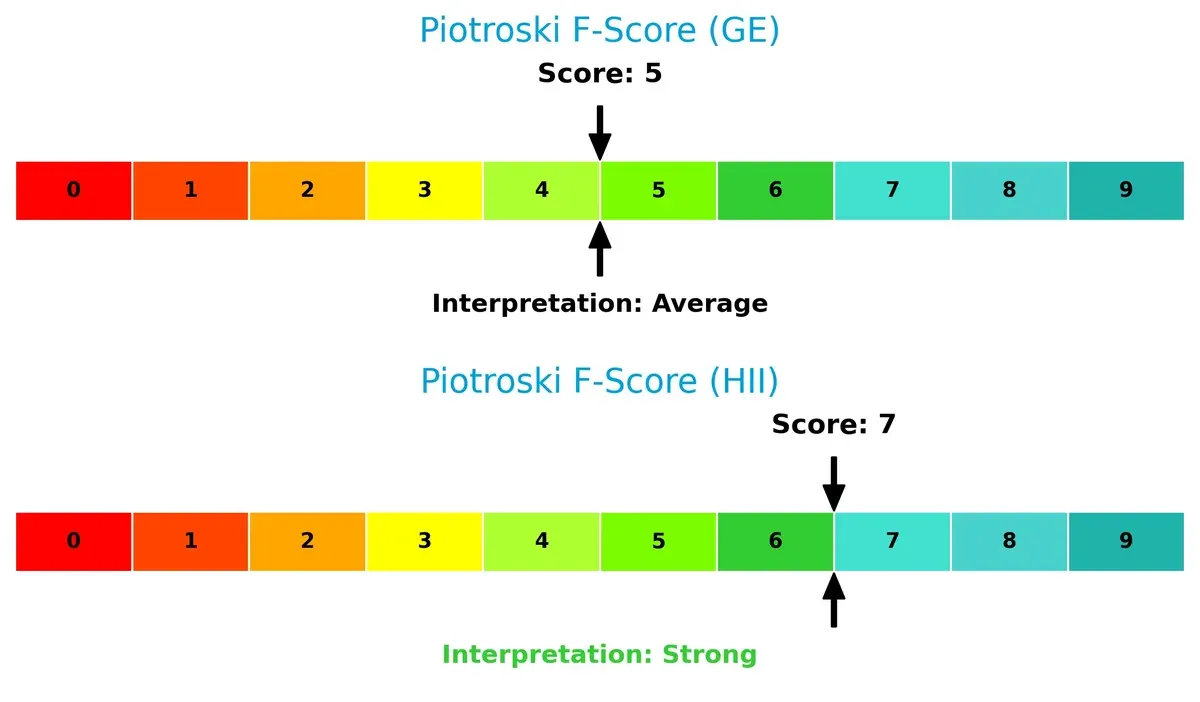
With a Piotroski score of 7 versus GE’s 5, Huntington Ingalls shows better profitability, leverage, and liquidity metrics. GE’s average score suggests caution, as it may face operational or financial weaknesses compared to its peer. Investors should weigh these nuances when evaluating resilience and value stability.
How are the two companies positioned?
This section dissects the operational DNA of GE and HII by comparing their revenue distribution and internal dynamics. The goal is to confront their economic moats to reveal which offers the most resilient and sustainable competitive advantage today.
Revenue Segmentation: The Strategic Mix
The following visual comparison dissects how GE Aerospace and Huntington Ingalls Industries diversify their income streams and where their primary sector bets lie:
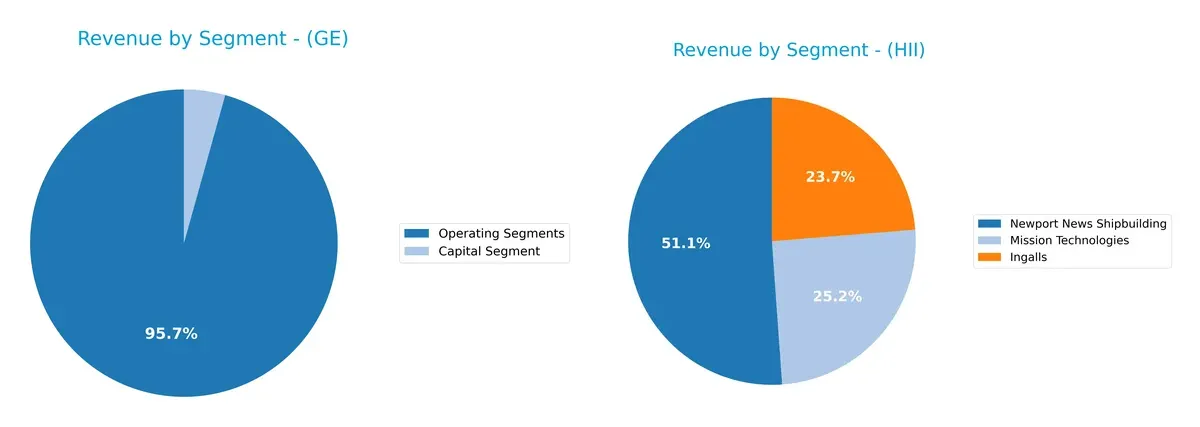
GE Aerospace showcases a broad revenue base with key segments like Aerospace at $31.8B, Power at $17.7B, and Renewable Energy at $15.1B, signaling a diversified portfolio. Huntington Ingalls, however, anchors its revenue heavily on Newport News Shipbuilding at $6B, with Ingalls and Mission Technologies contributing $2.8B and $2.9B respectively. GE’s diversification reduces concentration risk, while HII’s reliance on shipbuilding highlights infrastructure dominance but elevates exposure to defense budget cycles.
Strengths and Weaknesses Comparison
This table compares the Strengths and Weaknesses of GE Aerospace and Huntington Ingalls Industries, Inc.:
GE Aerospace Strengths
- High net margin at 19%
- Strong ROE at 46.6%
- Favorable debt-to-assets ratio at 15.74%
- Robust interest coverage at 12.86x
- Diverse global presence with significant U.S. and Non-U.S. revenue
- High fixed asset turnover at 5.74
Huntington Ingalls Industries, Inc. Strengths
- Favorable weighted average cost of capital at 5.07%
- Attractive PE ratio at 13.54
- Strong quick ratio at 1.01
- Healthy dividend yield at 2.77%
- Favorable debt-to-assets ratio at 28.07%
- Good interest coverage at 7.77x
- Balanced revenue from multiple segments
GE Aerospace Weaknesses
- Unfavorable PE and PB ratios indicating potential overvaluation
- Low quick ratio at 0.74
- High debt-to-equity at 1.1
- Unfavorable asset turnover at 0.35
- Dividend yield weak at 0.44%
- Mixed ROIC vs WACC with neutral status
Huntington Ingalls Industries, Inc. Weaknesses
- Low net margin at 4.77%
- Unfavorable ROIC at 4.74%
- Neutral debt-to-equity at 0.73
- Neutral asset turnover at 0.95
- Lower ROE at 11.79% compared to GE
Overall, GE Aerospace shows strong profitability and global diversification but faces valuation and liquidity challenges. Huntington Ingalls exhibits financial prudence with favorable cost of capital and dividend yield but has weaker profitability metrics. These profiles suggest distinct strategic focuses for each company.
The Moat Duel: Analyzing Competitive Defensibility
A structural moat is the only reliable shield protecting long-term profits from relentless competition erosion. Let’s dissect the moats of two aerospace and defense leaders:
GE Aerospace: Innovation-Driven Intangible Assets
GE Aerospace’s moat stems from its advanced jet engine technology and integrated systems. I see this reflected in its high EBIT margin (24%) and growing profitability despite a slight value destruction. New defense propulsion innovations in 2026 could deepen this intangible asset moat.
Huntington Ingalls Industries, Inc.: Specialized Shipbuilding Expertise
HII’s moat relies on specialized military shipbuilding and lifecycle sustainment contracts. Unlike GE, HII struggles with narrow margins (~6%) and declining ROIC, signaling weakening competitive defenses. However, expansion into unmanned systems offers some future upside.
Verdict: Intangible Innovation vs. Specialized Manufacturing
GE Aerospace possesses a wider, more scalable moat driven by innovation and margin stability. HII’s moat is narrower and eroding due to profitability pressures. GE is better positioned to defend and grow its market share in 2026.
Which stock offers better returns?
The past year saw GE Aerospace’s stock surge sharply but with slowing momentum. Huntington Ingalls Industries, Inc. climbed steadily, gaining speed in recent months.
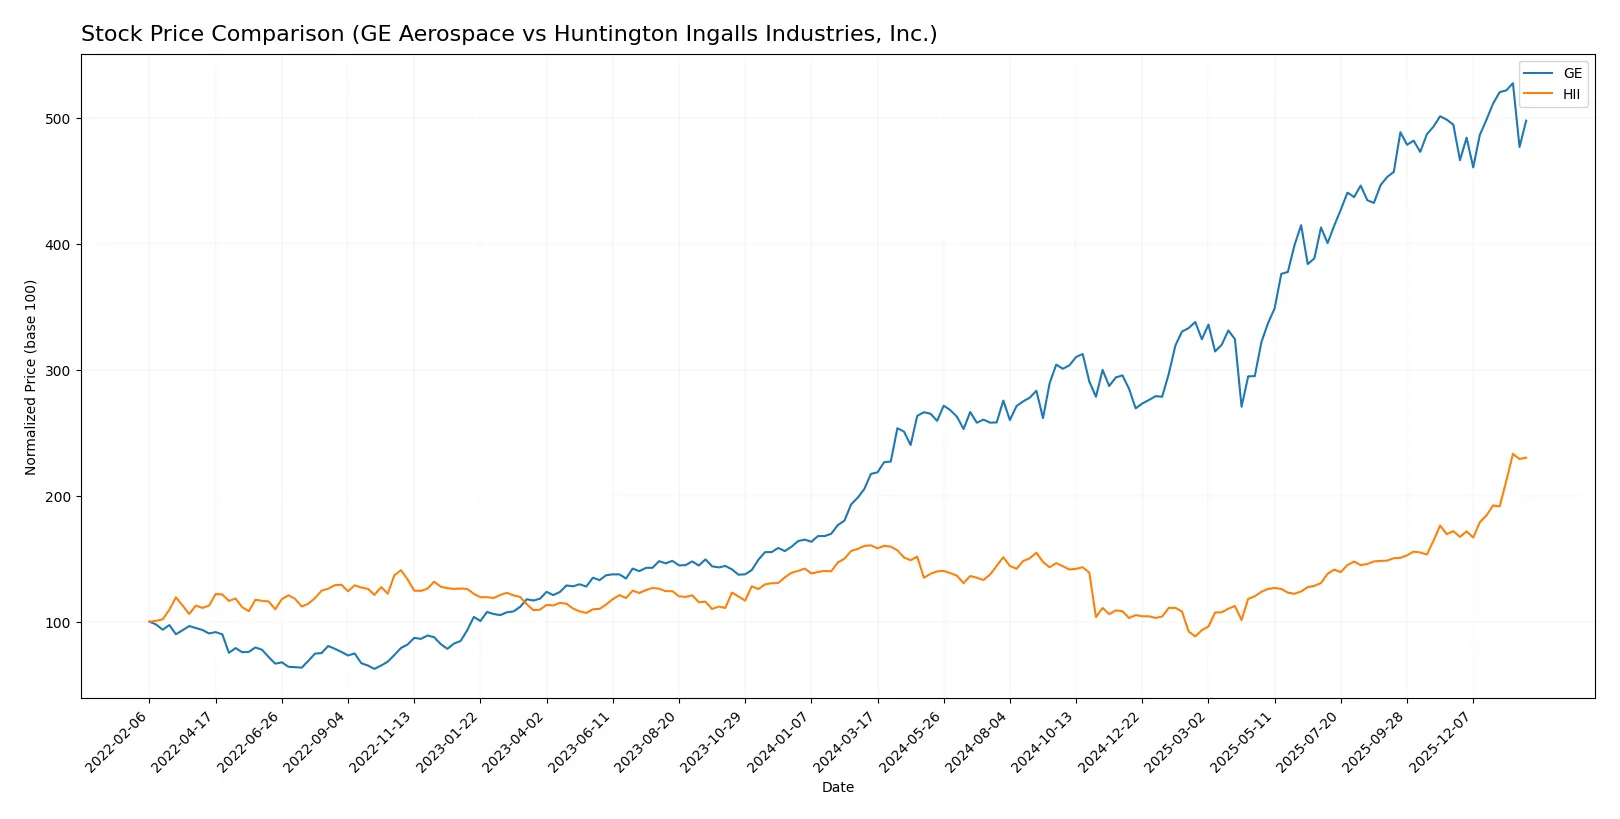
Trend Comparison
GE Aerospace’s stock price rose 129.03% over 12 months, marking a bullish trend with decelerating momentum. It ranged from 134 to 325, showing high volatility (56.42 std deviation).
Huntington Ingalls Industries gained 43.36% over the same period, a bullish trend with accelerating momentum. Prices varied between 161 and 426, with slightly lower volatility (52.5 std deviation).
GE’s return significantly outpaced Huntington Ingalls, despite slowing acceleration. GE leads in total price appreciation over the past 12 months.
Target Prices
Analysts present a bullish target consensus for both GE Aerospace and Huntington Ingalls Industries, reflecting confidence in aerospace and defense growth.
| Company | Target Low | Target High | Consensus |
|---|---|---|---|
| GE Aerospace | 374 | 387 | 380.33 |
| Huntington Ingalls Industries, Inc. | 264 | 425 | 367 |
GE Aerospace’s target consensus sits roughly 24% above its current price of $306.79, signaling upside potential. Huntington Ingalls Industries’ consensus target is slightly below its current price of $420.51, indicating mixed analyst expectations.

Don’t Let Luck Decide Your Entry Point
Optimize your entry points with our advanced ProRealTime indicators. You’ll get efficient buy signals with precise price targets for maximum performance. Start outperforming now!
How do institutions grade them?
GE Aerospace Grades
The following table summarizes recent grades assigned to GE Aerospace by major institutions.
| Grading Company | Action | New Grade | Date |
|---|---|---|---|
| JP Morgan | Maintain | Overweight | 2026-01-26 |
| Citigroup | Maintain | Buy | 2026-01-23 |
| UBS | Maintain | Buy | 2026-01-23 |
| UBS | Maintain | Buy | 2026-01-15 |
| Citigroup | Maintain | Buy | 2026-01-13 |
| JP Morgan | Maintain | Overweight | 2025-10-27 |
| B of A Securities | Maintain | Buy | 2025-10-27 |
| UBS | Maintain | Buy | 2025-10-22 |
| RBC Capital | Maintain | Outperform | 2025-10-22 |
| Barclays | Maintain | Overweight | 2025-07-23 |
Huntington Ingalls Industries, Inc. Grades
This table lists the most recent institutional grades for Huntington Ingalls Industries, Inc.
| Grading Company | Action | New Grade | Date |
|---|---|---|---|
| Goldman Sachs | Maintain | Buy | 2026-01-20 |
| Citigroup | Maintain | Buy | 2026-01-13 |
| JP Morgan | Maintain | Neutral | 2025-11-03 |
| Goldman Sachs | Maintain | Buy | 2025-10-31 |
| TD Cowen | Maintain | Buy | 2025-10-31 |
| B of A Securities | Maintain | Underperform | 2025-08-13 |
| Barclays | Maintain | Equal Weight | 2025-08-04 |
| TD Cowen | Upgrade | Buy | 2025-07-10 |
| Barclays | Maintain | Equal Weight | 2025-05-05 |
| Goldman Sachs | Maintain | Buy | 2025-05-02 |
Which company has the best grades?
GE Aerospace consistently receives buy and overweight ratings from top-tier institutions. Huntington Ingalls shows mixed grades, including underperform and neutral. GE’s stronger consensus may attract investors seeking stability and confidence.
Risks specific to each company
The following categories identify critical pressure points and systemic threats facing GE Aerospace and Huntington Ingalls Industries in the 2026 market environment:
1. Market & Competition
GE Aerospace
- Faces intense competition in commercial and military jet engines; higher beta (1.403) reflects market sensitivity.
Huntington Ingalls Industries, Inc.
- Operates in a niche military shipbuilding sector; lower beta (0.354) suggests less market volatility and stable demand.
2. Capital Structure & Debt
GE Aerospace
- High debt-to-equity ratio (1.1) signals elevated leverage and financial risk.
Huntington Ingalls Industries, Inc.
- Moderate leverage (debt-to-equity 0.73) supports financial flexibility and lower risk.
3. Stock Volatility
GE Aerospace
- Beta at 1.403 indicates higher stock price volatility and market sensitivity.
Huntington Ingalls Industries, Inc.
- Beta at 0.354 shows relative stability and less price fluctuation.
4. Regulatory & Legal
GE Aerospace
- Subject to aerospace and defense regulations, including export controls and environmental standards.
Huntington Ingalls Industries, Inc.
- Faces stringent defense contracting regulations and nuclear safety compliance risks.
5. Supply Chain & Operations
GE Aerospace
- Complex global supply chain for jet engines vulnerable to disruptions and cost inflation.
Huntington Ingalls Industries, Inc.
- Dependence on specialized military suppliers; risks from shipbuilding delays and cost overruns.
6. ESG & Climate Transition
GE Aerospace
- Pressure to innovate cleaner engine technologies amid tightening emissions standards.
Huntington Ingalls Industries, Inc.
- Challenges in reducing environmental impact of nuclear operations and shipbuilding emissions.
7. Geopolitical Exposure
GE Aerospace
- Exposure to global commercial and military markets, sensitive to trade tensions and defense budgets.
Huntington Ingalls Industries, Inc.
- Primarily US-focused defense contractor, less exposed to international geopolitical volatility.
Which company shows a better risk-adjusted profile?
GE Aerospace’s most impactful risk is high leverage and elevated stock volatility, increasing financial and market risk. Huntington Ingalls faces greater operational risk due to complex shipbuilding projects but benefits from lower leverage and steadier stock behavior. HII’s stronger Piotroski score and favorable debt metrics suggest a better risk-adjusted profile. Recent data confirm GE’s unfavorable debt-to-equity and price multiples as red flags, while HII’s stability and dividend yield support cautious optimism.
Final Verdict: Which stock to choose?
GE Aerospace’s superpower lies in its remarkable earnings efficiency and rapidly improving profitability. Its soaring return on equity signals strong value creation, but a high valuation multiple and leverage present points of vigilance. It suits investors with an appetite for aggressive growth amid operational complexity.
Huntington Ingalls Industries commands a robust strategic moat through its stable defense contracting revenues and prudent capital management. Its lower valuation and stronger balance sheet offer a safety buffer compared to GE. This profile fits well within a GARP strategy focused on steady, reasonably priced growth.
If you prioritize high-growth potential and can tolerate valuation and leverage risks, GE outshines with its accelerating profitability. However, if you seek better financial stability and a disciplined moat, Huntington Ingalls offers a superior risk-adjusted framework. Both present viable scenarios depending on your risk tolerance and investment horizon.
Disclaimer: Investment carries a risk of loss of initial capital. The past performance is not a reliable indicator of future results. Be sure to understand risks before making an investment decision.
Go Further
I encourage you to read the complete analyses of GE Aerospace and Huntington Ingalls Industries, Inc. to enhance your investment decisions: