Home > Comparison > Industrials > GE vs GD
The strategic rivalry between GE Aerospace and General Dynamics Corporation shapes the aerospace and defense sector’s evolution. GE Aerospace operates as a capital-intensive jet engine and propulsion systems manufacturer. In contrast, General Dynamics spans diversified aerospace, marine, combat systems, and technology services. This analysis pits GE’s focused innovation against General Dynamics’ broad defense portfolio to identify which offers the superior risk-adjusted return for a diversified industrials allocation.

Table of contents
Companies Overview
GE Aerospace and General Dynamics Corporation are key players in the aerospace and defense industry with distinct market roles.
GE Aerospace: Engine Powerhouse and Systems Integrator
GE Aerospace dominates as a leading manufacturer of jet and turboprop engines for commercial and military aviation. Its revenue primarily stems from designing, producing, and servicing engines through its Commercial Engines & Services and Defense & Propulsion Technologies segments. In 2026, it continues to focus strategically on innovation in propulsion technologies and expanding aftermarket services to sustain its competitive edge.
General Dynamics Corporation: Diversified Defense Giant
General Dynamics operates as a comprehensive aerospace and defense contractor with four diverse business segments including Aerospace, Marine Systems, Combat Systems, and Technologies. It generates revenue through manufacturing business jets, naval vessels, combat vehicles, and providing advanced IT and mission support services. Its 2026 strategy emphasizes modernization of military platforms and expanding technology-driven defense solutions.
Strategic Collision: Similarities & Divergences
Both companies thrive in aerospace and defense but with contrasting approaches: GE Aerospace focuses on engine-centric innovation, while General Dynamics pursues a broad platform diversification. Their primary battleground is advanced defense technology and military contracts. Investors face distinct profiles: GE Aerospace offers concentrated exposure to propulsion systems; General Dynamics provides diversified defense sector participation with steady government demand.
Income Statement Comparison
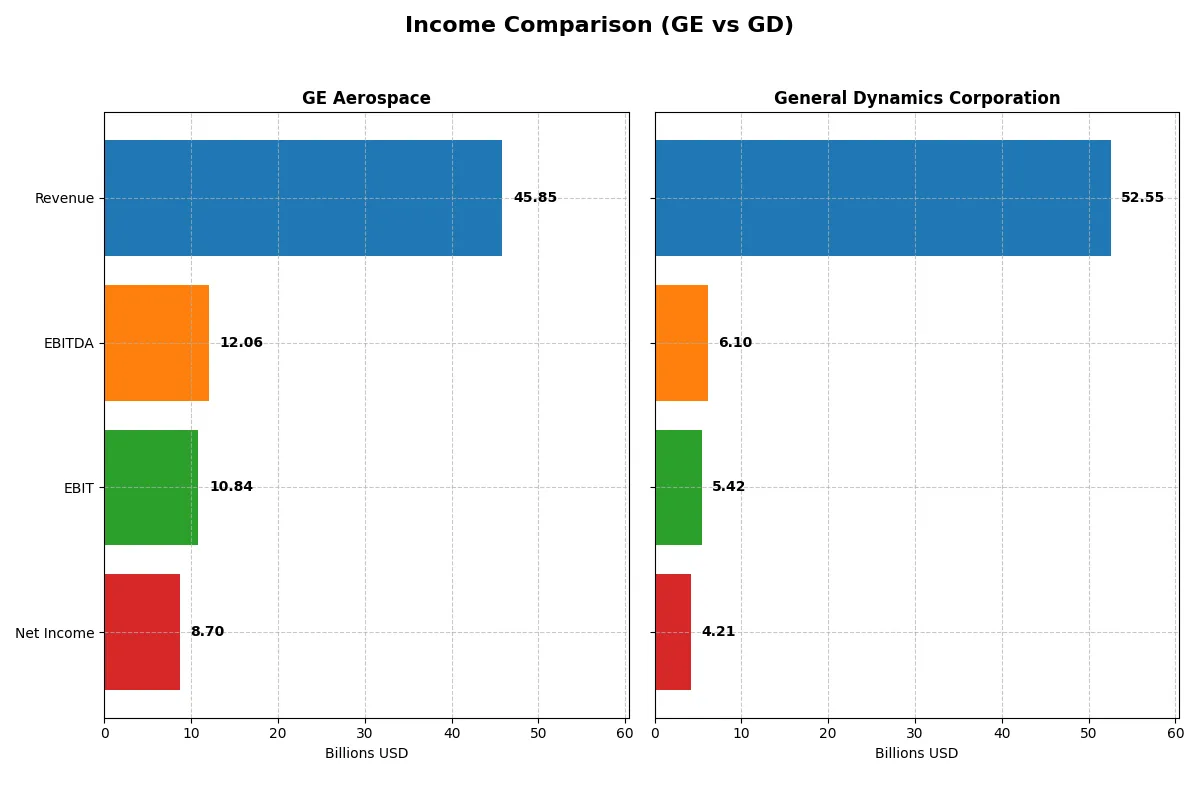
This data dissects the core profitability and scalability of both corporate engines to reveal who dominates the bottom line:
| Metric | GE Aerospace (GE) | General Dynamics Corporation (GD) |
|---|---|---|
| Revenue | 45.9B | 52.6B |
| Cost of Revenue | 28.97B | 44.6B |
| Operating Expenses | 8.12B | 2.60B |
| Gross Profit | 16.9B | 7.95B |
| EBITDA | 12.1B | 6.10B |
| EBIT | 10.8B | 5.42B |
| Interest Expense | 843M | 314M |
| Net Income | 8.70B | 4.21B |
| EPS | 8.16 | 15.64 |
| Fiscal Year | 2025 | 2025 |
Income Statement Analysis: The Bottom-Line Duel
This income statement comparison reveals which company runs a more efficient and profitable corporate engine through recent financial performance.
GE Aerospace Analysis
GE Aerospace shows robust revenue growth from $29B in 2022 to $45.9B in 2025, with net income surging from $336M to $8.7B. Its gross margin holds strong near 37%, while net margin approaches 19%, reflecting solid profitability. The 2025 year highlights accelerating efficiency, with net income and EPS rising sharply, signaling operational momentum.
General Dynamics Corporation Analysis
General Dynamics steadily grows revenue by 36.6% over 2021-2025, reaching $52.6B in 2025. However, its gross margin lags at 15%, though net margin remains favorable at 8%. Net income ascended to $4.2B in 2025, supported by controlled interest expenses. The company’s steady margin expansion and consistent EPS growth underscore stable but moderate profitability.
Margin Strength vs. Revenue Scale
GE Aerospace outpaces General Dynamics in margin quality and bottom-line growth, boasting nearly double the net margin and faster net income gains. While General Dynamics leads in revenue scale and steady growth, GE’s superior margin efficiency makes it the clearer fundamental winner. Investors seeking high profitability and earnings momentum may favor GE’s profile.
Financial Ratios Comparison
These vital ratios act as a diagnostic tool to expose the underlying fiscal health, valuation premiums, and capital efficiency of the companies compared:
| Ratios | GE Aerospace (GE) | General Dynamics Corporation (GD) |
|---|---|---|
| ROE | 46.60% | 16.43% |
| ROIC | 8.12% | 10.66% |
| P/E | 37.76 | 21.58 |
| P/B | 17.60 | 3.55 |
| Current Ratio | 1.04 | 1.44 |
| Quick Ratio | 0.74 | 0.89 |
| D/E | 1.10 | 0.31 |
| Debt-to-Assets | 15.74% | 13.99% |
| Interest Coverage | 10.40 | 17.06 |
| Asset Turnover | 0.35 | 0.92 |
| Fixed Asset Turnover | 5.74 | 6.98 |
| Payout Ratio | 16.68% | 37.84% |
| Dividend Yield | 0.44% | 1.75% |
| Fiscal Year | 2025 | 2025 |
Efficiency & Valuation Duel: The Vital Signs
Financial ratios serve as the company’s DNA, exposing hidden risks and operational excellence beneath surface-level figures.
GE Aerospace
GE Aerospace boasts a robust 46.6% ROE and a strong 18.98% net margin, signaling exceptional profitability. However, its P/E ratio of 37.76 indicates a stretched valuation compared to industry norms. The company returns value modestly through a 0.44% dividend yield, with reinvestment focused on R&D at 3.45% of revenue to fuel future growth.
General Dynamics Corporation
General Dynamics displays a solid 16.43% ROE and an 8.01% net margin, reflecting efficient capital use and steady profitability. Its P/E of 21.58 is reasonable, neither expensive nor deeply undervalued. The 1.75% dividend yield highlights a commitment to shareholder returns, supported by favorable leverage and a strong 10.66% ROIC exceeding its lower 5.55% WACC.
Premium Valuation vs. Operational Safety
GE Aerospace commands a premium valuation with superior profitability but carries risks from high leverage and stretched multiples. General Dynamics offers a balanced profile with sound returns and healthier debt metrics. Investors prioritizing growth may lean toward GE, while those favoring risk-managed income might prefer General Dynamics.
Which one offers the Superior Shareholder Reward?
I observe that GE Aerospace pays a modest dividend yield of 0.44% with a low payout ratio around 16.7%, signaling conservative income distribution backed by strong free cash flow coverage (3.13x). Its buyback activity appears limited, focusing more on reinvestment in operations. General Dynamics Corporation delivers a higher dividend yield near 1.75%, but with a payout ratio close to 38%, which is riskier given its moderate free cash flow coverage (1.86x). GD also executes substantial share repurchases, enhancing total shareholder return aggressively. I find GE’s conservative dividend and reinvestment approach more sustainable for long-term value creation, while GD’s higher yield and buybacks offer attractive near-term income. For 2026, I favor GE Aerospace for balanced total return with lower payout risk and robust cash flow discipline.
Comparative Score Analysis: The Strategic Profile
The radar chart reveals the fundamental DNA and trade-offs of GE Aerospace and General Dynamics Corporation, highlighting their financial strengths and valuation nuances:
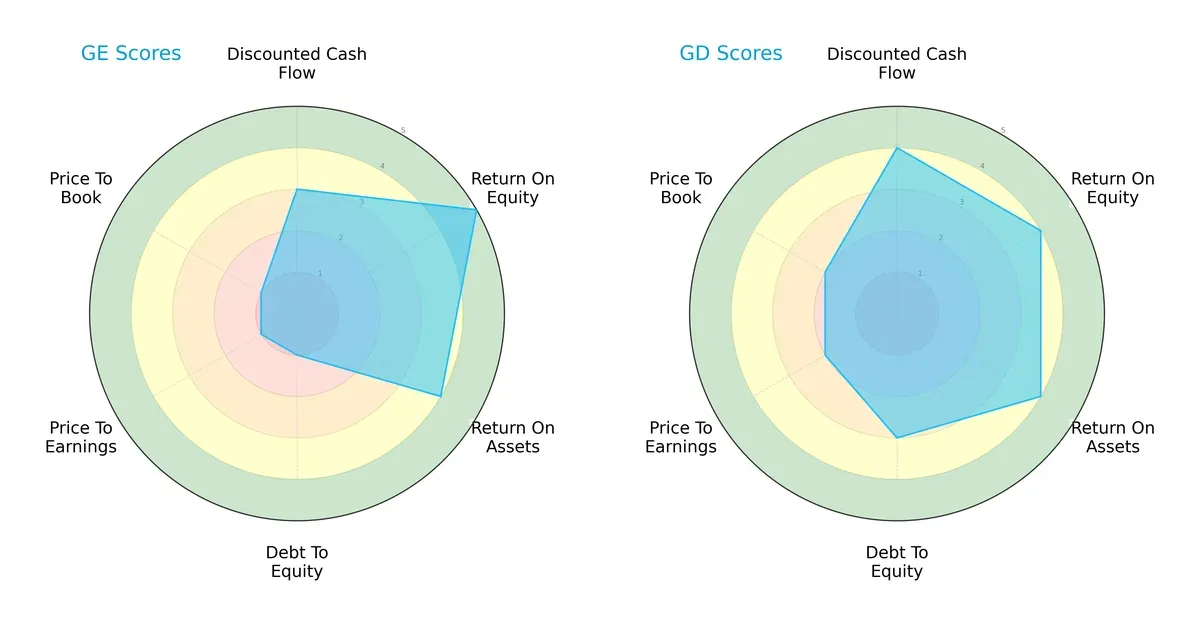
GE Aerospace excels in return on equity (ROE) with a top score of 5, indicating strong profitability from shareholder equity. General Dynamics shows a more balanced profile, scoring moderately high across discounted cash flow (DCF), ROE, return on assets (ROA), and debt-to-equity ratios. GE’s major weakness lies in its debt-to-equity and valuation metrics, scoring very low, signaling financial risk and potential overvaluation. General Dynamics offers a steadier risk-return balance with moderate debt levels and more reasonable valuation scores.
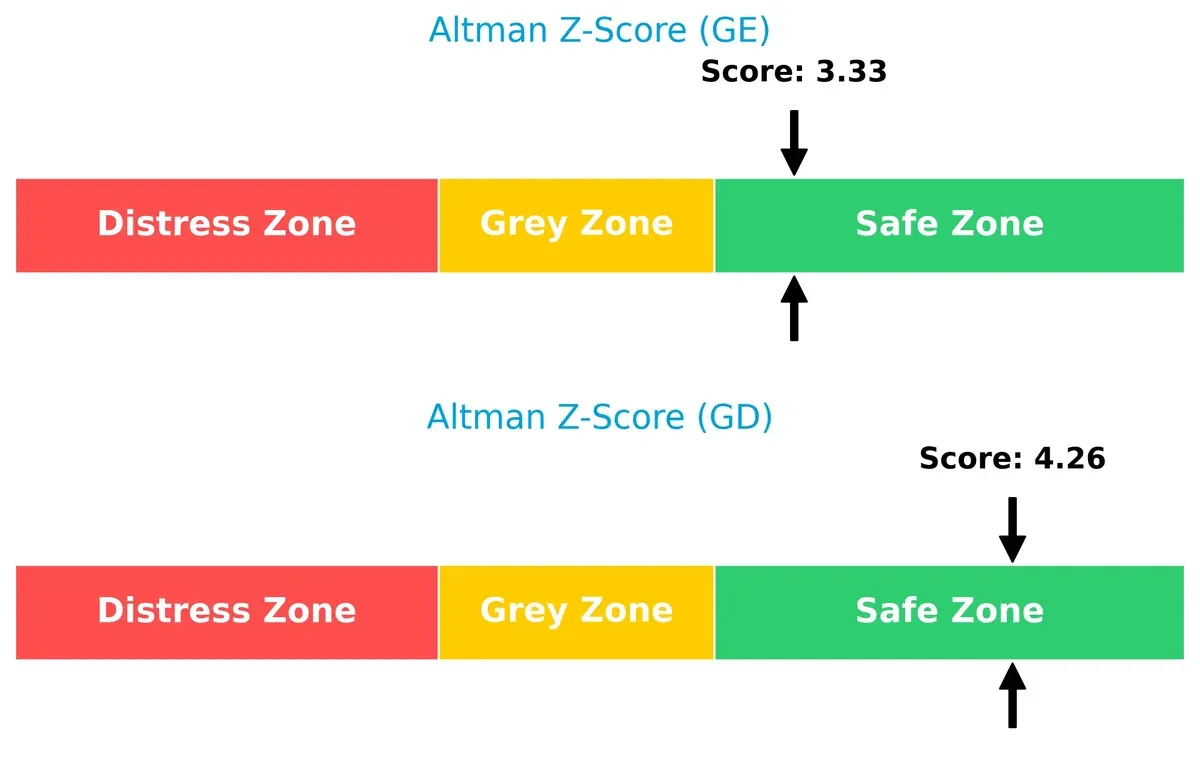
Bankruptcy Risk: Solvency Showdown
The Altman Z-Score gap favors General Dynamics at 4.26 versus GE Aerospace’s 3.33, both safely above distress thresholds, but GD’s higher score implies stronger long-term solvency in this market cycle:
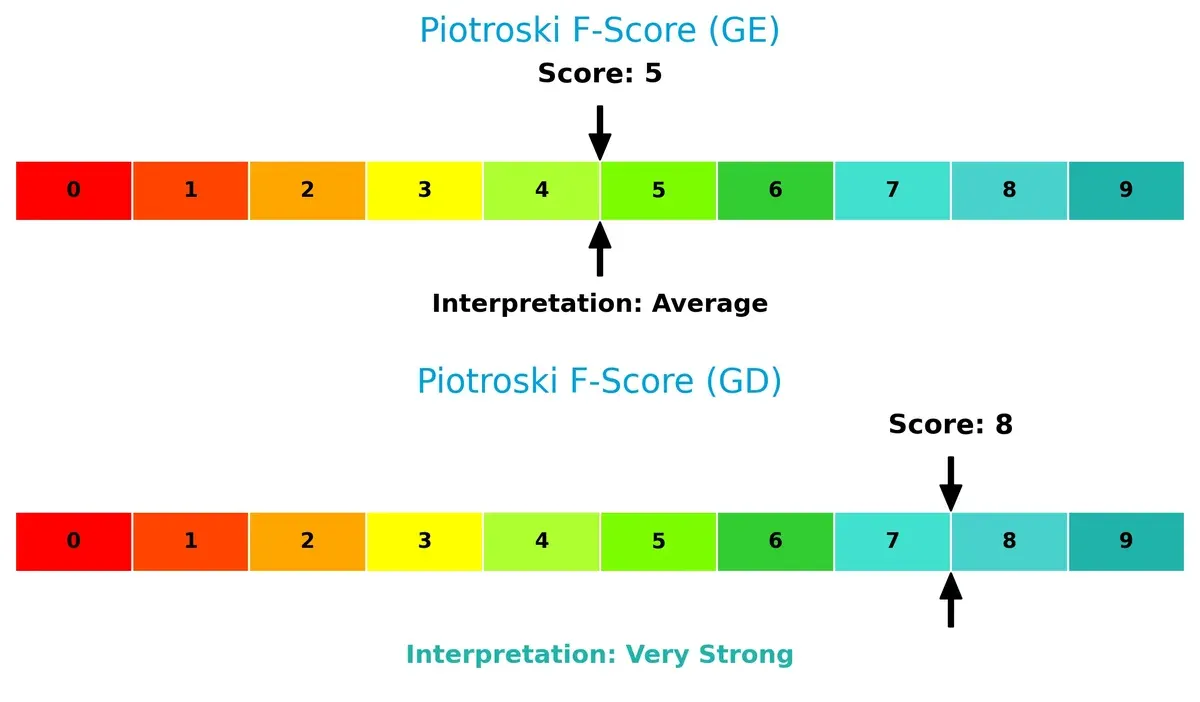
Financial Health: Quality of Operations
General Dynamics leads decisively with a Piotroski F-Score of 8, signaling robust financial health and operational strength. GE Aerospace’s score of 5 flags moderate internal weaknesses compared to GD’s very strong fundamentals:
How are the two companies positioned?
This section dissects GE Aerospace and General Dynamics’ operational DNA by comparing revenue distribution and internal strengths and weaknesses. The goal is to confront their economic moats to reveal which model offers the most resilient, sustainable competitive advantage today.
Revenue Segmentation: The Strategic Mix
This comparison dissects how GE Aerospace and General Dynamics diversify income streams, revealing where each firm places its primary sector bets:
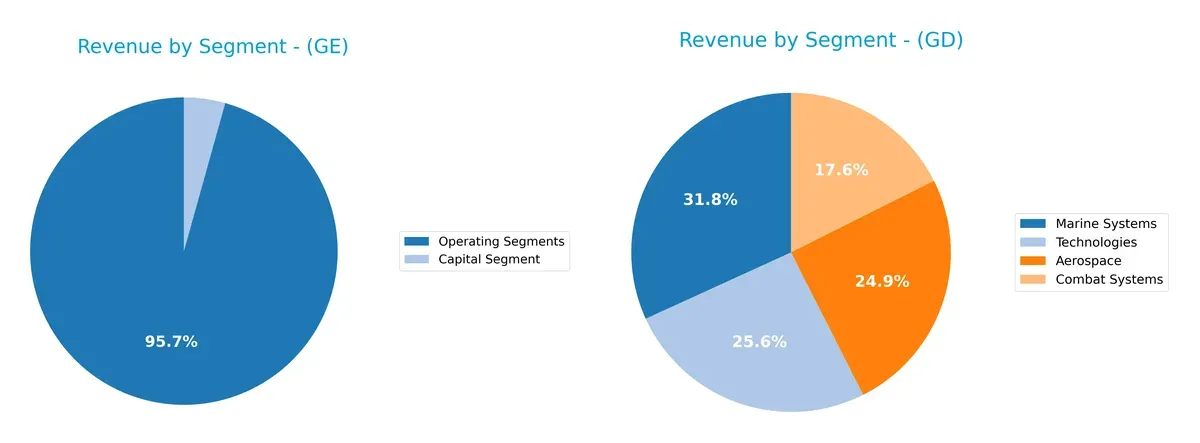
GE Aerospace’s revenue pivots heavily on its Aerospace Segment at $31.7B, with solid contributions from Power ($17.7B) and Renewable Energy ($15.1B). It maintains a moderately diversified mix, balancing legacy infrastructure with clean energy. General Dynamics shows a more balanced segmentation: Marine Systems leads at $16.7B, followed closely by Technologies ($13.5B), Aerospace ($13.1B), and Combat Systems ($9.2B). GD’s broad mix mitigates concentration risk, while GE’s aerospace dominance anchors its ecosystem lock-in strategy.
Strengths and Weaknesses Comparison
This table compares the strengths and weaknesses of GE Aerospace and General Dynamics Corporation based on diversification, profitability, financials, innovation, global presence, and market share:
GE Aerospace Strengths
- Diverse revenue streams across aerospace, power, and renewable energy
- Strong net margin of 18.98%
- High ROE at 46.6%
- Favorable debt to assets at 15.74%
- Solid interest coverage ratio of 12.86
- Significant global presence with $27.7B non-US revenue
General Dynamics Strengths
- Favorable ROIC of 10.66% above WACC of 5.55%
- Strong interest coverage at 17.25
- Lower debt-to-equity ratio at 0.31
- Balanced segment revenue including marine and technologies
- Stable current and quick ratios
- Large North American revenue of $45.8B indicating strong market share
GE Aerospace Weaknesses
- Unfavorable valuation multiples: P/E 37.76, P/B 17.6
- Quick ratio weak at 0.74
- High debt-to-equity ratio of 1.1
- Asset turnover low at 0.35
- Dividend yield low at 0.44%
- Slightly unfavorable overall financial ratios
General Dynamics Weaknesses
- Neutral net margin at 8.01%
- P/B ratio also unfavorable at 3.55
- Quick ratio moderate at 0.89
- Dividend yield neutral at 1.75%
- Geographic concentration in North America limits global diversification
Overall, GE Aerospace demonstrates strong profitability and global diversification but faces valuation and liquidity concerns. General Dynamics shows strong capital efficiency and financial stability with a focus on North American market dominance, though profitability margins and geographic diversity remain areas to watch. Both companies’ strategic positioning reflects their respective strengths and financial profile nuances.
The Moat Duel: Analyzing Competitive Defensibility
A structural moat safeguards long-term profits from relentless competitive erosion. Without it, gains quickly vanish in this capital-intensive sector:
GE Aerospace: Innovation-Driven Intangible Asset Moat
GE Aerospace leverages proprietary jet engine technology and integrated systems, reflected in its robust 24% EBIT margin and rising profitability. New defense propulsion projects could deepen this moat in 2026, but value destruction signals caution.
General Dynamics Corporation: Diversified Cost & Scale Advantage
General Dynamics exploits scale across aerospace, marine, and combat systems, generating a solid 10% EBIT margin and consistent value creation. Its broad portfolio and growing ROIC suggest durable competitive strength and expansion potential in defense tech services.
Intangible Innovation vs. Scale Efficiency: The Moat Showdown
General Dynamics holds the deeper moat, with ROIC exceeding WACC by 5% and steady growth, signaling sustainable value creation. GE’s innovation edge faces margin pressure and value erosion, making General Dynamics better positioned to defend market share.
Which stock offers better returns?
The past year saw GE Aerospace’s stock surge 129%, then slow down recently, while General Dynamics Corporation gained 29%, accelerating its upward momentum.
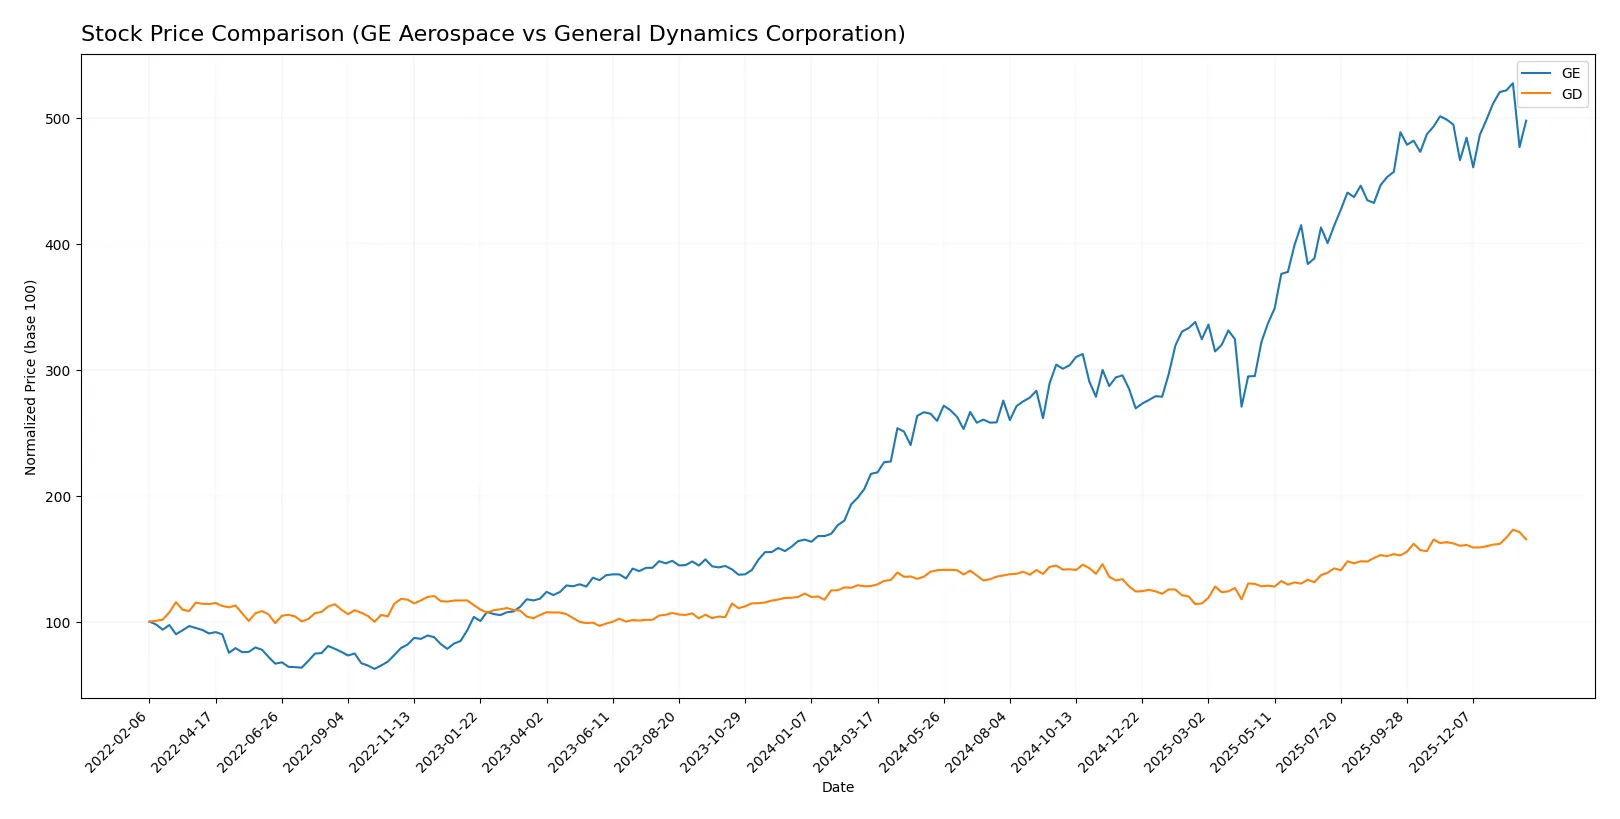
Trend Comparison
GE Aerospace’s stock rose 129% over the last 12 months, showing a bullish trend with decelerating price gains. It reached a high of 325.12 and a low of 133.95, with high volatility (std dev 56.42).
General Dynamics Corporation’s stock climbed 29% in the same period, also bullish but accelerating gains. It traded between 241.94 and 367.38, with moderate volatility (std dev 28.77).
GE Aerospace delivered substantially stronger market performance than General Dynamics, despite recent deceleration, maintaining a clear lead in total price appreciation.
Target Prices
Analysts present a bullish consensus on GE Aerospace and General Dynamics Corporation with solid upside potential.
| Company | Target Low | Target High | Consensus |
|---|---|---|---|
| GE Aerospace | 374 | 387 | 380.33 |
| General Dynamics Corporation | 385 | 444 | 404.22 |
The target consensus for GE Aerospace sits about 24% above its current price of 307, signaling strong growth expectations. General Dynamics shows a 15% upside from its current 351, reflecting steady confidence in its defense sector leadership.

Don’t Let Luck Decide Your Entry Point
Optimize your entry points with our advanced ProRealTime indicators. You’ll get efficient buy signals with precise price targets for maximum performance. Start outperforming now!
How do institutions grade them?
This section presents the latest institutional grades for GE Aerospace and General Dynamics Corporation:
GE Aerospace Grades
The following table summarizes the recent grades from leading financial institutions for GE Aerospace.
| Grading Company | Action | New Grade | Date |
|---|---|---|---|
| JP Morgan | Maintain | Overweight | 2026-01-26 |
| Citigroup | Maintain | Buy | 2026-01-23 |
| UBS | Maintain | Buy | 2026-01-23 |
| UBS | Maintain | Buy | 2026-01-15 |
| Citigroup | Maintain | Buy | 2026-01-13 |
| JP Morgan | Maintain | Overweight | 2025-10-27 |
| B of A Securities | Maintain | Buy | 2025-10-27 |
| UBS | Maintain | Buy | 2025-10-22 |
| RBC Capital | Maintain | Outperform | 2025-10-22 |
| Barclays | Maintain | Overweight | 2025-07-23 |
General Dynamics Corporation Grades
The table below details recent institutional grades for General Dynamics Corporation.
| Grading Company | Action | New Grade | Date |
|---|---|---|---|
| B of A Securities | Maintain | Buy | 2026-01-30 |
| UBS | Maintain | Neutral | 2026-01-15 |
| Citigroup | Maintain | Neutral | 2026-01-13 |
| JP Morgan | Maintain | Overweight | 2025-12-19 |
| Morgan Stanley | Upgrade | Overweight | 2025-12-16 |
| JP Morgan | Maintain | Overweight | 2025-10-28 |
| B of A Securities | Maintain | Buy | 2025-10-28 |
| Bernstein | Maintain | Market Perform | 2025-10-28 |
| JP Morgan | Maintain | Overweight | 2025-10-27 |
| Susquehanna | Maintain | Positive | 2025-10-27 |
Which company has the best grades?
GE Aerospace consistently receives Buy and Overweight ratings from top firms, reflecting stronger institutional confidence. General Dynamics shows mixed Neutral and Buy ratings, signaling more cautious investor sentiment. This difference may influence portfolio risk profiles and expected returns.
Risks specific to each company
In 2026’s complex aerospace and defense market, these categories highlight critical pressure points and systemic threats facing GE Aerospace and General Dynamics Corporation:
1. Market & Competition
GE Aerospace
- Faces intense competition in commercial and military engines; high valuation multiples pressure growth expectations.
General Dynamics Corporation
- Diverse defense portfolio cushions market risks; lower beta signals more stable competitive positioning.
2. Capital Structure & Debt
GE Aerospace
- High debt-to-equity ratio (1.1) signals elevated financial leverage risk; interest coverage remains strong but warrants caution.
General Dynamics Corporation
- Conservative leverage profile with debt-to-equity 0.31; healthier balance sheet reduces refinancing risk.
3. Stock Volatility
GE Aerospace
- Beta at 1.4 indicates above-market volatility; stock price range is wide, increasing risk for traders.
General Dynamics Corporation
- Low beta of 0.41 reflects defensive stock behavior; price range is narrower, easing volatility concerns.
4. Regulatory & Legal
GE Aerospace
- Subject to complex aerospace regulations globally; innovation in defense tech requires strict compliance.
General Dynamics Corporation
- Operates in highly regulated sectors including nuclear submarines and combat systems; legal risks from government contracts.
5. Supply Chain & Operations
GE Aerospace
- Complex global supply chains for engines; operational efficiency challenged by unfavorable asset turnover ratios.
General Dynamics Corporation
- Extensive manufacturing and service operations; better asset turnover suggests operational resilience.
6. ESG & Climate Transition
GE Aerospace
- Increasing pressure to reduce emissions from jet engines; ESG initiatives critical for future contracts.
General Dynamics Corporation
- Faces scrutiny over military manufacturing impact; climate transition presents reputational and compliance risks.
7. Geopolitical Exposure
GE Aerospace
- Exposure to global aviation markets sensitive to geopolitical tensions and trade policies.
General Dynamics Corporation
- Strong US defense dependency mitigates some risks but exposes firm to shifting defense budgets and foreign policy.
Which company shows a better risk-adjusted profile?
General Dynamics shows a better risk-adjusted profile. Its lower leverage and volatility reduce financial and market risks compared to GE Aerospace. GD’s stronger Piotroski score (8 vs. 5) and safer Altman Z-score confirm superior financial stability. Conversely, GE’s high valuation multiples and debt levels heighten risk. The key concern for GE is its stretched balance sheet amid competitive pressures. For GD, geopolitical exposure in defense contracts remains the largest risk. Overall, GD’s conservative capital structure and diversified operations offer greater risk resilience in 2026’s volatile aerospace-defense landscape.
Final Verdict: Which stock to choose?
GE Aerospace’s superpower lies in its impressive profitability and rapid earnings growth, reflecting strong operational momentum. However, its high valuation multiples and leverage signal a point of vigilance. GE suits investors with an appetite for aggressive growth and a tolerance for elevated risk.
General Dynamics Corporation enjoys a durable competitive moat supported by consistent value creation and a strong balance sheet. Its moderate valuation and superior financial stability make it a safer harbor compared to GE. GD fits well within a GARP (Growth at a Reasonable Price) strategy, balancing growth with prudence.
If you prioritize high growth potential with a willingness to accept valuation risks, GE Aerospace is the compelling choice due to its earnings momentum. However, if you seek better stability and a stronger moat, General Dynamics offers a more durable competitive advantage and financial resilience, commanding a premium for safety.
Disclaimer: Investment carries a risk of loss of initial capital. The past performance is not a reliable indicator of future results. Be sure to understand risks before making an investment decision.
Go Further
I encourage you to read the complete analyses of GE Aerospace and General Dynamics Corporation to enhance your investment decisions: