Home > Comparison > Technology > WIT vs IT
The strategic rivalry between Wipro Limited and Gartner, Inc. shapes the evolution of the global technology sector. Wipro operates as a capital-intensive IT services and consulting powerhouse with a broad global footprint. In contrast, Gartner excels as a high-margin research and advisory firm, leveraging subscription and consulting revenues. This analysis will assess which company presents a superior risk-adjusted opportunity for a diversified portfolio amid shifting technology demands and competitive dynamics.
Table of contents
Companies Overview
Wipro Limited and Gartner, Inc. play pivotal roles in the global information technology services landscape.
Wipro Limited: Global IT Services Powerhouse
Wipro Limited dominates as a diversified IT services provider headquartered in India. It generates revenue through IT consulting, digital strategy, and custom application development, serving multiple industries worldwide. In 2026, Wipro focuses strategically on expanding cloud infrastructure, business process services, and government IT contracts, leveraging its broad service mix and scale to capture emerging market demand.
Gartner, Inc.: Premier IT Research and Advisory Leader
Gartner, Inc. stands out as a leading research and advisory firm in the US, monetizing via subscription-based research, conferences, and consulting services. Its 2026 strategy prioritizes delivering actionable IT solutions around cost optimization and digital transformation. Gartner’s expertise-driven model underpins its influence on enterprise IT decision-making across global markets.
Strategic Collision: Similarities & Divergences
Both firms operate in information technology services but differ fundamentally in approach. Wipro employs a service delivery and infrastructure model spanning multiple industries, while Gartner leverages a knowledge-based subscription and consulting model. Their primary battleground is IT innovation adoption—Wipro scales implementation, Gartner shapes strategy. These distinctions define their unique risk and growth profiles for investors.
Income Statement Comparison
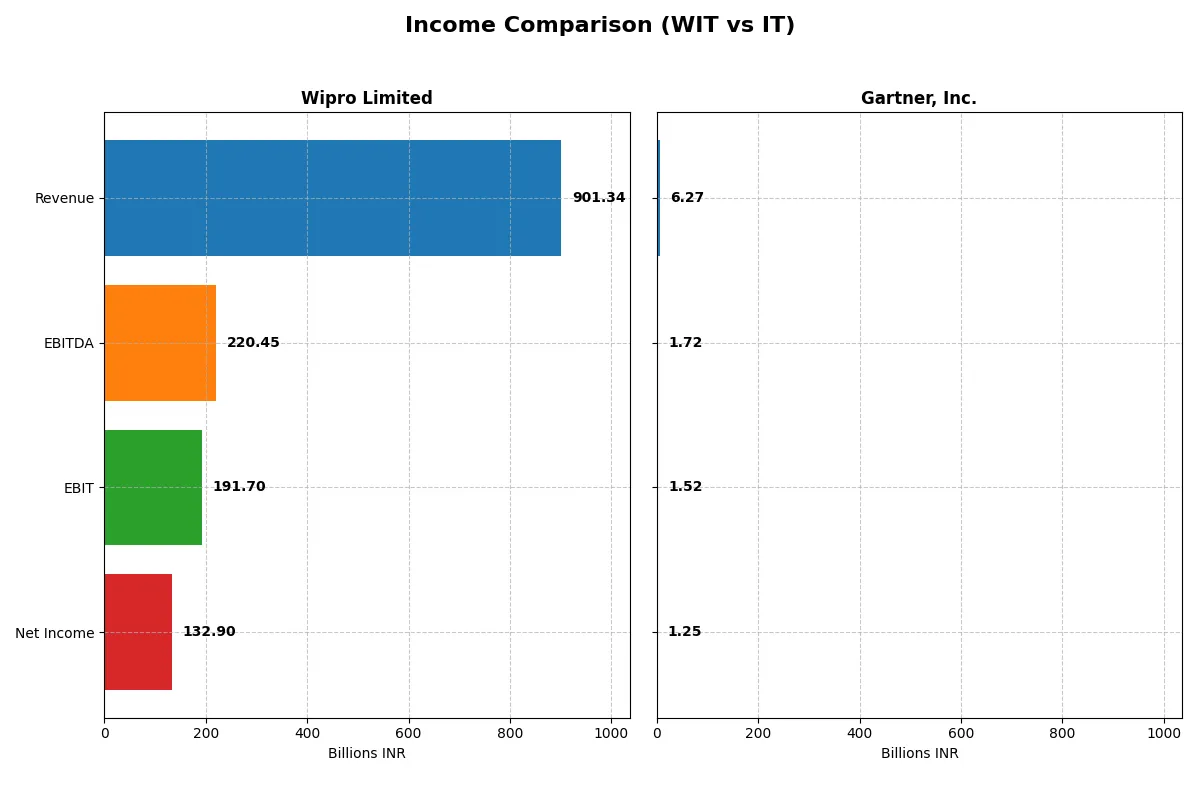
This data dissects the core profitability and scalability of both corporate engines to reveal who dominates the bottom line:
| Metric | Wipro Limited (WIT) | Gartner, Inc. (IT) |
|---|---|---|
| Revenue | 901.3B INR | 6.27B USD |
| Cost of Revenue | 625.1B INR | 2.02B USD |
| Operating Expenses | 122.7B INR | 3.09B USD |
| Gross Profit | 276.3B INR | 4.24B USD |
| EBITDA | 220.5B INR | 1.72B USD |
| EBIT | 191.7B INR | 1.52B USD |
| Interest Expense | 14.9B INR | 131M USD |
| Net Income | 132.9B INR | 1.25B USD |
| EPS | 12.56 INR | 16.12 USD |
| Fiscal Year | 2025 | 2024 |
Income Statement Analysis: The Bottom-Line Duel
This income statement comparison reveals which company converts revenue into profit more efficiently and sustains growth momentum.
Wipro Limited Analysis
Wipro’s revenue slightly declined by 0.24% in 2025 to 901B INR, yet net income rose 19.6% to 133B INR, demonstrating improving profitability. The gross margin at 30.65% and net margin at 14.74% remain solid. Operating efficiency strengthened, with EBIT growing 19% and EPS up 20%, signaling robust cost control despite flat top-line growth.
Gartner, Inc. Analysis
Gartner grew revenue 6.1% to $6.27B in 2024, with net income surging 42% to $1.25B. Its gross margin stands high at 67.7%, and net margin improved to 20%. EBIT advanced 19%, reflecting effective scaling of operations. EPS jumped 44%, underscoring strong earnings momentum and margin expansion, despite slightly higher operating expenses.
Margin Strength vs. Earnings Momentum
Gartner outpaces Wipro in margin expansion and net income growth, boasting superior gross and net profitability. Wipro holds steady margins but faces stagnant revenue. Gartner’s profile suits investors favoring high margin and rapid earnings growth. Wipro appeals more to those prioritizing stable profitability and cost discipline amid slower sales growth.
Financial Ratios Comparison
These vital ratios act as a diagnostic tool to expose the underlying fiscal health, valuation premiums, and capital efficiency of the companies compared below:
| Ratios | Wipro Limited (WIT) | Gartner, Inc. (IT) |
|---|---|---|
| ROE | 16.04% | 92.24% |
| ROIC | 10.49% | 22.39% |
| P/E | 20.60 | 30.06 |
| P/B | 3.30 | 27.73 |
| Current Ratio | 2.72 | 1.06 |
| Quick Ratio | 2.71 | 1.06 |
| D/E | 0.23 | 2.13 |
| Debt-to-Assets | 14.93% | 33.98% |
| Interest Coverage | 10.28 | 8.82 |
| Asset Turnover | 0.70 | 0.73 |
| Fixed Asset Turnover | 8.48 | 12.53 |
| Payout ratio | 47.22% | 0% |
| Dividend yield | 2.29% | 0% |
| Fiscal Year | 2025 | 2024 |
Efficiency & Valuation Duel: The Vital Signs
Ratios act as a company’s DNA, exposing operational strengths and hidden risks often overlooked by headline figures.
Wipro Limited
Wipro delivers solid profitability with a 16% ROE and a favorable 14.7% net margin, reflecting operational efficiency. Its P/E of 20.6 is neutral, but a high P/B of 3.3 signals potential valuation stretch. Wipro supports shareholders with a 2.3% dividend yield, balancing returns with consistent reinvestment in growth and innovation.
Gartner, Inc.
Gartner posts exceptional profitability, boasting a 92% ROE and a 20% net margin, highlighting strong capital efficiency. However, its valuation appears stretched with a P/E above 30 and a steep P/B near 28. The company pays no dividend, focusing capital on growth and stock-based compensation, intensifying risk for income-focused investors.
Premium Valuation vs. Operational Safety
Wipro offers a more balanced risk-reward profile, with stable profitability and shareholder returns at a reasonable valuation. Gartner’s superior returns come at a high price and elevated leverage, fitting investors seeking aggressive growth and willing to accept valuation risk.
Which one offers the Superior Shareholder Reward?
Wipro Limited (WIT) delivers a balanced shareholder reward with a 2.29% dividend yield and a sustainable 47% payout ratio, supported by solid free cash flow of 14.8B INR and moderate buybacks. Gartner, Inc. (IT) pays no dividends but plows nearly all free cash flow (~17.8B USD) into aggressive share repurchases, fueling capital gains. However, IT’s heavy leverage (debt-to-equity 2.13) raises risk. I see WIT’s combined yield and prudent buybacks as a more sustainable and reliable total return in 2026, while IT’s high financial leverage tempers its aggressive buyback gains. WIT offers superior risk-adjusted shareholder reward today.
Comparative Score Analysis: The Strategic Profile
The radar chart reveals the fundamental DNA and trade-offs of Wipro Limited and Gartner, Inc., highlighting their financial strengths and valuation approaches:
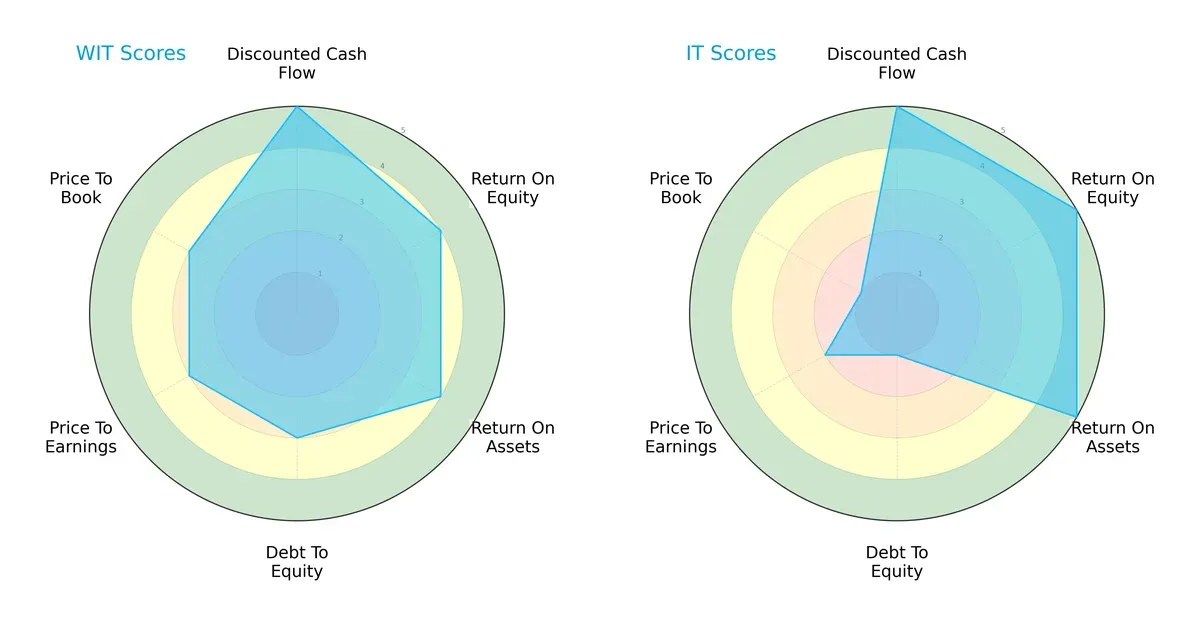
Wipro shows a balanced profile with strong DCF (5) and solid ROE (4) and ROA (4), paired with moderate debt and valuation scores (3 each). Gartner excels in profitability with top ROE (5) and ROA (5) but suffers a heavy debt burden (1) and weaker valuation metrics (P/E 2, P/B 1). Wipro’s strength lies in stability, while Gartner relies on superior operating efficiency despite financial leverage risks.
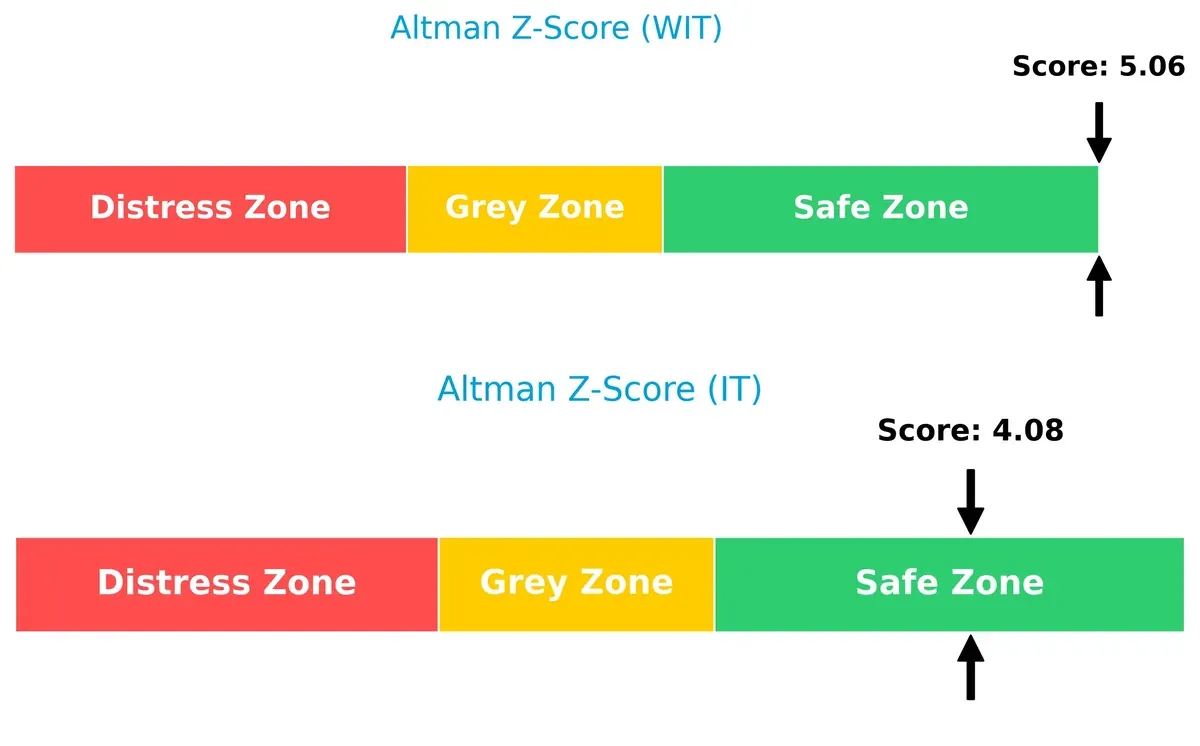
Bankruptcy Risk: Solvency Showdown
Wipro’s Altman Z-Score (5.06) exceeds Gartner’s (4.08), indicating a safer financial footing and lower bankruptcy risk for long-term survival in this cycle:
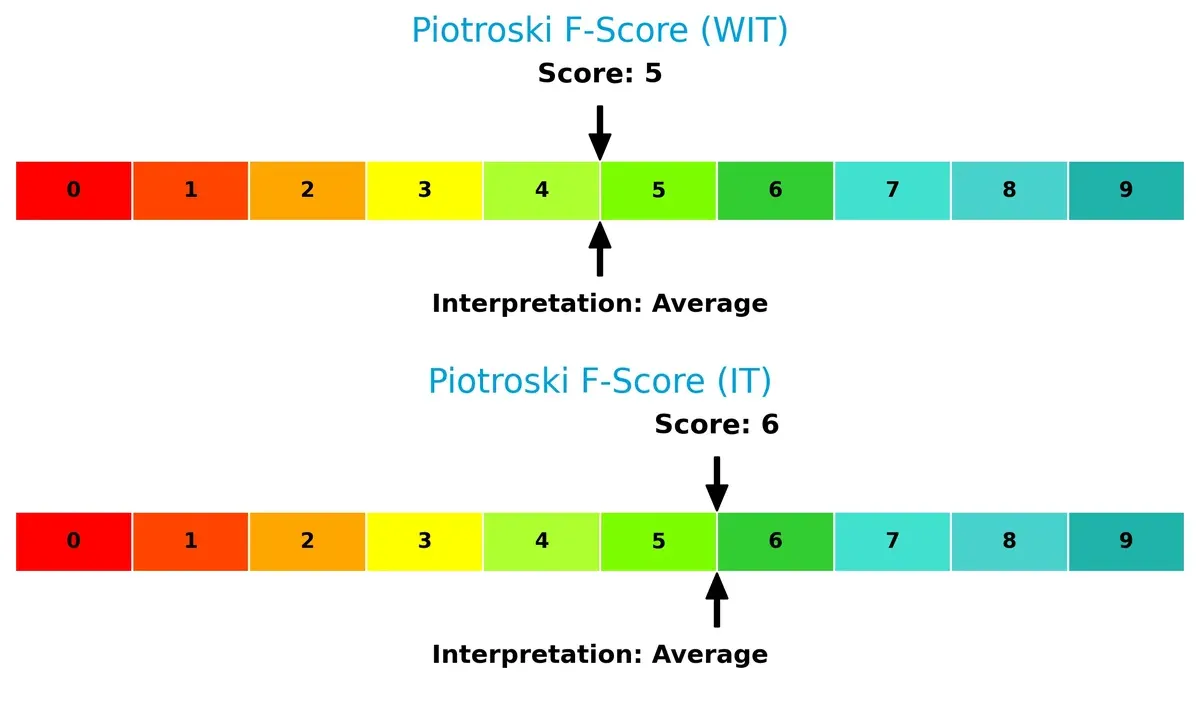
Financial Health: Quality of Operations
Gartner edges out Wipro slightly on Piotroski F-Score (6 vs. 5), suggesting marginally stronger internal financial health, though both companies maintain average operational quality without glaring red flags:
How are the two companies positioned?
This section dissects Wipro and Gartner’s operational DNA by comparing revenue distribution and internal strengths and weaknesses. The goal is to confront their economic moats and reveal which model offers the most resilient, sustainable advantage today.
Revenue Segmentation: The Strategic Mix
This visual comparison dissects how Wipro Limited and Gartner, Inc. diversify their income streams and reveals where their primary sector bets lie:
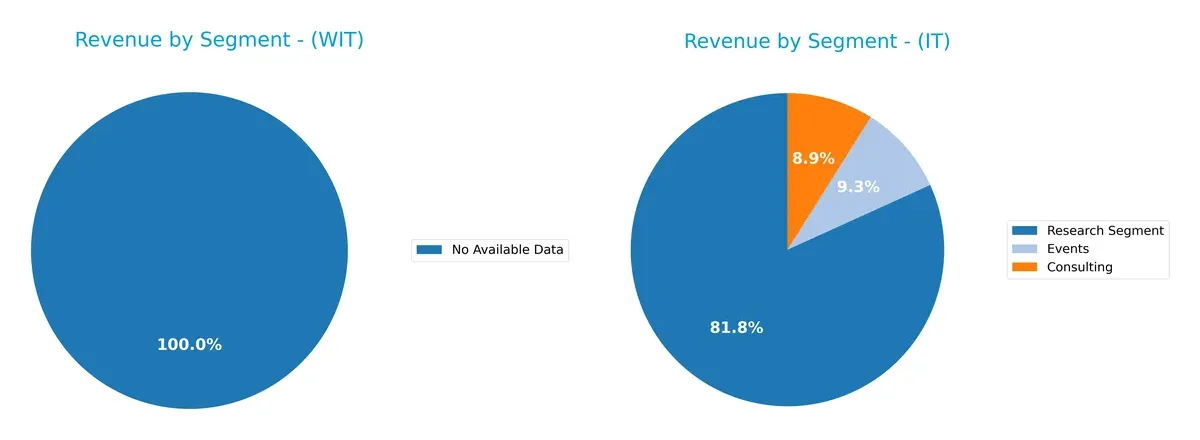
Wipro Limited lacks available data for segmentation, preventing analysis. Gartner, Inc. anchors 5.6B in Research, dwarfing Consulting at 559M and Events at 583M in 2024. Gartner’s heavy concentration on Research signals a dominant ecosystem lock-in strategy, while its smaller segments diversify risk modestly. The absence of Wipro’s data clouds direct comparison, but Gartner’s revenue mix clearly pivots on infrastructure dominance rather than broad diversification.
Strengths and Weaknesses Comparison
This table compares the Strengths and Weaknesses of Wipro Limited and Gartner, Inc.:
Wipro Limited Strengths
- Favorable net margin and ROE indicate solid profitability
- Strong ROIC above WACC shows efficient capital allocation
- High current and quick ratios reflect strong liquidity
- Low debt-to-equity and debt-to-assets ratios ensure financial stability
- Favorable interest coverage and fixed asset turnover ratios demonstrate operational efficiency
Gartner, Inc. Strengths
- High net margin and exceptional ROE signify superior profitability
- ROIC well above WACC confirms excellent capital returns
- Favorable quick ratio and strong interest coverage support liquidity
- High fixed asset turnover indicates efficient asset use
- Diversified revenue streams across consulting, events, and research
- Broad geographic presence with strong US and EMEA market share
Wipro Limited Weaknesses
- Price-to-book ratio is unfavorable, indicating possible overvaluation risk
- PE ratio is neutral, suggesting average market valuation
- Asset turnover is neutral, showing moderate efficiency in asset use
Gartner, Inc. Weaknesses
- Unfavorable PE and price-to-book ratios imply high valuation risks
- High debt-to-equity ratio raises leverage concerns
- Dividend yield is zero, which may deter income-focused investors
- Current ratio is neutral, reflecting modest short-term liquidity
Wipro demonstrates strong financial health and conservative leverage, underpinning steady profitability and liquidity. Gartner excels in profitability and market diversification but carries valuation and leverage risks that could affect its financial resilience.
The Moat Duel: Analyzing Competitive Defensibility
A structural moat protects long-term profits from relentless competition and market shifts. Here’s how Wipro Limited and Gartner, Inc. defend their turf:
Wipro Limited: Cost Advantage with Fading Profitability
Wipro’s moat stems from a cost advantage in IT services, reflected in steady 21% EBIT margins and 15% net margins. However, its ROIC is declining, signaling margin pressure as competition intensifies. New digital advisory offerings could either reinforce or further strain this edge in 2026.
Gartner, Inc.: Durable Network Effects and Pricing Power
Gartner enjoys network effects through premium research subscriptions and consulting. Its 68% gross margin and 20% net margin showcase strong pricing power, supported by a rising ROIC trend. Expanding conferences and international markets fuel its moat’s growth in 2026.
Cost Efficiency vs. Network Effect: The Moat Showdown
Gartner’s growing ROIC and higher margins reveal a deeper, more durable moat compared to Wipro’s eroding profitability. I believe Gartner is better positioned to defend and expand its market share amid evolving industry demands.
Which stock offers better returns?
Over the past 12 months, both Wipro Limited and Gartner, Inc. experienced significant price declines, with distinct trading volumes and trend dynamics shaping their market performance.
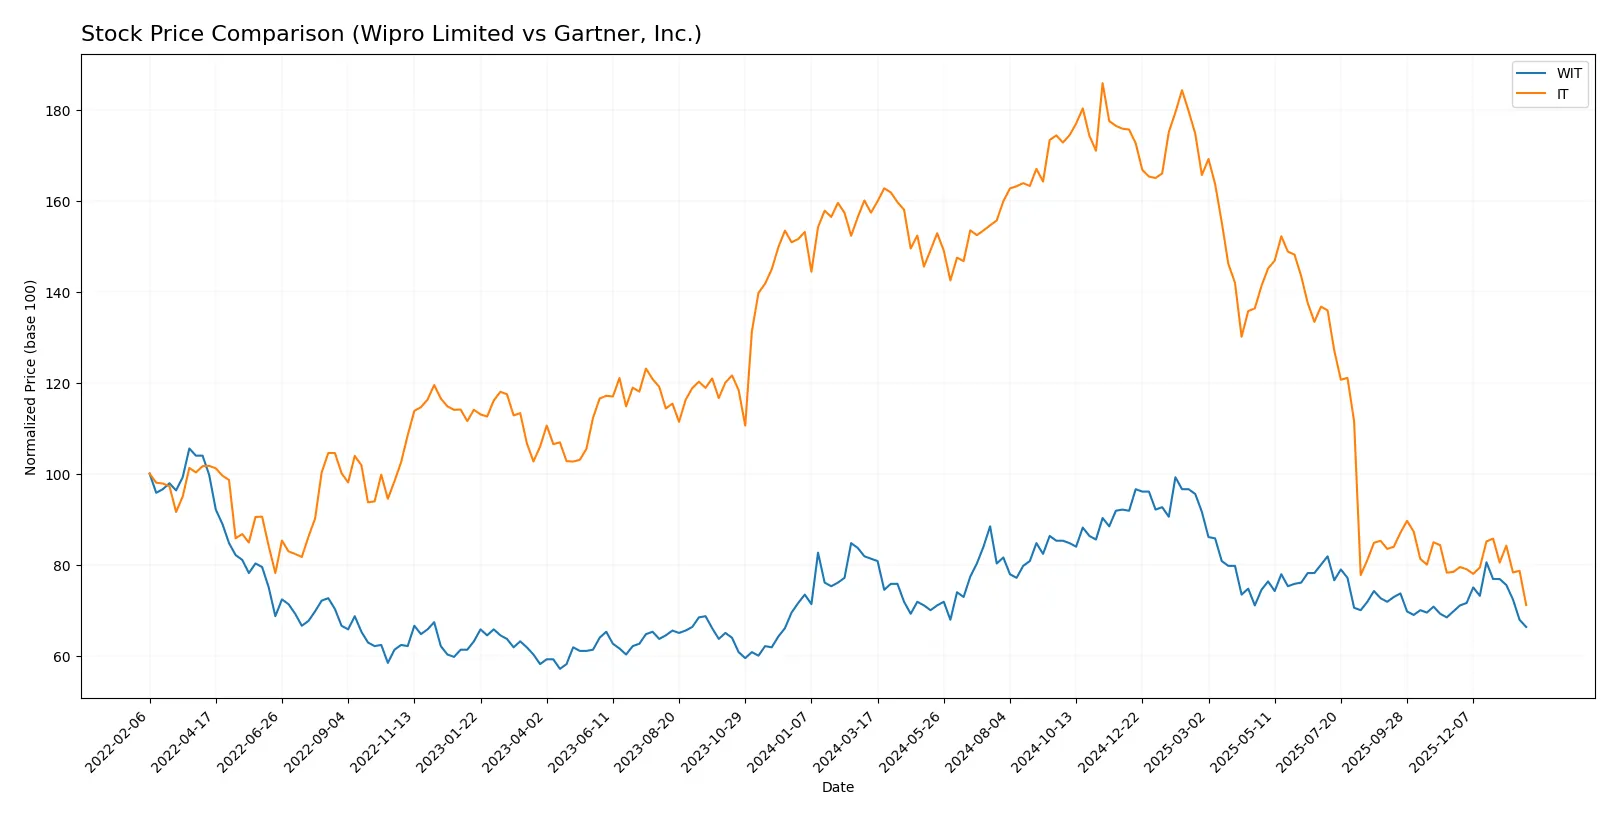
Trend Comparison
Wipro Limited’s stock declined 18.45% over the past year, reflecting a bearish trend with decelerating losses. The price fluctuated between 3.77 and 2.52, with moderate volatility (std dev 0.31).
Gartner, Inc. faced a steeper 54.78% drop, marking an accelerating bearish trend. Price ranged widely from 547.4 to 209.61, accompanied by very high volatility (std dev 105.67).
Gartner’s stock showed a more severe market downturn and higher volatility than Wipro, resulting in the lowest market performance between the two over the last 12 months.
Target Prices
Analysts show a clear bullish consensus for both Wipro Limited and Gartner, Inc., reflecting strong upside potential.
| Company | Target Low | Target High | Consensus |
|---|---|---|---|
| Wipro Limited | 7.0 | 7.7 | 7.35 |
| Gartner, Inc. | 231 | 300 | 265 |
Wipro’s target consensus at 7.35 far exceeds its current 2.52 price, suggesting significant undervaluation. Gartner’s 265 consensus also implies a roughly 26% upside from its 209.61 price, indicating robust growth expectations.

Don’t Let Luck Decide Your Entry Point
Optimize your entry points with our advanced ProRealTime indicators. You’ll get efficient buy signals with precise price targets for maximum performance. Start outperforming now!
How do institutions grade them?
Here are the recent grades assigned to Wipro Limited and Gartner, Inc. by established grading firms:
Wipro Limited Grades
The following table shows recent grade changes and actions by recognized grading companies for Wipro Limited.
| Grading Company | Action | New Grade | Date |
|---|---|---|---|
| UBS | Upgrade | Neutral | 2025-01-02 |
| Wedbush | Maintain | Underperform | 2024-01-16 |
| JP Morgan | Maintain | Underweight | 2023-05-24 |
| Bernstein | Downgrade | Underperform | 2023-03-22 |
| Bernstein | Downgrade | Underperform | 2023-03-21 |
| Goldman Sachs | Upgrade | Buy | 2022-09-13 |
| Goldman Sachs | Upgrade | Buy | 2022-09-12 |
| Morgan Stanley | Downgrade | Underweight | 2022-07-14 |
| Morgan Stanley | Downgrade | Underweight | 2022-07-13 |
| Macquarie | Upgrade | Outperform | 2022-06-02 |
Gartner, Inc. Grades
Below is a summary of recent grade assessments by reputable grading firms for Gartner, Inc.
| Grading Company | Action | New Grade | Date |
|---|---|---|---|
| UBS | Maintain | Neutral | 2026-01-09 |
| Morgan Stanley | Maintain | Equal Weight | 2025-12-17 |
| BMO Capital | Maintain | Market Perform | 2025-11-06 |
| Goldman Sachs | Maintain | Buy | 2025-11-05 |
| Wells Fargo | Maintain | Underweight | 2025-11-05 |
| Barclays | Maintain | Equal Weight | 2025-11-05 |
| UBS | Maintain | Neutral | 2025-11-05 |
| Wells Fargo | Maintain | Underweight | 2025-10-29 |
| Barclays | Downgrade | Equal Weight | 2025-10-22 |
| UBS | Maintain | Neutral | 2025-10-06 |
Which company has the best grades?
Gartner, Inc. maintains more stable and generally higher grades, including a recent Buy from Goldman Sachs. Wipro shows mixed ratings with notable downgrades and upgrades. Investors may interpret Gartner’s consistent ratings as a sign of steadier institutional confidence.
Risks specific to each company
The following categories identify the critical pressure points and systemic threats facing both firms in the 2026 market environment:
1. Market & Competition
Wipro Limited
- Faces intense competition in IT services with pressure on pricing and innovation in a crowded global market.
Gartner, Inc.
- Operates in a niche advisory and research space but faces disruption from digital platforms and emerging data analytics competitors.
2. Capital Structure & Debt
Wipro Limited
- Maintains a conservative capital structure with low debt-to-equity (0.23) and strong interest coverage (12.83).
Gartner, Inc.
- Exhibits high leverage (debt-to-equity 2.13), increasing financial risk despite decent interest coverage (11.59).
3. Stock Volatility
Wipro Limited
- Low beta (0.555) indicates less volatility and defensive characteristics in turbulent markets.
Gartner, Inc.
- Beta above 1 (1.036) suggests higher stock price sensitivity and market risk exposure.
4. Regulatory & Legal
Wipro Limited
- Subject to Indian regulatory frameworks and government contracts that can cause operational delays or compliance risks.
Gartner, Inc.
- U.S.-based with exposure to evolving data privacy laws and regulatory scrutiny in multiple jurisdictions.
5. Supply Chain & Operations
Wipro Limited
- Global IT services delivery depends on talent availability and geopolitical stability in India and abroad.
Gartner, Inc.
- Relies on digital content and expert networks, vulnerable to disruptions in data access and talent retention.
6. ESG & Climate Transition
Wipro Limited
- Growing pressure to meet ESG standards in India and global markets; moderate progress on sustainability.
Gartner, Inc.
- Increasing client demand for ESG insights but faces own operational carbon footprint challenges.
7. Geopolitical Exposure
Wipro Limited
- High exposure to India’s political environment and global trade tensions affecting offshore services.
Gartner, Inc.
- U.S. headquarters but significant international operations, subject to trade and diplomatic risks globally.
Which company shows a better risk-adjusted profile?
Wipro Limited’s low leverage, strong liquidity, and defensive beta offer a sturdier risk profile. Gartner’s high debt and stock volatility increase its financial and market risks. Wipro’s conservative capital structure and safer Altman Z-Score (5.06) contrast with Gartner’s higher leverage and greater valuation risks, signaling better risk-adjusted stability for Wipro.
Final Verdict: Which stock to choose?
Wipro Limited’s superpower lies in its robust capital efficiency and consistent value creation. Its strong balance sheet and healthy liquidity provide resilience amid market volatility. The main point of vigilance remains its slightly declining profitability trend, which warrants monitoring. It suits portfolios seeking steady growth with moderate risk tolerance.
Gartner, Inc. commands a durable moat with its exceptional ROIC growth and dominant market positioning in research and advisory services. Its premium valuation reflects confidence but comes with higher leverage and weaker liquidity than Wipro. Gartner fits well for investors prioritizing growth at a reasonable price with a tolerance for financial leverage.
If you prioritize stable capital allocation and solid balance sheet strength, Wipro Limited is the compelling choice due to its consistent value creation and liquidity buffer. However, if you seek high-growth exposure with a durable competitive advantage and can weather higher financial risk, Gartner offers superior profitability momentum and market dominance.
Disclaimer: Investment carries a risk of loss of initial capital. The past performance is not a reliable indicator of future results. Be sure to understand risks before making an investment decision.
Go Further
I encourage you to read the complete analyses of Wipro Limited and Gartner, Inc. to enhance your investment decisions: