Leidos Holdings, Inc. (LDOS) and Gartner, Inc. (IT) are both key players in the Information Technology Services sector, yet they operate with distinct business models and innovation strategies. Leidos focuses on defense, civil, and health markets with a strong emphasis on national security and technology solutions. Gartner excels in research, advisory, and consulting services, driving IT transformation worldwide. This article will help you decide which company presents the most compelling investment opportunity in 2026.
Table of contents
Companies Overview
I will begin the comparison between Leidos Holdings, Inc. and Gartner, Inc. by providing an overview of these two companies and their main differences.
Leidos Holdings, Inc. Overview
Leidos Holdings, Inc. is a technology company providing services and solutions in defense, intelligence, civil, and health markets. It serves U.S. government agencies and allies with offerings in national security, IT, and health management. Founded in 1969 and headquartered in Reston, VA, Leidos operates through Defense Solutions, Civil, and Health segments, emphasizing technology, cybersecurity, and systems integration.
Gartner, Inc. Overview
Gartner, Inc. is a research and advisory firm serving global markets including the U.S., Canada, Europe, and more. It operates three main segments: Research, Conferences, and Consulting, delivering subscription-based research, professional networking events, and IT-related consulting services. Founded in 1979 and based in Stamford, CT, Gartner focuses on IT cost optimization, digital transformation, and sourcing optimization.
Key similarities and differences
Both Leidos and Gartner operate within the information technology services industry, but their business models differ substantially. Leidos primarily delivers technology and systems solutions focused on defense and health sectors, while Gartner centers on research, advisory, and consulting services. Leidos has a broader federal government client base, whereas Gartner offers subscription and event-driven insights to business professionals globally.
Income Statement Comparison
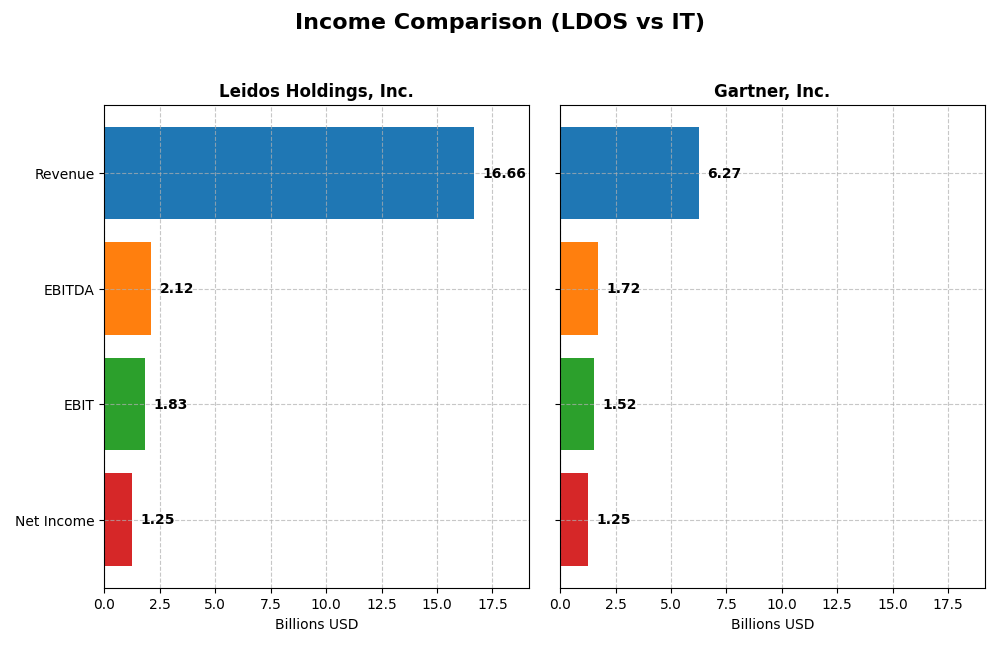
This table compares the most recent fiscal year income statement metrics for Leidos Holdings, Inc. and Gartner, Inc., highlighting key financial performance indicators.
| Metric | Leidos Holdings, Inc. | Gartner, Inc. |
|---|---|---|
| Market Cap | 24.4B | 18.3B |
| Revenue | 16.7B | 6.3B |
| EBITDA | 2.12B | 1.72B |
| EBIT | 1.83B | 1.52B |
| Net Income | 1.25B | 1.25B |
| EPS | 9.36 | 16.12 |
| Fiscal Year | 2024 | 2024 |
Income Statement Interpretations
Leidos Holdings, Inc.
Leidos Holdings, Inc. showed steady revenue growth from $12.3B in 2020 to $16.7B in 2024, nearly a 36% increase. Net income doubled over the period, reaching $1.25B in 2024. Margins improved favorably, with gross margin stable around 16.8% and net margin rising to 7.5%. The latest year saw strong profit growth despite neutral revenue growth, indicating margin expansion.
Gartner, Inc.
Gartner, Inc. experienced consistent revenue growth from $4.1B in 2020 to $6.3B in 2024, a near 53% increase. Net income rose sharply to $1.25B in 2024, reflecting a more than 3.7x growth since 2020. Margins are notably higher than Leidos, with a gross margin of 67.7% and net margin at 20%. Recent growth slowed slightly, but profitability remains strong.
Which one has the stronger fundamentals?
Both companies present favorable income statement evaluations with 85.7% favorable metrics. Leidos benefits from improving margins and strong earnings growth, while Gartner outperforms in gross and net margins with higher overall revenue and net income growth. Gartner’s slightly unfavorable operating expense growth contrasts with Leidos’s stable cost control, making fundamentals strong but distinct in focus.
Financial Ratios Comparison
The table below presents a side-by-side comparison of key financial ratios for Leidos Holdings, Inc. (LDOS) and Gartner, Inc. (IT) based on the most recent fiscal year data available (2024 for LDOS and IT).
| Ratios | Leidos Holdings, Inc. (LDOS) | Gartner, Inc. (IT) |
|---|---|---|
| ROE | 28.42% | 92.24% |
| ROIC | 13.85% | 22.39% |
| P/E | 15.72 | 30.06 |
| P/B | 4.47 | 27.73 |
| Current Ratio | 1.21 | 1.06 |
| Quick Ratio | 1.13 | 1.06 |
| D/E (Debt-to-Equity) | 1.20 | 2.13 |
| Debt-to-Assets | 40.38% | 33.98% |
| Interest Coverage | 9.47 | 8.82 |
| Asset Turnover | 1.27 | 0.73 |
| Fixed Asset Turnover | 10.74 | 12.53 |
| Payout Ratio | 16.59% | 0% |
| Dividend Yield | 1.05% | 0% |
Interpretation of the Ratios
Leidos Holdings, Inc.
Leidos shows a balanced ratio profile with favorable returns on equity (28.42%) and invested capital (13.85%), supported by a healthy interest coverage of 9.49. However, the price-to-book ratio at 4.47 and debt-to-equity ratio of 1.2 are less positive. The dividend yield stands at 1.05%, indicating a modest payout with no immediate concerns on sustainability.
Gartner, Inc.
Gartner exhibits strong profitability with a net margin of 20% and an exceptionally high return on equity of 92.24%. Despite this, valuation multiples such as P/E at 30.06 and P/B at 27.73 appear stretched, and the debt-to-equity ratio of 2.13 is elevated. The company does not pay dividends, likely reflecting reinvestment priorities or growth strategy.
Which one has the best ratios?
Both companies have a slightly favorable overall ratio assessment, but Leidos presents a more balanced financial structure with fewer unfavorable indicators. Gartner’s superior profitability is offset by higher leverage and valuation concerns. The choice depends on investor preference for stability versus growth potential, given these contrasting ratio profiles.
Strategic Positioning
This section compares the strategic positioning of Leidos Holdings, Inc. and Gartner, Inc. in terms of Market position, Key segments, and Exposure to technological disruption:
Leidos Holdings, Inc.
- Established leader in defense, intelligence, civil, and health markets facing government and commercial competition.
- Diverse segments: Defense Solutions, Civil, and Health driving growth with large-scale national security and IT services.
- Operates in technology, systems integration, cybersecurity, and digital transformation with moderate disruption risk.
Gartner, Inc.
- Research and advisory leader with a subscription-based model serving global IT professionals and enterprises.
- Three segments: Research, Conferences, and Consulting focused on IT priorities and market research.
- Focused on IT research and advisory services, exposed to disruption through digital transformation demands.
Leidos Holdings, Inc. vs Gartner, Inc. Positioning
Leidos pursues a diversified strategy across defense, civil, and health sectors, leveraging government contracts and technology solutions. Gartner concentrates on IT research and consulting services, relying on subscription and event revenues. Diversification offers stability, while concentration targets specialized IT advisory demand.
Which has the best competitive advantage?
Both companies show a very favorable MOAT with growing ROIC above WACC, indicating durable competitive advantages. Gartner’s higher ROIC growth suggests a stronger value creation and efficiency in capital use compared to Leidos.
Stock Comparison
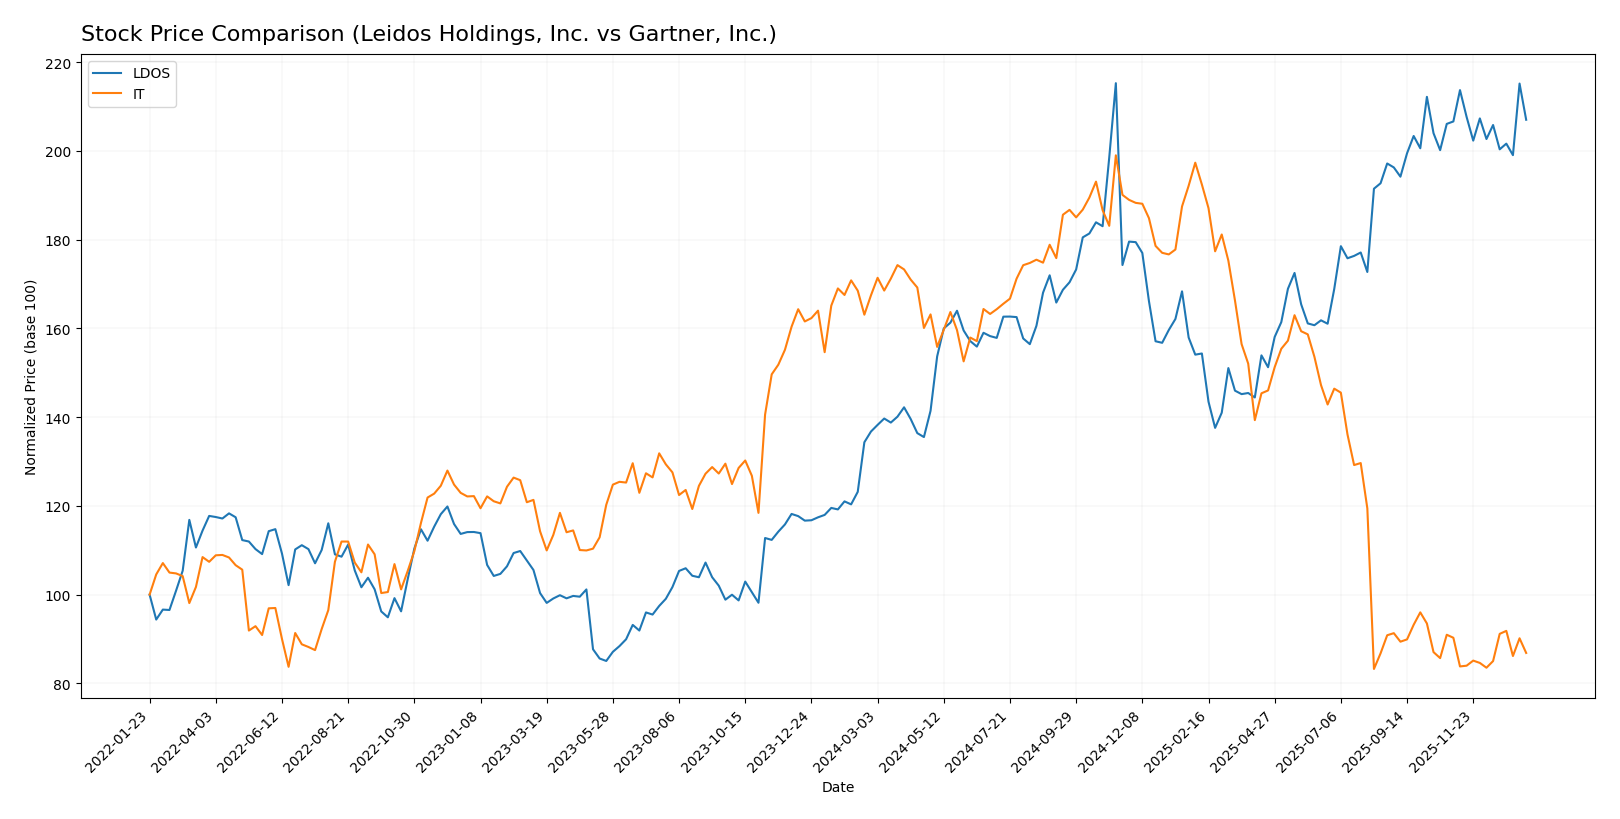
The stock price movements of Leidos Holdings, Inc. (LDOS) and Gartner, Inc. (IT) over the past 12 months reveal contrasting market dynamics, with LDOS showing significant gains and IT experiencing notable declines amid varying trading volumes.
Trend Analysis
Leidos Holdings, Inc. (LDOS) exhibited a bullish trend over the past year with a 51.37% price increase, though the rate of growth has decelerated recently. Price volatility was moderate, with a standard deviation of 20.61.
Gartner, Inc. (IT) showed a bearish trend marked by a 48.13% price decrease over the same period, with accelerating downside momentum. Volatility was high, as reflected by a standard deviation of 102.51.
Comparing both stocks, LDOS delivered the highest market performance with a strong positive return, while IT’s stock price declined significantly, indicating contrasting investor sentiment and market positioning.
Target Prices
The current analyst consensus indicates optimistic target prices for both Leidos Holdings, Inc. and Gartner, Inc.
| Company | Target High | Target Low | Consensus |
|---|---|---|---|
| Leidos Holdings, Inc. | 230 | 216 | 222.2 |
| Gartner, Inc. | 300 | 231 | 265 |
Analysts expect Leidos Holdings’ stock to appreciate from its current price of $190.82, with consensus targets well above. Gartner’s consensus target price of $265 also suggests significant upside from the current $238.93 trading level.
Analyst Opinions Comparison
This section compares analysts’ ratings and grades for Leidos Holdings, Inc. and Gartner, Inc.:
Rating Comparison
Leidos Holdings, Inc. Rating
- Rating: B+, rated as Very Favorable overall
- Discounted Cash Flow Score: 4, considered Favorable
- Return on Equity Score: 5, considered Very Favorable
- Return on Assets Score: 4, considered Favorable
- Debt To Equity Score: 1, considered Very Unfavorable indicating higher financial risk
- Overall Score: 3, considered Moderate
Gartner, Inc. Rating
- Rating: B+, rated as Very Favorable overall
- Discounted Cash Flow Score: 5, considered Very Favorable
- Return on Equity Score: 5, considered Very Favorable
- Return on Assets Score: 5, considered Very Favorable
- Debt To Equity Score: 1, considered Very Unfavorable indicating higher financial risk
- Overall Score: 3, considered Moderate
Which one is the best rated?
Both companies share the same overall rating of B+ and a moderate overall score of 3. However, Gartner scores higher in discounted cash flow and return on assets, suggesting slightly stronger financial efficiency compared to Leidos, while both have the same financial risk level.
Scores Comparison
Here is a comparison of the financial scores for Leidos Holdings, Inc. and Gartner, Inc.:
Leidos Holdings, Inc. Scores
- Altman Z-Score: 4.15, indicating a safe zone, low bankruptcy risk.
- Piotroski Score: 8, classified as very strong financial health.
Gartner, Inc. Scores
- Altman Z-Score: 4.13, indicating a safe zone, low bankruptcy risk.
- Piotroski Score: 6, classified as average financial health.
Which company has the best scores?
Leidos Holdings shows a slightly higher Altman Z-Score and a significantly stronger Piotroski Score than Gartner. Based on these scores alone, Leidos exhibits stronger financial health and lower bankruptcy risk compared to Gartner.
Grades Comparison
Here is the comparison of recent grades assigned to Leidos Holdings, Inc. and Gartner, Inc.:
Leidos Holdings, Inc. Grades
The table below presents recent grades from reputable financial institutions for Leidos Holdings, Inc.
| Grading Company | Action | New Grade | Date |
|---|---|---|---|
| Citigroup | Maintain | Buy | 2026-01-13 |
| Stifel | Downgrade | Hold | 2026-01-08 |
| B of A Securities | Maintain | Buy | 2025-11-07 |
| Truist Securities | Maintain | Buy | 2025-11-05 |
| UBS | Maintain | Neutral | 2025-11-05 |
| Cantor Fitzgerald | Maintain | Overweight | 2025-10-31 |
| Argus Research | Maintain | Buy | 2025-09-24 |
| B of A Securities | Maintain | Buy | 2025-09-04 |
| RBC Capital | Upgrade | Outperform | 2025-09-04 |
| UBS | Maintain | Neutral | 2025-08-07 |
Overall, Leidos Holdings shows a predominantly positive grading trend with multiple “Buy” and “Outperform” ratings, alongside some neutral and one “Hold” downgrade.
Gartner, Inc. Grades
The table below presents recent grades from reputable financial institutions for Gartner, Inc.
| Grading Company | Action | New Grade | Date |
|---|---|---|---|
| UBS | Maintain | Neutral | 2026-01-09 |
| Morgan Stanley | Maintain | Equal Weight | 2025-12-17 |
| BMO Capital | Maintain | Market Perform | 2025-11-06 |
| UBS | Maintain | Neutral | 2025-11-05 |
| Goldman Sachs | Maintain | Buy | 2025-11-05 |
| Wells Fargo | Maintain | Underweight | 2025-11-05 |
| Barclays | Maintain | Equal Weight | 2025-11-05 |
| Wells Fargo | Maintain | Underweight | 2025-10-29 |
| Barclays | Downgrade | Equal Weight | 2025-10-22 |
| UBS | Maintain | Neutral | 2025-10-06 |
Gartner’s grades show a mixed pattern with several “Neutral” and “Equal Weight” ratings, some “Underweight” recommendations, and fewer “Buy” ratings.
Which company has the best grades?
Leidos Holdings, Inc. has received stronger and more consistent buy-oriented grades compared to Gartner, Inc., which displays a more cautious consensus. This difference may affect investor perception of growth potential and risk.
Strengths and Weaknesses
The table below summarizes key strengths and weaknesses of Leidos Holdings, Inc. (LDOS) and Gartner, Inc. (IT) based on their latest financial performance and market positioning.
| Criterion | Leidos Holdings, Inc. (LDOS) | Gartner, Inc. (IT) |
|---|---|---|
| Diversification | Strong with multiple segments: National Security (9.55B), Defense (2.03B), Civil (4.99B) | Moderate, focused on Research (5.13B), Consulting (558M), Events (583M) |
| Profitability | Moderate net margin 7.53%, ROE 28.42%, ROIC 13.85%, slightly favorable overall | High net margin 20%, ROE 92.24%, ROIC 22.39%, very favorable profitability |
| Innovation | Demonstrates durable competitive advantage with growing ROIC (7.98% above WACC) | Strong durable moat with very high ROIC growth (14.3% above WACC), innovation in research segment |
| Global presence | Established in defense and civil markets, global government contracts | Global footprint in IT research and consulting services, strong brand recognition |
| Market Share | Solid position in defense and national security sectors | Leading market share in IT research and advisory services |
Key takeaways: Leidos offers strong diversification and steady profitability in government-related sectors, while Gartner excels in profitability and innovation in IT research. Both show durable competitive advantages but differ in market focus and growth dynamics.
Risk Analysis
Below is a comparative table of key risk factors affecting Leidos Holdings, Inc. (LDOS) and Gartner, Inc. (IT) based on the latest available data from 2024.
| Metric | Leidos Holdings, Inc. (LDOS) | Gartner, Inc. (IT) |
|---|---|---|
| Market Risk | Beta 0.59 (lower volatility) | Beta 1.07 (market-correlated) |
| Debt level | Debt-to-Equity 1.2 (high) | Debt-to-Equity 2.13 (very high) |
| Regulatory Risk | Moderate (government contracts) | Moderate (global advisory services) |
| Operational Risk | Medium (defense & IT services complexity) | Medium (dependency on subscription and events) |
| Environmental Risk | Low (mainly IT services) | Low (primarily consulting and research) |
| Geopolitical Risk | High (significant defense & international contracts) | Moderate (global footprint but less defense exposure) |
The most impactful risks are the high debt levels of both companies, particularly Gartner’s notably high debt-to-equity ratio of 2.13, which increases financial risk. Leidos faces significant geopolitical risk due to its defense contracts and reliance on U.S. government spending. Both companies maintain stable operational and regulatory risk profiles, while environmental risks remain low given their service-based business models. Investors should closely monitor debt management and geopolitical developments when considering these stocks.
Which Stock to Choose?
Leidos Holdings, Inc. (LDOS) has shown favorable income growth with a 7.93% revenue increase in 2024 and strong profitability, including a 28.42% ROE and 13.85% ROIC. Its debt level is somewhat high (D/E 1.2) but manageable, and it holds a very favorable B+ rating with a very strong Piotroski score and safe Altman Z-Score.
Gartner, Inc. (IT) demonstrates robust income evolution with a 6.1% revenue growth and excellent profitability, marked by a 92.24% ROE and 22.39% ROIC. However, it carries higher leverage (D/E 2.13) and has a slightly less favorable B+ rating, with an average Piotroski score despite a safe Altman Z-Score.
Investors seeking durable competitive advantage and growth might find IT’s superior profitability and rising ROIC appealing, while those prioritizing financial stability and a stronger Piotroski score may see LDOS as more favorable. Both stocks show slightly favorable financial ratios and very favorable ratings, suggesting a choice may depend on risk tolerance and investment style.
Disclaimer: Investment carries a risk of loss of initial capital. The past performance is not a reliable indicator of future results. Be sure to understand risks before making an investment decision.
Go Further
I encourage you to read the complete analyses of Leidos Holdings, Inc. and Gartner, Inc. to enhance your investment decisions: