In the dynamic world of information technology services, Gartner, Inc. and Jack Henry & Associates, Inc. stand out as influential players with distinct yet overlapping market footprints. Gartner excels in research and advisory services, while Jack Henry focuses on technology solutions for financial institutions. Comparing their innovation strategies and market approaches reveals valuable insights. Join me as we explore which company presents the most compelling opportunity for investors in 2026.

Table of contents
Companies Overview
I will begin the comparison between Gartner and Jack Henry & Associates by providing an overview of these two companies and their main differences.
Gartner Overview
Gartner, Inc. is a global research and advisory company serving clients in the US, Canada, Europe, the Middle East, Africa, and beyond. Founded in 1979 and headquartered in Stamford, Connecticut, it operates through Research, Conferences, and Consulting segments. Gartner focuses on providing subscription-based research, networking opportunities, and actionable IT solutions, positioning itself as a key player in information technology services.
Jack Henry & Associates Overview
Jack Henry & Associates, Inc., founded in 1976 and based in Monett, Missouri, delivers technology and payment processing services primarily to US financial institutions. Operating across Core, Payments, Complementary, and Corporate segments, it offers integrated banking and credit union solutions under multiple brands. Its focus is on supporting financial organizations with core processing, digital products, and specialized financial services.
Key similarities and differences
Both companies operate in the information technology services sector, targeting business clients with technology-driven solutions. Gartner emphasizes research, advisory, and consulting services globally, while Jack Henry & Associates concentrates on technology and payment processing tailored to US financial institutions. Gartner’s business model centers on subscription and event revenue, whereas Jack Henry’s relies on integrated software and processing services for banking clients.
Income Statement Comparison
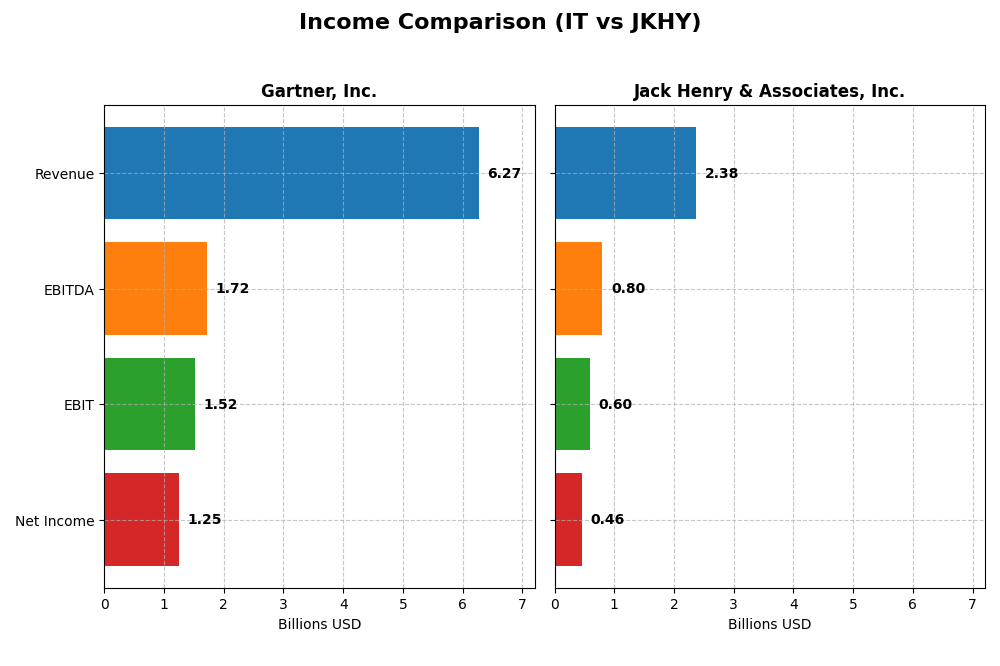
The table below compares key income statement metrics for Gartner, Inc. and Jack Henry & Associates, Inc. based on their most recent fiscal year data.
| Metric | Gartner, Inc. (IT) | Jack Henry & Associates, Inc. (JKHY) |
|---|---|---|
| Market Cap | 18.3B | 14.0B |
| Revenue | 6.27B | 2.38B |
| EBITDA | 1.72B | 801M |
| EBIT | 1.52B | 596M |
| Net Income | 1.25B | 456M |
| EPS | 16.12 | 6.24 |
| Fiscal Year | 2024 | 2025 |
Income Statement Interpretations
Gartner, Inc.
Gartner, Inc. has demonstrated a consistent upward trend in revenue and net income from 2020 to 2024, with revenue increasing by 53% and net income surging over 370%. Margins have improved significantly, with a gross margin of 67.7% and a net margin of 20% in 2024. The latest year saw a 6.1% revenue growth, strong EBIT growth at 18.6%, and a remarkable 33.9% increase in net margin, highlighting improved profitability.
Jack Henry & Associates, Inc.
Jack Henry & Associates, Inc. showed steady growth in revenue and net income from 2021 to 2025, with revenue up 35% and net income rising 46%. Margins remain favorable, including a gross margin of 42.7% and a net margin near 19.2% in 2025. The most recent fiscal year recorded a 7.2% revenue increase, solid EBIT growth of 16%, and an 11.3% net margin improvement, indicating stable operational efficiency.
Which one has the stronger fundamentals?
Both companies display favorable income statement fundamentals with strong margin profiles and positive growth trends. Gartner boasts higher gross and net margins with more pronounced net income growth, while Jack Henry maintains consistent margin stability with lower interest expenses. Gartner’s substantial EPS growth contrasts with Jack Henry’s steadier but solid earnings expansion, reflecting different growth dynamics within the same sector.
Financial Ratios Comparison
The table below presents a side-by-side comparison of key financial ratios for Gartner, Inc. and Jack Henry & Associates, Inc., based on their most recent fiscal data.
| Ratios | Gartner, Inc. (IT) 2024 FY | Jack Henry & Associates, Inc. (JKHY) 2025 FY |
|---|---|---|
| ROE | 92.2% | 21.4% |
| ROIC | 22.4% | 17.6% |
| P/E | 30.1 | 28.9 |
| P/B | 27.7 | 6.18 |
| Current Ratio | 1.06 | 1.27 |
| Quick Ratio | 1.06 | 1.27 |
| D/E | 2.13 | 0.00 |
| Debt-to-Assets | 34.0% | 0.00% |
| Interest Coverage | 8.82 | 54.5 |
| Asset Turnover | 0.73 | 0.78 |
| Fixed Asset Turnover | 12.5 | 10.7 |
| Payout ratio | 0% | 36.1% |
| Dividend yield | 0% | 1.25% |
Interpretation of the Ratios
Gartner, Inc.
Gartner exhibits a strong net margin of 20% and an exceptional return on equity of 92.24%, indicating high profitability. However, its high price-to-book ratio of 27.73 and debt-to-equity ratio of 2.13 raise concerns regarding valuation and leverage. The company does not pay dividends, likely focusing on reinvestment and growth strategies, as indicated by zero dividend yield and no payout activity.
Jack Henry & Associates, Inc.
Jack Henry shows solid profitability with a 19.19% net margin and a reasonable return on equity of 21.39%. Its debt levels are minimal, with a debt-to-equity ratio of zero, reflecting a conservative capital structure. The company pays dividends, with a 1.25% yield, supported by stable free cash flow, suggesting a balanced approach to shareholder returns without excessive risk from distributions or buybacks.
Which one has the best ratios?
Jack Henry’s ratios are generally more favorable, with 64.29% of its metrics rated positively, including strong liquidity and low leverage. Gartner, while profitable and with strong returns, has more unfavorable ratios (28.57%) and higher leverage concerns. Jack Henry’s dividend payments and conservative financial management contrast with Gartner’s no-dividend stance and higher valuation multiples.
Strategic Positioning
This section compares the strategic positioning of Gartner, Inc. and Jack Henry & Associates, Inc., focusing on market position, key segments, and exposure to technological disruption:
Gartner, Inc.
- Leading global research and advisory firm facing broad IT services competition.
- Revenue driven by Research (5.13B), Consulting (559M), and Conferences (583M).
- Moderate exposure through digital transformation consulting and IT sourcing.
Jack Henry & Associates, Inc.
- Specialized U.S. financial technology provider with focused competitive pressure.
- Revenue from Core banking, Payments, and Complementary segments, totaling around 2.4B.
- Exposure via evolving payment technologies and integrated financial solutions.
Gartner, Inc. vs Jack Henry & Associates, Inc. Positioning
Gartner pursues a diversified model across research, consulting, and events with a global footprint, while Jack Henry concentrates on U.S. financial institutions with core banking and payment processing. Gartner’s broad services contrast with Jack Henry’s niche focus.
Which has the best competitive advantage?
Both companies demonstrate a very favorable moat with growing ROIC above WACC, indicating durable competitive advantages. Gartner shows a higher ROIC growth, suggesting a stronger value-creation capacity relative to Jack Henry.
Stock Comparison
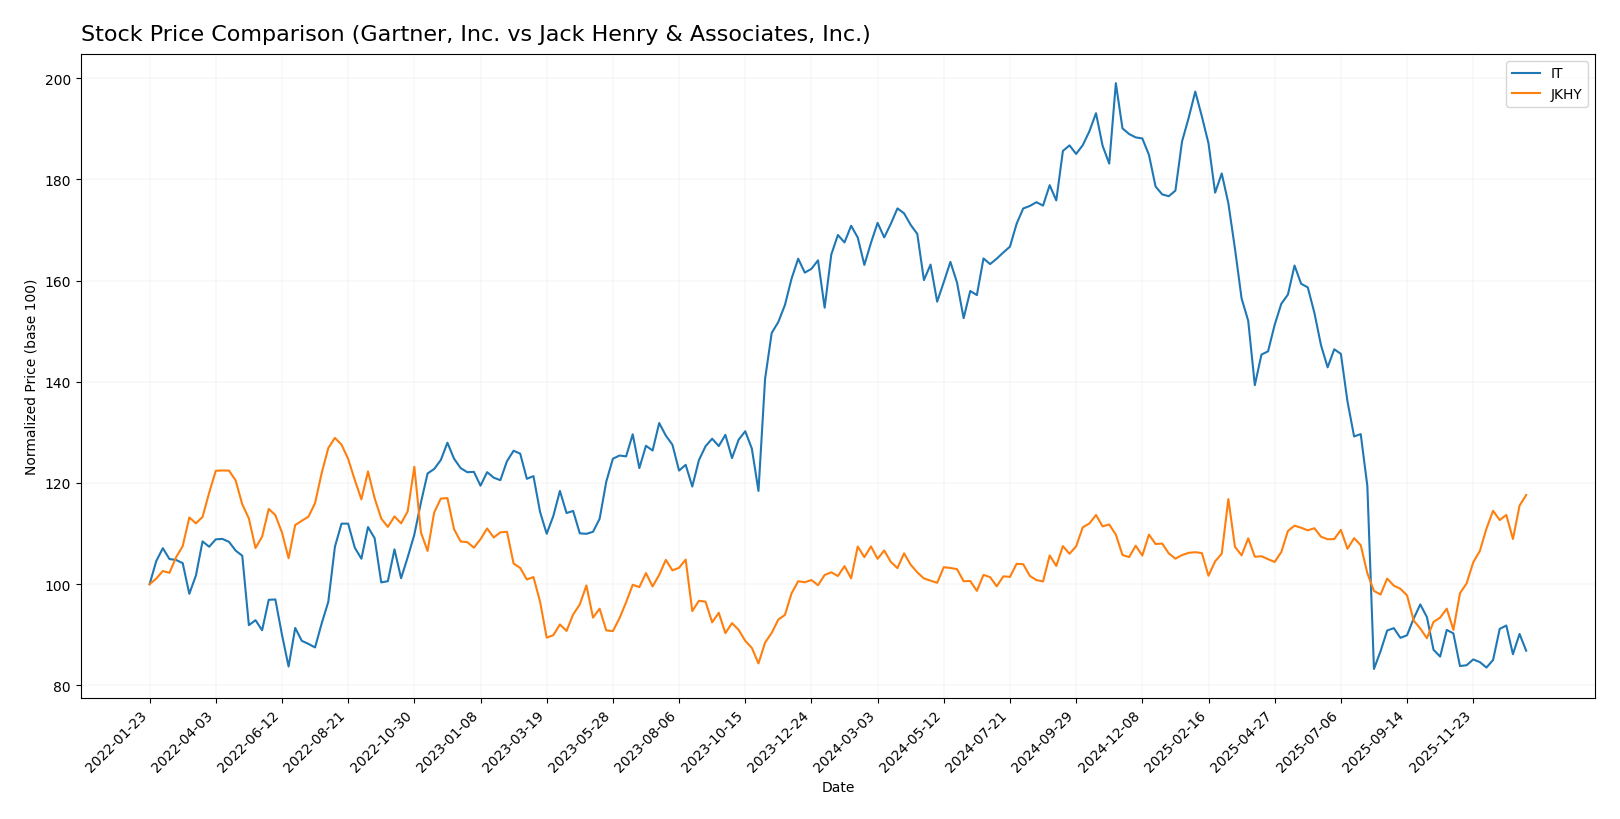
The stock price movements over the past 12 months reveal contrasting dynamics, with Gartner, Inc. showing a significant decline and Jack Henry & Associates, Inc. exhibiting a steady upward trajectory marked by accelerating trends and notable price ranges.
Trend Analysis
Gartner, Inc. (IT) experienced a bearish trend with a -48.13% price change over the past year, showing acceleration and high volatility (std deviation 102.51). The stock hit a high of 547.4 and a low of 229.0.
Jack Henry & Associates, Inc. (JKHY) demonstrated a bullish trend with a 9.46% gain over the past year, also accelerating. Volatility was moderate (std deviation 9.15), with prices ranging from 146.26 to 192.6.
Comparing both, JKHY delivered the highest market performance with a positive 9.46% return, contrasting with IT’s significant decline over the same period.
Target Prices
The current analyst consensus indicates promising upside potential for both Gartner, Inc. and Jack Henry & Associates, Inc.
| Company | Target High | Target Low | Consensus |
|---|---|---|---|
| Gartner, Inc. | 300 | 231 | 265 |
| Jack Henry & Associates, Inc. | 220 | 161 | 196 |
Analysts expect Gartner’s stock to rise moderately above its current price of $238.93, while Jack Henry’s consensus target suggests a slight increase from $192.60. Both show potential for appreciation within their respective ranges.
Analyst Opinions Comparison
This section compares analysts’ ratings and grades for Gartner, Inc. (IT) and Jack Henry & Associates, Inc. (JKHY):
Rating Comparison
IT Rating
- Rating: B+ with a very favorable status.
- Discounted Cash Flow Score: 5, indicating very favorable valuation based on future cash flows.
- ROE Score: 5, very favorable, showing efficient profit generation from equity.
- ROA Score: 5, very favorable, reflecting effective asset utilization.
- Debt To Equity Score: 1, very unfavorable, indicating higher financial risk due to debt levels.
- Overall Score: 3, moderate, indicating an average overall financial standing.
JKHY Rating
- Rating: A- with a very favorable status.
- Discounted Cash Flow Score: 4, favorable valuation based on future cash flows.
- ROE Score: 4, favorable, indicating strong profit generation from equity.
- ROA Score: 5, very favorable, showing effective use of assets to generate earnings.
- Debt To Equity Score: 4, favorable, reflecting lower financial risk with controlled debt levels.
- Overall Score: 4, favorable, suggesting stronger overall financial performance.
Which one is the best rated?
Based strictly on the provided data, JKHY is better rated overall with an A- rating and favorable scores across most categories, while IT has a lower B+ rating and a very unfavorable debt-to-equity score, lowering its overall assessment.
Scores Comparison
The comparison of scores for Gartner, Inc. and Jack Henry & Associates, Inc. is as follows:
Gartner, Inc. Scores
- Altman Z-Score: 4.13, indicating a safe zone for bankruptcy risk.
- Piotroski Score: 6, reflecting average financial strength.
Jack Henry & Associates, Inc. Scores
- Altman Z-Score: 12.58, well within the safe zone.
- Piotroski Score: 8, indicating very strong financial health.
Which company has the best scores?
Jack Henry & Associates, Inc. shows stronger financial health with a significantly higher Altman Z-Score and a very strong Piotroski Score compared to Gartner, Inc.’s scores, which indicate average financial strength and a safe bankruptcy risk zone.
Grades Comparison
Here is the comparison of recent analyst grades for Gartner, Inc. and Jack Henry & Associates, Inc.:
Gartner, Inc. Grades
The table below shows recent grades from major financial institutions for Gartner, Inc.:
| Grading Company | Action | New Grade | Date |
|---|---|---|---|
| UBS | Maintain | Neutral | 2026-01-09 |
| Morgan Stanley | Maintain | Equal Weight | 2025-12-17 |
| BMO Capital | Maintain | Market Perform | 2025-11-06 |
| UBS | Maintain | Neutral | 2025-11-05 |
| Goldman Sachs | Maintain | Buy | 2025-11-05 |
| Wells Fargo | Maintain | Underweight | 2025-11-05 |
| Barclays | Maintain | Equal Weight | 2025-11-05 |
| Wells Fargo | Maintain | Underweight | 2025-10-29 |
| Barclays | Downgrade | Equal Weight | 2025-10-22 |
| UBS | Maintain | Neutral | 2025-10-06 |
Overall, Gartner, Inc.’s ratings predominantly range from Neutral to Hold, with few Buy recommendations and some Underweight positions.
Jack Henry & Associates, Inc. Grades
The table below presents the latest grades from notable analysts for Jack Henry & Associates, Inc.:
| Grading Company | Action | New Grade | Date |
|---|---|---|---|
| Wolfe Research | Upgrade | Outperform | 2026-01-08 |
| UBS | Maintain | Neutral | 2026-01-08 |
| RBC Capital | Upgrade | Outperform | 2025-12-16 |
| Baird | Maintain | Neutral | 2025-12-15 |
| Keefe, Bruyette & Woods | Upgrade | Outperform | 2025-12-08 |
| Goldman Sachs | Maintain | Neutral | 2025-11-07 |
| Wells Fargo | Maintain | Equal Weight | 2025-11-06 |
| Compass Point | Upgrade | Buy | 2025-11-06 |
| DA Davidson | Maintain | Buy | 2025-10-29 |
| Goldman Sachs | Maintain | Neutral | 2025-10-13 |
Jack Henry & Associates, Inc. shows a clear trend toward Outperform and Buy ratings, with several recent upgrades from analysts.
Which company has the best grades?
Jack Henry & Associates, Inc. has generally received stronger grades and more upgrades than Gartner, Inc., which mostly holds Neutral or Hold ratings. This difference may influence investors seeking higher growth potential or more favorable analyst sentiment.
Strengths and Weaknesses
Below is a comparison table highlighting the key strengths and weaknesses of Gartner, Inc. (IT) and Jack Henry & Associates, Inc. (JKHY) based on the most recent data available.
| Criterion | Gartner, Inc. (IT) | Jack Henry & Associates, Inc. (JKHY) |
|---|---|---|
| Diversification | Strong across Consulting, Events, and Research segments with Research being dominant (~5.1B USD in 2024) | Diversified in Payments, Core, and Complementary segments, with Payments leading (~873M USD in 2025) |
| Profitability | High ROIC (22.4%) and ROE (92.2%), net margin 20%, but high valuation multiples (PE 30, PB 27.7) | Solid ROIC (17.6%), ROE (21.4%), net margin 19.2%, more reasonable valuation (PE 28.9, PB 6.18) |
| Innovation | Consistent growth in ROIC (+150% trend), strong research focus supports innovation | Moderate ROIC growth (+8%), innovation driven by payments tech but less pronounced than IT |
| Global presence | Significant global footprint through research & consulting services | Primarily US-focused banking and payments systems with growing complementary services |
| Market Share | Leading position in IT research and advisory services | Strong presence in US financial tech market, especially in banking software and payment solutions |
Gartner excels in profitability and innovation with a very favorable economic moat, though it carries high valuation multiples and moderate debt. Jack Henry offers a balanced profile with solid profitability, lower leverage, and favorable valuation, making it attractive for investors prioritizing stability and steady growth.
Risk Analysis
Below is a comparison of key risk factors for Gartner, Inc. (IT) and Jack Henry & Associates, Inc. (JKHY) based on the most recent data available.
| Metric | Gartner, Inc. (IT) | Jack Henry & Associates, Inc. (JKHY) |
|---|---|---|
| Market Risk | Beta 1.07; moderate volatility, broad tech sector exposure | Beta 0.73; lower volatility, niche financial tech focus |
| Debt level | Debt-to-Equity 2.13 (unfavorable); moderate leverage risk | Debt-to-Equity 0 (favorable); no debt, low financial risk |
| Regulatory Risk | Moderate; operates internationally, subject to data/privacy laws | Moderate; US-focused financial regulations, compliance critical |
| Operational Risk | Medium; complex services across multiple segments | Medium-low; specialized tech solutions with stable client base |
| Environmental Risk | Low; primarily service-based, minimal direct environmental impact | Low; software-focused, limited environmental footprint |
| Geopolitical Risk | Moderate; global presence exposes to geopolitical tensions | Low; primarily US market, less geopolitical exposure |
Gartner faces notable leverage risk with a higher debt level, which could impact financial flexibility. Both companies have moderate regulatory and operational risks typical of their technology sectors. Jack Henry’s no-debt position and lower market volatility reduce its financial and market risks. Geopolitical tensions have more impact on Gartner due to its global operations. Overall, debt and market volatility are the most impactful risks to monitor.
Which Stock to Choose?
Gartner, Inc. (IT) shows a favorable income evolution with 52.9% revenue growth over five years and strong profitability metrics including a 20.0% net margin and a 92.24% ROE. The company carries moderate debt with a net debt to EBITDA of 0.56 and holds a very favorable B+ rating.
Jack Henry & Associates, Inc. (JKHY) also demonstrates positive income growth, with 35.1% revenue increase over five years and a solid 19.19% net margin. It maintains negligible debt levels—net debt to EBITDA below zero—and earns a favorable A- rating, supported by robust financial ratios.
Investors favoring strong profitability and high returns on equity might find Gartner appealing due to its exceptional ROE and income growth, whereas those prioritizing financial stability and moderate valuations could view Jack Henry as more suitable given its low debt and favorable rating. The investment preference may therefore depend on the investor’s risk tolerance and focus on growth versus stability.
Disclaimer: Investment carries a risk of loss of initial capital. The past performance is not a reliable indicator of future results. Be sure to understand risks before making an investment decision.
Go Further
I encourage you to read the complete analyses of Gartner, Inc. and Jack Henry & Associates, Inc. to enhance your investment decisions: