Home > Comparison > Technology > IBM vs IT
The strategic rivalry between International Business Machines Corporation (IBM) and Gartner, Inc. shapes the evolution of the technology sector. IBM operates as a capital-intensive, diversified technology services provider with strengths in hybrid cloud and AI solutions. Gartner, by contrast, is a high-margin research and advisory firm focused on IT insights and consulting. This analysis will assess which model delivers superior risk-adjusted returns, guiding portfolio allocation in an increasingly technology-driven economy.
Table of contents
Companies Overview
International Business Machines Corporation and Gartner, Inc. hold pivotal roles in the information technology services sector, shaping industry trends globally.
International Business Machines Corporation: Integrated Solutions Powerhouse
IBM dominates as a technology services leader, generating revenue through Software, Consulting, Infrastructure, and Financing. Its core strength lies in hybrid cloud platforms and enterprise software, including Red Hat and AI-driven solutions. In 2026, IBM focuses strategically on expanding its hybrid cloud infrastructure and business transformation consulting to drive sustainable growth.
Gartner, Inc.: Premier Research and Advisory Firm
Gartner excels as a research and advisory powerhouse, monetizing through subscription-based research, conferences, and consulting services. Its offerings empower IT decision-makers with data-driven insights and actionable solutions. In 2026, Gartner prioritizes digital transformation advisory and IT cost optimization to enhance client value and market penetration.
Strategic Collision: Similarities & Divergences
IBM and Gartner share a commitment to enabling IT innovation but diverge sharply in approach: IBM builds a closed ecosystem of integrated technology solutions, while Gartner operates as an open advisory platform. Their competition centers on influencing enterprise IT strategy—IBM through direct technology deployment, Gartner via expert guidance. This contrast defines their unique investment profiles: one rooted in tangible infrastructure, the other in intellectual capital.
Income Statement Comparison
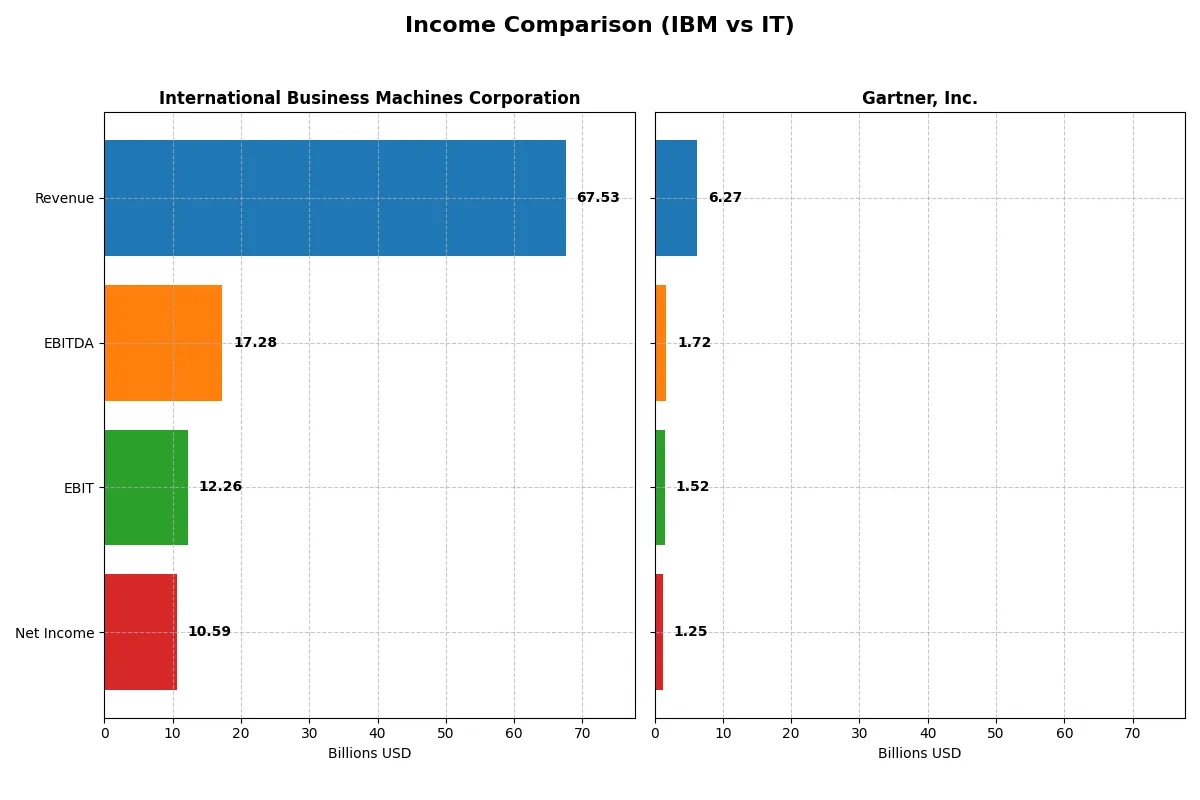
This data dissects the core profitability and scalability of both corporate engines to reveal who dominates the bottom line:
| Metric | International Business Machines Corporation (IBM) | Gartner, Inc. (IT) |
|---|---|---|
| Revenue | 67.5B | 6.27B |
| Cost of Revenue | 27.4B | 2.02B |
| Operating Expenses | 29.9B | 3.09B |
| Gross Profit | 40.2B | 4.24B |
| EBITDA | 17.3B | 1.72B |
| EBIT | 12.3B | 1.52B |
| Interest Expense | 1.94B | 131M |
| Net Income | 10.6B | 1.25B |
| EPS | 11.36 | 16.12 |
| Fiscal Year | 2025 | 2024 |
Income Statement Analysis: The Bottom-Line Duel
This income statement comparison reveals which company operates with greater efficiency and sustainable profitability in a competitive environment.
International Business Machines Corporation Analysis
IBM’s revenue grew steadily from $57.4B in 2021 to $67.5B in 2025, while net income more than doubled from $5.7B to $10.6B. Gross and net margins remain robust at 59.5% and 15.7%, respectively. In 2025, IBM’s EBIT surged 63%, reflecting improved operational efficiency despite a slight uptick in operating expenses.
Gartner, Inc. Analysis
Gartner’s revenue expanded from $4.1B in 2020 to $6.3B in 2024, with net income accelerating sharply from $267M to $1.25B. Its gross margin leads at 67.7%, complemented by a strong net margin of 20%. The 2024 financials show solid momentum in EBIT growth (19%) and sustained margin expansion, underscoring disciplined cost management.
Margin Strength vs. Growth Trajectory
IBM commands scale and consistent margin improvements, doubling net income over five years with a solid 15.7% net margin. Gartner exhibits higher margin percentages and faster net income growth, quadrupling profits within four years. For investors, IBM offers stable earnings power, while Gartner’s rapid profitability gains suggest strong growth potential.
Financial Ratios Comparison
These vital ratios act as a diagnostic tool to expose the underlying fiscal health, valuation premiums, and capital efficiency of the companies compared:
| Ratios | International Business Machines Corporation (IBM) | Gartner, Inc. (IT) |
|---|---|---|
| ROE | 22.06% (2024) | 92.24% (2024) |
| ROIC | 9.17% (2024) | 22.39% (2024) |
| P/E | 34.21 (2024) | 30.06 (2024) |
| P/B | 7.54 (2024) | 27.73 (2024) |
| Current Ratio | 1.04 (2024) | 1.06 (2024) |
| Quick Ratio | 1.00 (2024) | 1.06 (2024) |
| D/E | 2.14 (2024) | 2.13 (2024) |
| Debt-to-Assets | 42.57% (2024) | 33.98% (2024) |
| Interest Coverage | 5.88 (2024) | 8.82 (2024) |
| Asset Turnover | 0.46 (2024) | 0.73 (2024) |
| Fixed Asset Turnover | 7.03 (2024) | 12.53 (2024) |
| Payout ratio | 102.06% (2024) | 0% (2024) |
| Dividend yield | 2.98% (2024) | 0% (2024) |
| Fiscal Year | 2024 | 2024 |
Efficiency & Valuation Duel: The Vital Signs
Financial ratios serve as the company’s DNA, exposing hidden risks and operational excellence that shape investment decisions.
International Business Machines Corporation
IBM shows a solid net margin of 15.7%, but its return on equity and invested capital stand at zero, signaling weak profitability efficiency. The P/E ratio of 26.1 marks the stock as somewhat expensive. IBM supports shareholders with a 2.27% dividend yield, reflecting steady income rather than aggressive growth reinvestment.
Gartner, Inc.
Gartner impresses with a high ROE of 92.2% and a robust net margin of 20%, illustrating operational efficiency. Its P/E of 30.1 suggests a premium valuation, while a high P/B of 27.7 signals stretched pricing. The company does not pay dividends, focusing capital on growth and innovation instead.
Premium Valuation vs. Operational Safety
Gartner offers superior profitability and operational returns but trades at a higher, stretched valuation. IBM delivers moderate margins with income stability through dividends but suffers from weak equity returns. Growth-focused investors may prefer Gartner, while income-focused ones might lean toward IBM’s steady yield.
Which one offers the Superior Shareholder Reward?
I compare International Business Machines Corporation (IBM) and Gartner, Inc. (IT) on their shareholder reward strategies. IBM offers a 2.27–4.90% dividend yield with payout ratios around 59–102%, backed by strong free cash flow coverage (over 1.7x). IBM pairs dividends with steady buybacks, sustaining shareholder returns through cash distribution. Conversely, Gartner pays no dividends, focusing all free cash flow into growth, R&D, and acquisitions. Gartner’s buyback activity is limited but free cash flow conversion exceeds 90%, signaling prudent capital allocation for long-term value. Historically, dividend-paying tech stalwarts like IBM provide predictable income and buyback-driven upside, appealing in volatile markets. I find IBM’s balanced dividend and buyback model more sustainable and attractive for total returns in 2026, offering both income and capital appreciation potential.
Comparative Score Analysis: The Strategic Profile
The radar chart reveals the fundamental DNA and trade-offs of both International Business Machines Corporation and Gartner, Inc., highlighting their core financial strengths and weaknesses:
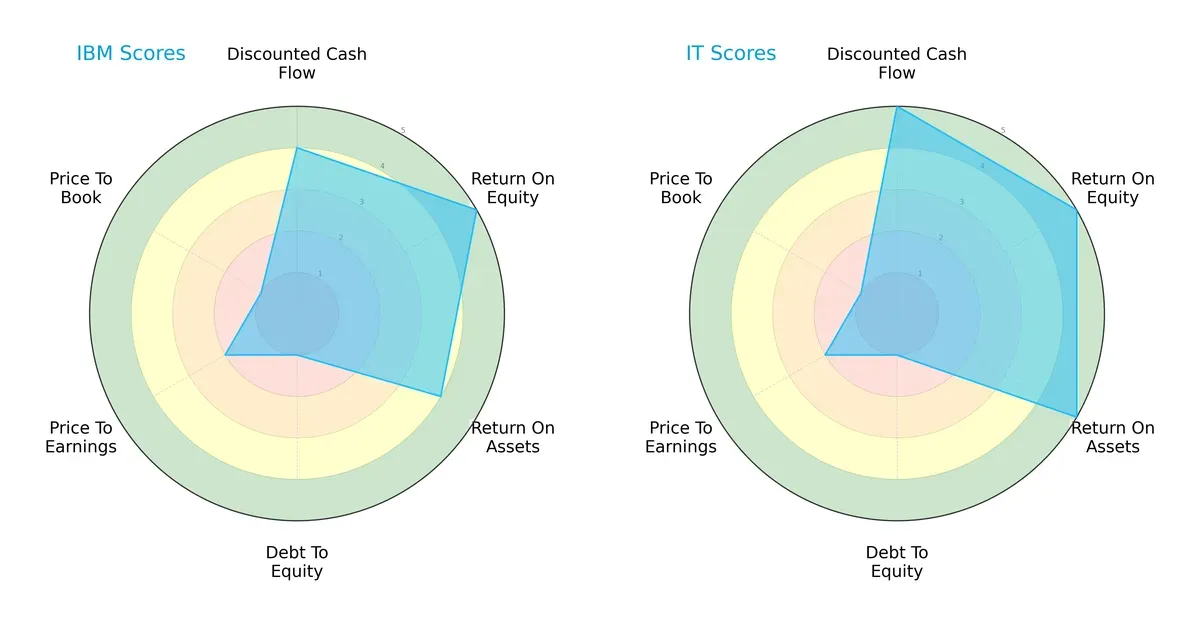
Gartner leads with a stronger DCF (5 vs. 4), ROA (5 vs. 4), and matches IBM on ROE (5 each). Both face significant debt-to-equity challenges (score 1), signaling high leverage risk. Valuation metrics are equally modest. IBM’s profile leans on its ROE strength, while Gartner shows a more balanced operational efficiency.
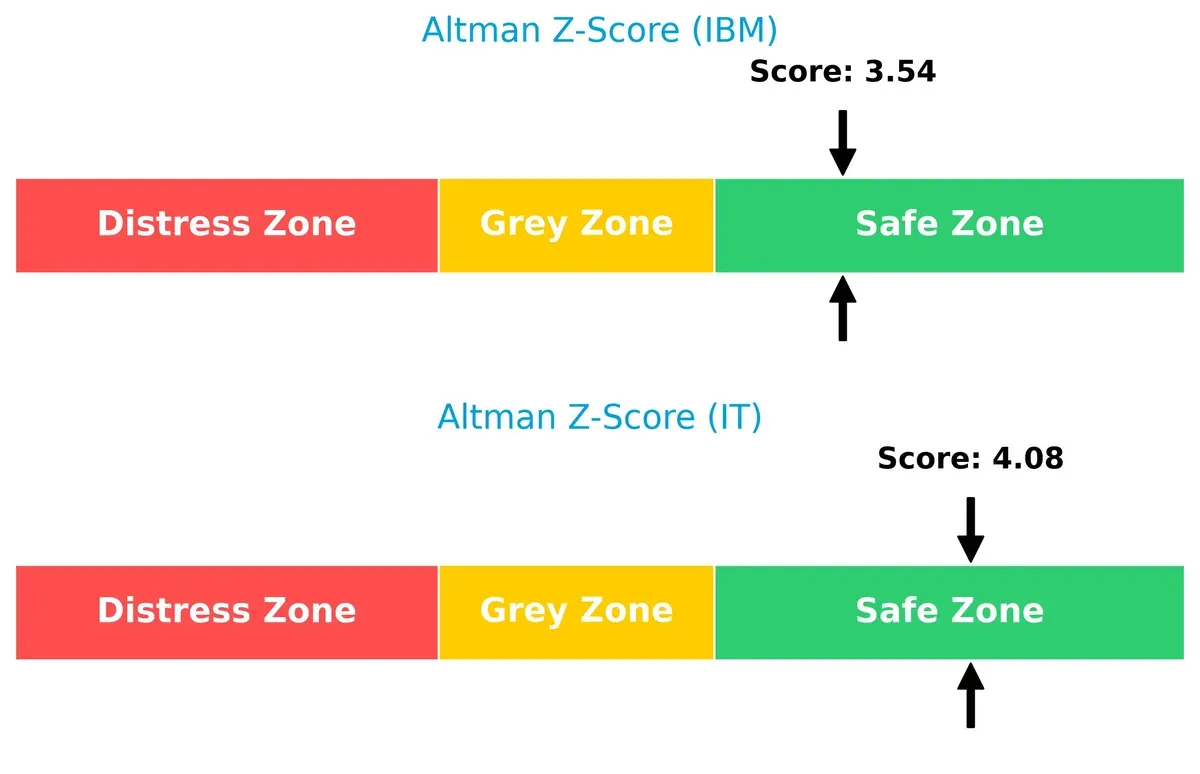
Bankruptcy Risk: Solvency Showdown
Gartner’s Altman Z-Score of 4.08 slightly surpasses IBM’s 3.54, placing both firmly in the safe zone for bankruptcy risk in this economic cycle:
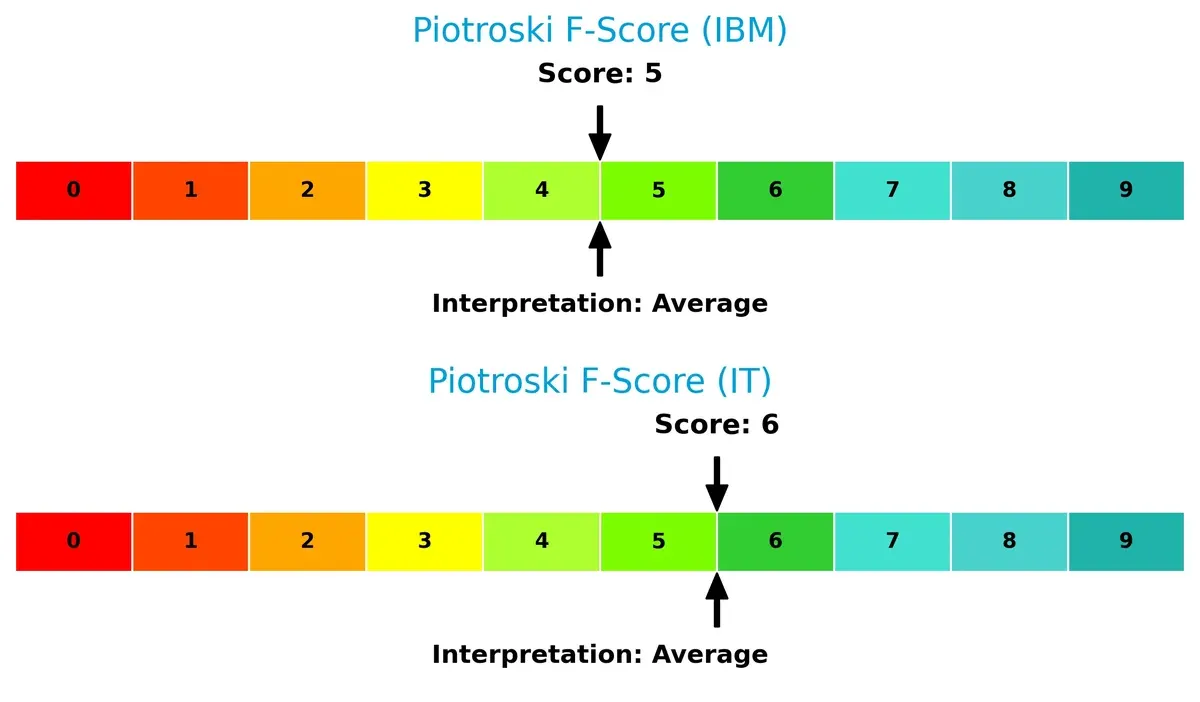
Financial Health: Quality of Operations
Gartner edges IBM with a Piotroski F-Score of 6 vs. 5, suggesting marginally stronger internal financial health. Neither firm shows alarming red flags, but Gartner’s operational metrics appear more robust overall:
How are the two companies positioned?
This section dissects IBM and Gartner’s operational DNA by comparing their revenue distribution and internal dynamics of strengths and weaknesses. The goal is to confront their economic moats and identify which model offers the most resilient competitive advantage today.
Revenue Segmentation: The Strategic Mix
This visual comparison dissects how International Business Machines Corporation and Gartner, Inc. diversify their income streams and where their primary sector bets lie:
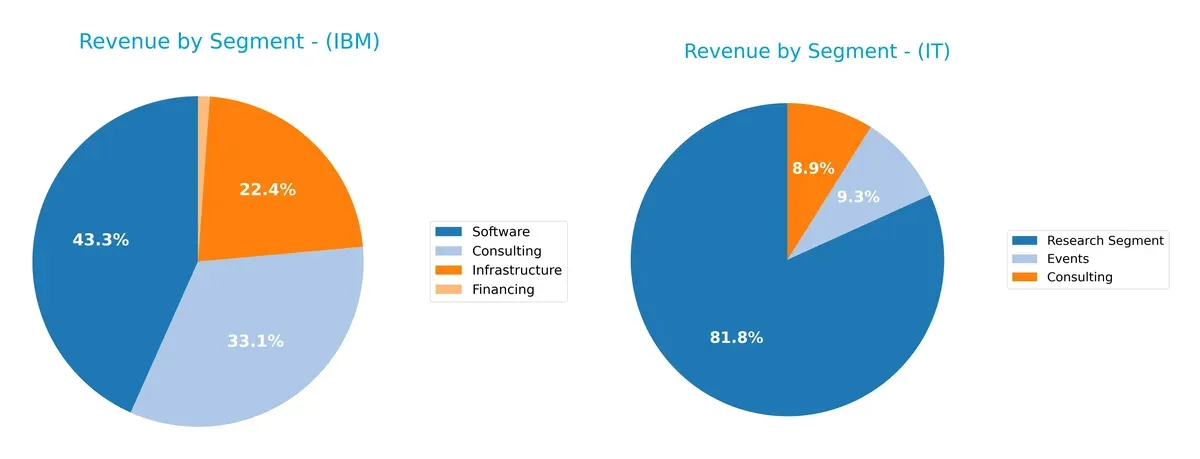
IBM anchors its revenue with Software at $27B and Consulting at $20.7B, showing a balanced but software-heavy mix. Gartner, by contrast, pivots strongly on its Research Segment at $5.1B, dwarfing Consulting ($559M) and Events ($583M). IBM’s diversified approach reduces concentration risk, while Gartner’s focus on research creates a strong moat but elevates dependency on a single segment.
Strengths and Weaknesses Comparison
This table compares the Strengths and Weaknesses of IBM and IT based on diversification, profitability, financials, innovation, global presence, and market share:
IBM Strengths
- Diversified revenue streams across Consulting, Software, Infrastructure, and Financing
- Favorable net margin of 15.69%
- Strong interest coverage at 6.34
- Low debt-to-assets ratio indicating financial stability
- Global presence with significant revenue in Americas, EMEA, and Asia Pacific
IT Strengths
- High profitability with net margin at 20% and ROE at 92.24%
- Favorable ROIC of 22.39% exceeds WACC, indicating value creation
- Strong liquidity ratios with quick ratio above 1
- High asset turnover and fixed asset turnover demonstrating operational efficiency
- Global presence with consistent revenue in US, EMEA, and other international markets
IBM Weaknesses
- Unfavorable ROE and ROIC at 0%, signaling weak capital efficiency
- Unavailable WACC complicates cost of capital assessment
- Poor liquidity ratios (current and quick ratio at 0) raise solvency concerns
- Unfavorable P/E ratio of 26.07 suggests valuation risk
- Low asset turnover impacts asset utilization
- Dividend yield modest at 2.27%
IT Weaknesses
- Unfavorable P/E at 30.06 and very high P/B at 27.73 indicate potential overvaluation
- Higher debt-to-equity ratio of 2.13 increases financial leverage risk
- No dividend yield reduces income appeal
- Moderate current ratio at 1.06 implies limited liquidity cushion
- Some neutral ratios suggest mixed financial signals
Both companies demonstrate strong global footprints and core profitability strengths, but IBM struggles with return metrics and liquidity, while IT faces valuation and leverage challenges. These contrasts highlight differing strategic focuses and risk profiles for investors to consider.
The Moat Duel: Analyzing Competitive Defensibility
A structural moat protects long-term profits from competition’s relentless erosion. Only a durable advantage shields market share and sustains value creation:
International Business Machines Corporation: Hybrid Cloud Integration Moat
IBM’s moat stems from deep integration of hybrid cloud and AI software, reflected in stable 59.5% gross margins and 15.7% net margins. Its consulting and infrastructure segments anchor client switching costs. Yet, a declining ROIC trend signals pressure on capital efficiency heading into 2026.
Gartner, Inc.: Research Subscription Network Moat
Gartner’s moat relies on subscription-based research and advisory services, creating sticky client relationships via network effects. It delivers superior 67.7% gross margin and 20% net margin, with a 149% ROIC growth trend. This robust capital efficiency hints at expanding market influence in 2026.
Hybrid Cloud Integration vs. Subscription Network Lock-in
Gartner exhibits a wider and deeper moat, evidenced by its strong ROIC growth and higher margins. IBM’s entrenched hybrid cloud platform remains valuable but faces efficiency headwinds. Gartner is better positioned to defend and expand its market share.
Which stock offers better returns?
The past year reveals significant divergence in stock movements, with one company showing strong gains and the other enduring steep losses, reflecting contrasting market dynamics.
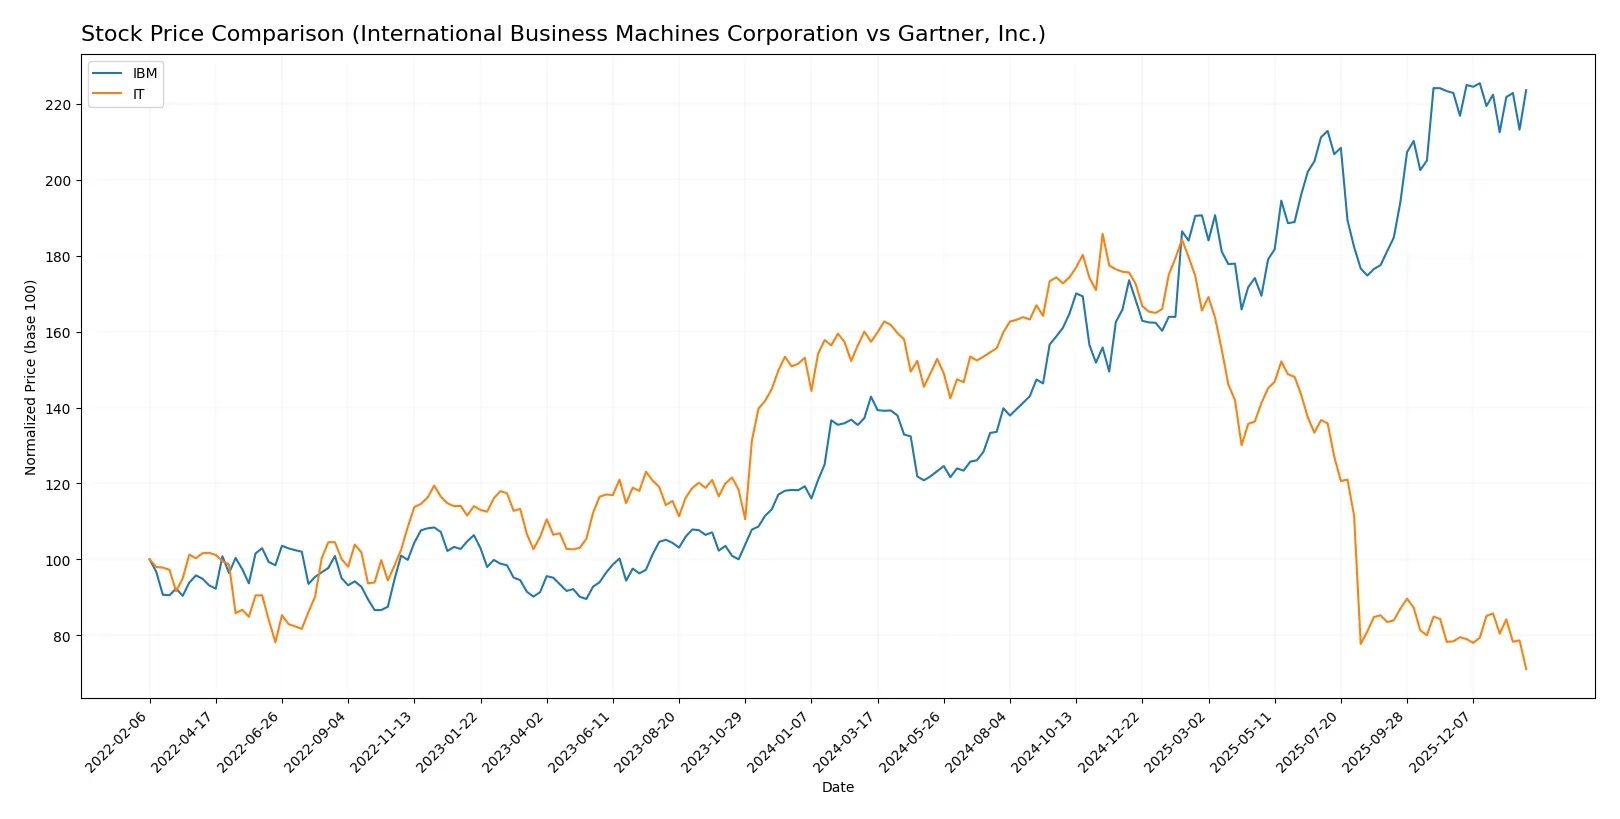
Trend Comparison
International Business Machines Corporation (IBM) exhibits a bullish 56.52% gain over the past 12 months, though momentum decelerates. Its price ranged from a low of 165.71 to a high of 309.24, with volatility moderate at a 43.36 standard deviation.
Gartner, Inc. (IT) faces a bearish trend, declining 54.78% in the same period amid accelerating losses. The stock’s volatility is high, with a 105.67 standard deviation, and prices fluctuated between 209.61 and 547.4.
Comparing both, IBM outperforms Gartner significantly, delivering positive market returns while Gartner’s stock has lost over half its value, marking IBM as the stronger performer.
Target Prices
Analysts project a positive outlook for IBM and Gartner, with target prices well above current levels.
| Company | Target Low | Target High | Consensus |
|---|---|---|---|
| International Business Machines Corporation | 304 | 380 | 349.5 |
| Gartner, Inc. | 231 | 300 | 265 |
The consensus target for IBM sits about 14% above its $307 price, signaling moderate upside. Gartner’s consensus target exceeds its $210 price by 26%, reflecting stronger growth expectations.

Don’t Let Luck Decide Your Entry Point
Optimize your entry points with our advanced ProRealTime indicators. You’ll get efficient buy signals with precise price targets for maximum performance. Start outperforming now!
How do institutions grade them?
International Business Machines Corporation Grades
The table below summarizes recent institutional grades for IBM from major firms.
| Grading Company | Action | New Grade | Date |
|---|---|---|---|
| Wedbush | Maintain | Outperform | 2026-01-29 |
| RBC Capital | Maintain | Outperform | 2026-01-29 |
| Stifel | Maintain | Buy | 2026-01-29 |
| JP Morgan | Maintain | Neutral | 2026-01-29 |
| UBS | Maintain | Sell | 2026-01-29 |
| Evercore ISI Group | Maintain | Outperform | 2026-01-29 |
| Jefferies | Maintain | Buy | 2026-01-29 |
| JP Morgan | Maintain | Neutral | 2026-01-21 |
| Evercore ISI Group | Maintain | Outperform | 2026-01-20 |
| B of A Securities | Maintain | Buy | 2026-01-13 |
Gartner, Inc. Grades
The table below presents institutional grades for Gartner, Inc. from verified sources.
| Grading Company | Action | New Grade | Date |
|---|---|---|---|
| UBS | Maintain | Neutral | 2026-01-09 |
| Morgan Stanley | Maintain | Equal Weight | 2025-12-17 |
| BMO Capital | Maintain | Market Perform | 2025-11-06 |
| Goldman Sachs | Maintain | Buy | 2025-11-05 |
| Wells Fargo | Maintain | Underweight | 2025-11-05 |
| Barclays | Maintain | Equal Weight | 2025-11-05 |
| UBS | Maintain | Neutral | 2025-11-05 |
| Wells Fargo | Maintain | Underweight | 2025-10-29 |
| Barclays | Downgrade | Equal Weight | 2025-10-22 |
| UBS | Maintain | Neutral | 2025-10-06 |
Which company has the best grades?
IBM consistently receives Outperform and Buy ratings from several top firms, indicating stronger institutional confidence. Gartner’s grades cluster around Neutral and Equal Weight, reflecting more cautious sentiment. This disparity may impact investor perception of growth potential and risk.
Risks specific to each company
The following categories identify the critical pressure points and systemic threats facing both firms in the 2026 market environment:
1. Market & Competition
International Business Machines Corporation
- Faces intense competition in hybrid cloud and AI, with pressure from hyperscalers and niche software providers.
Gartner, Inc.
- Competes in advisory and consulting with many specialized firms and digital disruptors expanding rapidly.
2. Capital Structure & Debt
International Business Machines Corporation
- Shows strong interest coverage (6.34) and favorable debt-to-equity metrics, indicating manageable leverage.
Gartner, Inc.
- Has higher debt-to-equity ratio (2.13), increasing financial risk despite good interest coverage (11.59).
3. Stock Volatility
International Business Machines Corporation
- Lower beta (0.698) suggests stock is less sensitive to market swings, offering more stability.
Gartner, Inc.
- Higher beta (1.069) implies greater stock price volatility, increasing investment risk.
4. Regulatory & Legal
International Business Machines Corporation
- Operates globally in regulated sectors like banking and government, facing compliance complexities.
Gartner, Inc.
- Faces regulatory scrutiny mainly in data privacy and advisory transparency across multiple jurisdictions.
5. Supply Chain & Operations
International Business Machines Corporation
- Complex supply chains for hardware and infrastructure could face disruption risks.
Gartner, Inc.
- Primarily service-based with less direct supply chain exposure but reliant on global event logistics.
6. ESG & Climate Transition
International Business Machines Corporation
- Large carbon footprint from infrastructure segment requires accelerated climate transition efforts.
Gartner, Inc.
- ESG risks more reputational and governance-focused, with less direct environmental impact.
7. Geopolitical Exposure
International Business Machines Corporation
- Significant global footprint exposes IBM to trade tensions and geopolitical instability.
Gartner, Inc.
- International presence also exposes Gartner to risks but less hardware-related geopolitical sensitivity.
Which company shows a better risk-adjusted profile?
IBM’s key risk lies in market competition amid technology shifts and supply chain complexity. Gartner’s biggest concern is its elevated leverage combined with stock volatility. I see Gartner’s risk-adjusted profile as slightly weaker due to high debt and beta. IBM’s stable capital structure and lower volatility offer a more prudent risk balance in 2026. The stark contrast in debt-to-equity ratios (IBM’s favorable vs. Gartner’s 2.13) justifies caution toward Gartner’s financial risk.
Final Verdict: Which stock to choose?
International Business Machines Corporation (IBM) demonstrates a superpower in delivering stable cash flow and improving profitability, evidenced by consistent margin expansion. Its point of vigilance lies in a declining ROIC trend, signaling pressure on capital efficiency. IBM suits portfolios targeting steady income and value preservation with moderate growth.
Gartner, Inc. (IT) commands a robust strategic moat through exceptional returns on invested capital and a durable competitive advantage in its niche. It offers superior growth metrics and operational efficiency but carries higher valuation risk and more volatile recent price trends. IT fits well in growth-oriented portfolios seeking long-term capital appreciation.
If you prioritize reliable income and capital preservation, IBM is the compelling choice due to its cash-generative model and margin resilience. However, if you seek dynamic growth backed by a strong moat and expanding profitability, Gartner offers better stability in returns despite its valuation premium. Each stock aligns with distinct investor profiles balancing risk and reward.
Disclaimer: Investment carries a risk of loss of initial capital. The past performance is not a reliable indicator of future results. Be sure to understand risks before making an investment decision.
Go Further
I encourage you to read the complete analyses of International Business Machines Corporation and Gartner, Inc. to enhance your investment decisions: