In the dynamic world of Information Technology Services, Gartner, Inc. and Globant S.A. stand out as influential players driving innovation and growth. Gartner excels in research, advisory, and consulting, while Globant focuses on cutting-edge technology solutions and digital transformation. Both companies serve global markets with overlapping customer needs and innovative strategies. This article will help you decide which firm offers the most compelling investment opportunity in 2026.

Table of contents
Companies Overview
I will begin the comparison between Gartner and Globant by providing an overview of these two companies and their main differences.
Gartner Overview
Gartner, Inc. is a research and advisory company headquartered in Stamford, Connecticut. Founded in 1979, it operates internationally with three main segments: Research, Conferences, and Consulting. Gartner delivers IT-related insights and actionable solutions, focusing on digital transformation, IT cost optimization, and sourcing optimization. It serves business professionals primarily through subscription-based research and networking services.
Globant Overview
Globant S.A., based in Luxembourg and founded in 2003, is a technology services company offering a wide range of digital transformation and innovation services. It focuses on areas such as e-commerce, cloud transformation, data strategies, cybersecurity, and smart technologies across industries including healthcare, media, and travel. Globant emphasizes agile delivery and emerging technologies like blockchain, metaverse, and AI-driven solutions.
Key similarities and differences
Both Gartner and Globant operate in the information technology services sector, providing technology-driven solutions to enhance business performance. While Gartner centers on research, advisory, and consulting with a subscription model, Globant offers broad digital services including software development, cloud, and data analytics. Gartner’s business leans more on expert insights and market research, whereas Globant focuses on technology implementation and innovation across diverse industries.
Income Statement Comparison
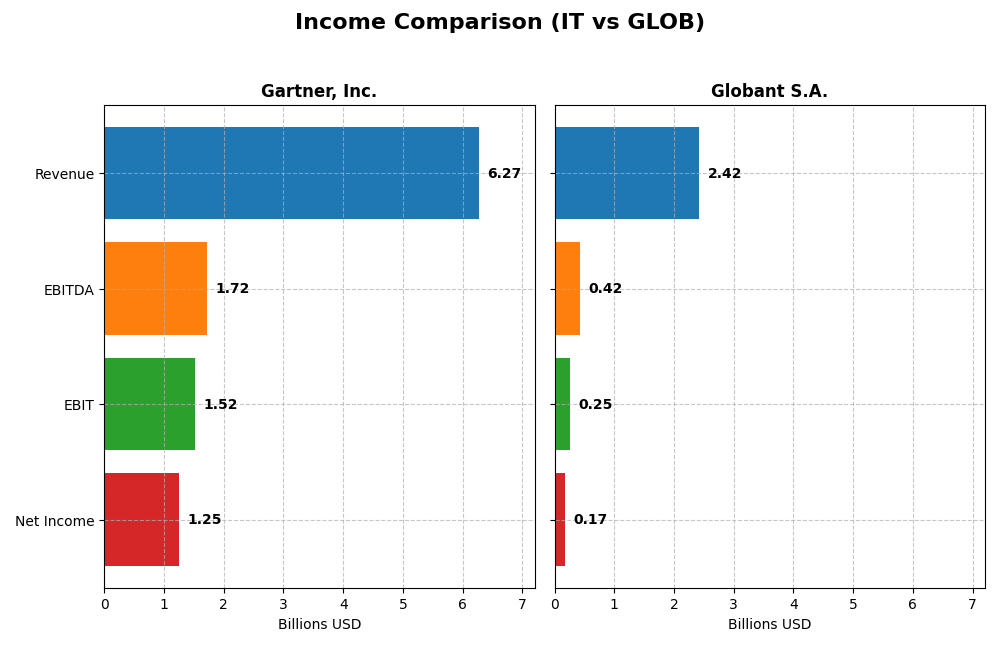
This table presents a side-by-side comparison of key income statement metrics for Gartner, Inc. and Globant S.A. based on their most recent fiscal year data.
| Metric | Gartner, Inc. (IT) | Globant S.A. (GLOB) |
|---|---|---|
| Market Cap | 18.3B USD | 3.0B USD |
| Revenue | 6.27B USD | 2.42B USD |
| EBITDA | 1.72B USD | 417M USD |
| EBIT | 1.52B USD | 254M USD |
| Net Income | 1.25B USD | 166M USD |
| EPS | 16.12 USD | 3.82 USD |
| Fiscal Year | 2024 | 2024 |
Income Statement Interpretations
Gartner, Inc.
Gartner, Inc. showed steady revenue growth from $4.1B in 2020 to $6.3B in 2024, with net income rising sharply from $267M to $1.25B over the same period. Margins improved notably, with a gross margin of 67.72% and net margin at 20% in 2024. The latest year’s growth was moderate in revenue (6.1%) but strong in net income (33.9%) and EPS (44.4%), reflecting improved profitability.
Globant S.A.
Globant’s revenue increased substantially from $814M in 2020 to $2.42B in 2024, accompanied by net income growth from $54M to $166M. Gross margin remained favorable at 35.74%, while net margin was lower at 6.86%. The most recent year saw solid revenue growth of 15.26% and EBIT growth of 16.59%, but net margin declined by 9.3%, indicating some pressure on profitability despite higher sales.
Which one has the stronger fundamentals?
Both companies display favorable income statement fundamentals with over 85% positive metrics. Gartner excels in margin strength and net income growth, showing robust profitability and efficiency. Globant boasts higher revenue growth over the period but struggles with net margin contraction recently. Gartner’s more consistent margin expansion and larger scale suggest comparatively stronger fundamentals based on the data.
Financial Ratios Comparison
This table presents a side-by-side comparison of key financial ratios for Gartner, Inc. and Globant S.A. based on their latest fiscal year data ending 2024.
| Ratios | Gartner, Inc. (IT) | Globant S.A. (GLOB) |
|---|---|---|
| ROE | 92.2% | 8.44% |
| ROIC | 22.4% | 6.82% |
| P/E | 30.1 | 57.6 |
| P/B | 27.7 | 4.86 |
| Current Ratio | 1.06 | 1.54 |
| Quick Ratio | 1.06 | 1.54 |
| D/E (Debt-to-Equity) | 2.13 | 0.21 |
| Debt-to-Assets | 34.0% | 13.0% |
| Interest Coverage | 8.82 | 7.87 |
| Asset Turnover | 0.73 | 0.76 |
| Fixed Asset Turnover | 12.53 | 8.70 |
| Payout ratio | 0 | 0 |
| Dividend yield | 0% | 0% |
Interpretation of the Ratios
Gartner, Inc.
Gartner shows strong profitability with a 20% net margin and an exceptionally high 92.24% return on equity (ROE), supported by solid returns on invested capital (22.39%). However, it faces concerns including a high price-to-book ratio (27.73) and debt-to-equity ratio (2.13). The company does not pay dividends, likely prioritizing reinvestment and growth.
Globant S.A.
Globant presents a mixed picture with moderate net margin (6.86%) and low ROE (8.44%), reflecting weaker profitability compared to Gartner. It benefits from strong liquidity and low leverage, with a favorable debt-to-assets ratio of 12.95%. Like Gartner, Globant does not issue dividends, possibly due to its strategy focusing on reinvestment and innovation.
Which one has the best ratios?
Both companies have a similar balance of favorable and unfavorable ratios, each at 42.86%. Gartner excels in profitability and returns but carries higher leverage and valuation concerns. Globant offers better liquidity and lower debt but weaker profitability. Overall, their ratios suggest slightly favorable financial health with distinct risk profiles.
Strategic Positioning
This section compares the strategic positioning of Gartner, Inc. and Globant S.A., including market position, key segments, and exposure to technological disruption:
Gartner, Inc.
- Large market cap of 18.3B USD, operating globally, faces moderate competitive pressure.
- Focuses on Research (5.1B USD), Events (583M USD), and Consulting (559M USD) segments.
- Limited direct mention of technological disruption exposure; offers IT-related advisory and consulting services.
Globant S.A.
- Smaller market cap of 3B USD, operates worldwide with higher beta indicating greater competitive risk.
- Offers diverse technology services including cloud, AI, digital transformation, and industry solutions.
- High exposure to technological disruption with services in AI, blockchain, cloud, metaverse, and more.
Gartner, Inc. vs Globant S.A. Positioning
Gartner’s approach is concentrated on research and advisory services, generating a majority of revenue from research subscriptions. Globant pursues a diversified technology services model across multiple innovative segments, offering broader digital transformation capabilities but with higher market risk.
Which has the best competitive advantage?
Gartner demonstrates a very favorable moat with strong value creation and growing ROIC, indicating a durable competitive advantage. Globant has a slightly unfavorable moat, shedding value despite improving profitability, suggesting a weaker competitive position.
Stock Comparison
The stock prices of Gartner, Inc. (IT) and Globant S.A. (GLOB) have exhibited significant bearish trends over the past 12 months, with notable declines and recent divergences in short-term performance.

Trend Analysis
Gartner, Inc. (IT) experienced a 48.13% price decline over the past year, indicating a bearish trend with accelerating downward momentum. The stock fluctuated between 547.4 and 229.0, with recent mild recovery signs reflected in a -3.79% change.
Globant S.A. (GLOB) showed an even steeper 70.01% drop over the same period, confirming a bearish trend with acceleration. The price ranged from 231.36 to 56.11, but recent weeks saw a strong positive reversal of 10.31%.
Comparing both stocks, Gartner, Inc. delivered the higher market performance despite its decline, as Globant’s larger loss overshadowed its recent short-term gains.
Target Prices
The current analyst consensus presents a positive outlook for both Gartner, Inc. and Globant S.A.
| Company | Target High | Target Low | Consensus |
|---|---|---|---|
| Gartner, Inc. | 300 | 231 | 265 |
| Globant S.A. | 80 | 68 | 72.5 |
Analysts expect Gartner’s stock to appreciate from its current price of $238.93 toward the consensus target of $265, indicating moderate upside potential. Globant’s consensus target of $72.5 also suggests a modest gain from its current price of $67.93.
Analyst Opinions Comparison
This section compares analysts’ ratings and grades for Gartner, Inc. (IT) and Globant S.A. (GLOB):
Rating Comparison
IT Rating
- Rating: B+ with a very favorable overall evaluation.
- Discounted Cash Flow Score: 5, indicating a very favorable valuation based on future cash flows.
- ROE Score: 5, very favorable, showing high efficiency in generating profit from equity.
- ROA Score: 5, very favorable, reflecting excellent asset utilization to generate earnings.
- Debt To Equity Score: 1, very unfavorable, indicating higher financial risk due to leverage.
- Overall Score: 3, moderate overall financial standing.
GLOB Rating
- Rating: A- with a very favorable overall evaluation.
- Discounted Cash Flow Score: 5, also very favorable for valuation based on discounted cash flows.
- ROE Score: 3, moderate, indicating average efficiency in generating profit from equity.
- ROA Score: 3, moderate, showing average effectiveness in asset utilization.
- Debt To Equity Score: 3, moderate, showing an average level of financial risk from debt.
- Overall Score: 4, favorable overall financial standing.
Which one is the best rated?
Based strictly on the provided data, GLOB holds a higher overall rating (A- vs. B+) and a better overall score (4 vs. 3). However, IT shows superior scores in ROE and ROA, while GLOB demonstrates better debt management and overall rating.
Scores Comparison
Here is a comparison of the Altman Z-Score and Piotroski Score for Gartner, Inc. and Globant S.A.:
Gartner, Inc. Scores
- Altman Z-Score: 4.13, indicating a safe zone, low bankruptcy risk.
- Piotroski Score: 6, categorized as average financial strength.
Globant S.A. Scores
- Altman Z-Score: 3.05, indicating a safe zone, low bankruptcy risk.
- Piotroski Score: 5, categorized as average financial strength.
Which company has the best scores?
Gartner, Inc. has a slightly higher Altman Z-Score and Piotroski Score compared to Globant S.A., suggesting marginally stronger financial stability and average financial health based on the provided data.
Grades Comparison
Here is a detailed comparison of the recent grades assigned to Gartner, Inc. and Globant S.A.:
Gartner, Inc. Grades
The following table summarizes recent grades from reliable financial institutions for Gartner, Inc.:
| Grading Company | Action | New Grade | Date |
|---|---|---|---|
| UBS | Maintain | Neutral | 2026-01-09 |
| Morgan Stanley | Maintain | Equal Weight | 2025-12-17 |
| BMO Capital | Maintain | Market Perform | 2025-11-06 |
| UBS | Maintain | Neutral | 2025-11-05 |
| Goldman Sachs | Maintain | Buy | 2025-11-05 |
| Wells Fargo | Maintain | Underweight | 2025-11-05 |
| Barclays | Maintain | Equal Weight | 2025-11-05 |
| Wells Fargo | Maintain | Underweight | 2025-10-29 |
| Barclays | Downgrade | Equal Weight | 2025-10-22 |
| UBS | Maintain | Neutral | 2025-10-06 |
Overall, Gartner’s grades exhibit a mixed pattern, mostly neutral to equal weight ratings, with a few buy and underweight calls, indicating a cautious but balanced outlook.
Globant S.A. Grades
The table below presents recent grades for Globant S.A. from established grading companies:
| Grading Company | Action | New Grade | Date |
|---|---|---|---|
| Jefferies | Downgrade | Hold | 2025-11-20 |
| UBS | Maintain | Neutral | 2025-11-18 |
| JP Morgan | Maintain | Neutral | 2025-11-14 |
| Needham | Maintain | Buy | 2025-11-14 |
| Canaccord Genuity | Maintain | Hold | 2025-11-14 |
| Goldman Sachs | Maintain | Neutral | 2025-10-09 |
| UBS | Maintain | Neutral | 2025-08-20 |
| Goldman Sachs | Maintain | Neutral | 2025-08-18 |
| Needham | Maintain | Buy | 2025-08-15 |
| JP Morgan | Downgrade | Neutral | 2025-08-15 |
Globant’s grades show a generally stable outlook with mostly neutral and hold ratings, supported by several buy ratings maintained by Needham, reflecting moderate confidence with some recent downgrades.
Which company has the best grades?
Comparing the two, Globant S.A. holds a stronger overall consensus with a “Buy” rating supported by 17 buy and 8 hold recommendations, whereas Gartner, Inc. has a “Hold” consensus with a more mixed distribution including sell ratings. Investors might interpret Globant’s generally more positive grading as a signal of higher growth expectations relative to Gartner’s more cautious outlook.
Strengths and Weaknesses
Below is a comparative overview of Gartner, Inc. (IT) and Globant S.A. (GLOB) based on key financial and strategic criteria as of 2026.
| Criterion | Gartner, Inc. (IT) | Globant S.A. (GLOB) |
|---|---|---|
| Diversification | Strong diversification with Consulting, Events, and Research segments; Research is dominant with $5.13B in 2024 revenue | Less diversified; mainly focused on digital consulting and software development |
| Profitability | High profitability: ROIC 22.4%, net margin 20%, ROE 92.24% (all favorable) | Moderate profitability: ROIC 6.82%, net margin 6.86%, ROE 8.44% (mostly neutral/unfavorable) |
| Innovation | Consistent innovation supported by strong Research segment and growing ROIC trend (+150%) | Innovation growing with ROIC up 26%, but still shedding value overall (ROIC < WACC) |
| Global presence | Established global presence with extensive client base across industries | Expanding global footprint with strong liquidity and low debt levels |
| Market Share | Leading market share in IT research and advisory services | Growing market share in digital transformation but lower scale compared to Gartner |
Gartner’s strengths lie in its diversified revenue streams and excellent profitability driven by its research segment, providing a durable competitive advantage. Globant shows promising growth and innovation but currently struggles with profitability and value creation, warranting cautious consideration.
Risk Analysis
Below is a comparative table highlighting key risk factors for Gartner, Inc. (IT) and Globant S.A. (GLOB) based on the latest 2024 data:
| Metric | Gartner, Inc. (IT) | Globant S.A. (GLOB) |
|---|---|---|
| Market Risk | Beta 1.07, moderate volatility | Beta 1.20, higher volatility |
| Debt Level | Debt-to-Equity 2.13 (high) | Debt-to-Equity 0.21 (low) |
| Regulatory Risk | US-based, stable but tech-focused regulations | EU-based, exposed to diverse regulations |
| Operational Risk | Large workforce (21K), complexity in segments | Larger workforce (31K), diverse services |
| Environmental Risk | Moderate, limited direct impact | Moderate, increasing focus on sustainability |
| Geopolitical Risk | US-centric, moderate exposure | Luxembourg-based, global operations, higher exposure |
Gartner faces higher financial leverage risk with a debt-to-equity ratio over 2, which could amplify vulnerability in economic downturns. Globant has higher market volatility but maintains a conservative debt profile, reducing financial risk. Both companies operate in dynamic regulatory environments and face operational complexity. Market risk and debt levels are the most impactful factors to monitor for portfolio risk management.
Which Stock to Choose?
Gartner, Inc. (IT) shows favorable income evolution with a 52.9% revenue growth over five years and strong profitability metrics including a 20% net margin and 92.24% ROE. The company carries moderate debt with a net debt to EBITDA of 0.56 and holds a very favorable B+ rating, supported by a very favorable moat status indicating durable competitive advantage.
Globant S.A. (GLOB) exhibits a robust 196.7% revenue growth over five years but lower profitability with a 6.86% net margin and 8.44% ROE. Its debt levels are low with a net debt to EBITDA of 0.21, and it benefits from an A- rating. However, its moat evaluation is slightly unfavorable, signaling value destruction despite improving profitability.
Investors seeking companies with strong profitability and a durable competitive moat might find Gartner, Inc. more aligned with those criteria, while those prioritizing high revenue growth and lower leverage could interpret Globant S.A. as potentially fitting a growth-oriented profile. Both companies have slightly favorable overall financial ratios but differ in risk and return dynamics, suggesting a choice depending on individual risk tolerance and investment strategy.
Disclaimer: Investment carries a risk of loss of initial capital. The past performance is not a reliable indicator of future results. Be sure to understand risks before making an investment decision.
Go Further
I encourage you to read the complete analyses of Gartner, Inc. and Globant S.A. to enhance your investment decisions: