Home > Comparison > Technology > IT vs G
The strategic rivalry between Gartner, Inc. and Genpact Limited shapes the evolution of the Technology sector’s Information Technology Services industry. Gartner operates as a research-driven advisory firm with a subscription-based model, while Genpact excels as a large-scale business process outsourcing provider. This head-to-head reflects a contest between specialized knowledge services and operational scale. This analysis aims to identify which business model delivers superior risk-adjusted returns for a diversified portfolio in 2026.

Table of contents
Companies Overview
Gartner, Inc. and Genpact Limited stand as influential pillars in the global Information Technology Services market.
Gartner, Inc.: Research-Driven Advisory Leader
Gartner, Inc. dominates as a research and advisory firm, generating revenue mainly through subscription-based access to exclusive research content. Its 2026 strategy centers on expanding its Research, Conferences, and Consulting segments to deliver actionable insights for IT cost optimization and digital transformation. The company leverages its expertise to maintain a competitive edge in enterprise IT advisory services.
Genpact Limited: BPO and IT Services Specialist
Genpact Limited excels as a business process outsourcing and IT services provider, earning through diversified offerings across finance, supply chain, and digital transformation services. Its 2026 focus lies in enhancing ESG services and digital solutions, addressing growing client demand for sustainability and analytics. Genpact’s broad service spectrum supports its position as a global partner for complex business processes.
Strategic Collision: Similarities & Divergences
Both firms operate in Information Technology Services but follow distinct philosophies. Gartner relies on a closed ecosystem of proprietary research and consulting, while Genpact pursues an open infrastructure model with a vast service portfolio. They clash primarily in digital transformation consulting and IT optimization. Gartner offers a focused intellectual moat, whereas Genpact’s scale and service diversity define its investment profile.
Income Statement Comparison
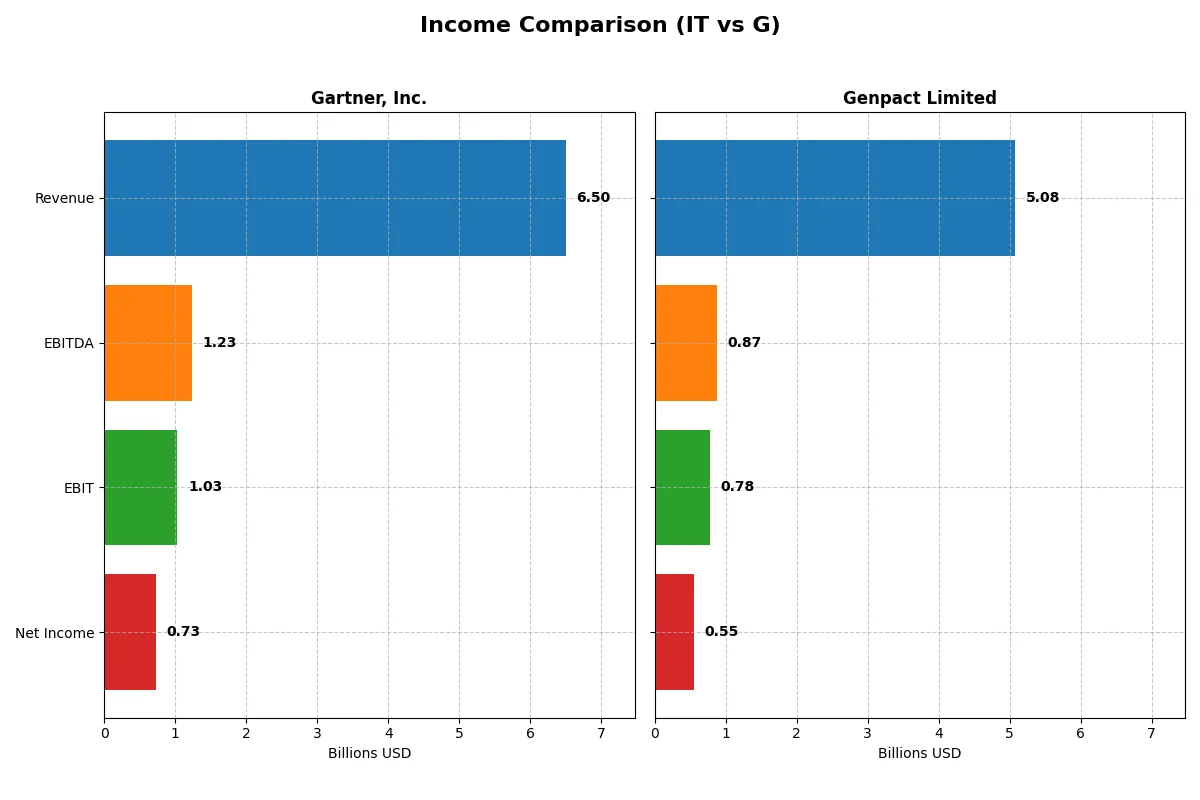
This data dissects the core profitability and scalability of both corporate engines to reveal who dominates the bottom line:
| Metric | Gartner, Inc. (IT) | Genpact Limited (G) |
|---|---|---|
| Revenue | 6.50B | 5.08B |
| Cost of Revenue | 2.10B | 3.27B |
| Operating Expenses | 3.37B | 1.05B |
| Gross Profit | 4.40B | 1.81B |
| EBITDA | 1.23B | 875M |
| EBIT | 1.03B | 780M |
| Interest Expense | 61M | 50M |
| Net Income | 729M | 552M |
| EPS | 9.68 | 3.18 |
| Fiscal Year | 2025 | 2025 |
Income Statement Analysis: The Bottom-Line Duel
The income statement comparison below uncovers the core efficiency and profitability dynamics of Gartner, Inc. and Genpact Limited over recent years.
Gartner, Inc. Analysis
Gartner’s revenue climbed steadily from 4.7B in 2021 to 6.5B in 2025, marking a 37% growth over five years. However, net income declined 8% overall, with a sharp 44% net margin drop in 2025 signaling margin pressure. Despite a robust 67.7% gross margin, EBIT tumbled 32% last year, reflecting rising operating costs and weaker bottom-line momentum.
Genpact Limited Analysis
Genpact’s revenue rose from 4.0B in 2021 to 5.1B in 2025, a 26% gain with consistent acceleration. Net income surged nearly 50% over five years, supported by stable margins around 35.6% gross and 10.9% net. The company improved efficiency in 2025, with EBIT growth of 3% and EPS up 9.8%, showcasing solid operational momentum and margin expansion.
Steady Profits vs. Margin Resilience
Genpact emerges as the fundamental winner, delivering stronger net income growth and margin improvements versus Gartner’s weakening profitability despite higher revenue. Genpact’s profile suits investors seeking consistent earnings expansion and margin resilience, while Gartner faces caution due to deteriorating net margins and earnings volatility.
Financial Ratios Comparison
These vital ratios act as a diagnostic tool to expose the underlying fiscal health, valuation premiums, and capital efficiency of the companies compared:
| Ratios | Gartner, Inc. (IT) | Genpact Limited (G) |
|---|---|---|
| ROE | 0 (no data) | 0.217 |
| ROIC | 0 (no data) | 0.123 |
| P/E | 24.91 | 14.72 |
| P/B | 0 (no data) | 3.19 |
| Current Ratio | 0 (no data) | 1.66 |
| Quick Ratio | 0 (no data) | 1.66 |
| D/E (Debt-to-Equity) | 0 (no data) | 0.74 |
| Debt-to-Assets | 0 (no data) | 0.32 |
| Interest Coverage | 16.93 | 15.32 |
| Asset Turnover | 0 (no data) | 0.87 |
| Fixed Asset Turnover | 0 (no data) | 13.65 |
| Payout Ratio | 0 | 0.21 |
| Dividend Yield | 0 | 1.45% |
| Fiscal Year | 2025 | 2025 |
Efficiency & Valuation Duel: The Vital Signs
Financial ratios act as the DNA of a company, exposing hidden risks and revealing operational excellence beneath surface numbers.
Gartner, Inc.
Gartner shows a favorable net margin of 11.22% but reports zero return on equity and invested capital, signaling weak profitability execution. Its P/E of 24.91 is neutral, suggesting fair valuation. The absence of dividends points to no immediate shareholder returns, likely relying on internal reinvestment or growth strategies. However, half its ratios are unfavorable, indicating operational challenges.
Genpact Limited
Genpact delivers strong profitability with a 21.67% ROE and 12.32% ROIC, reflecting efficient capital use. The P/E of 14.72 is attractive, implying a reasonably priced stock relative to earnings. It maintains a 1.45% dividend yield and solid liquidity ratios, signaling balanced returns and financial health. Most ratios are favorable, underscoring operational strength and prudent capital allocation.
Valuation Discipline vs. Profitability Strength
Genpact offers a better balance of risk and reward with superior returns on equity and invested capital at a reasonable valuation. Gartner’s higher valuation contrasts with weak profitability metrics, posing greater risk. Investors prioritizing capital efficiency and income may lean toward Genpact’s profile, while those accepting operational uncertainty might consider Gartner’s growth potential.
Which one offers the Superior Shareholder Reward?
I observe Gartner, Inc. (IT) opts for zero dividends but aggressively reinvests its free cash flow, with a 93% FCF-to-operating cash flow ratio and negligible buybacks reported. Conversely, Genpact Limited (G) pays a consistent 1.4% dividend yield, with a payout ratio near 21%, and supports returns with steady buybacks. Historically, Genpact’s balanced dividend and buyback approach aligns better with sustainable shareholder rewards, especially given its moderate P/E of ~15 versus Gartner’s stretched 30+. I conclude Genpact offers a more attractive total return profile in 2026, balancing yield and capital return sustainably amid sector volatility.
Comparative Score Analysis: The Strategic Profile
The radar chart reveals the fundamental DNA and trade-offs of Gartner, Inc. and Genpact Limited, highlighting their financial strengths and vulnerabilities:
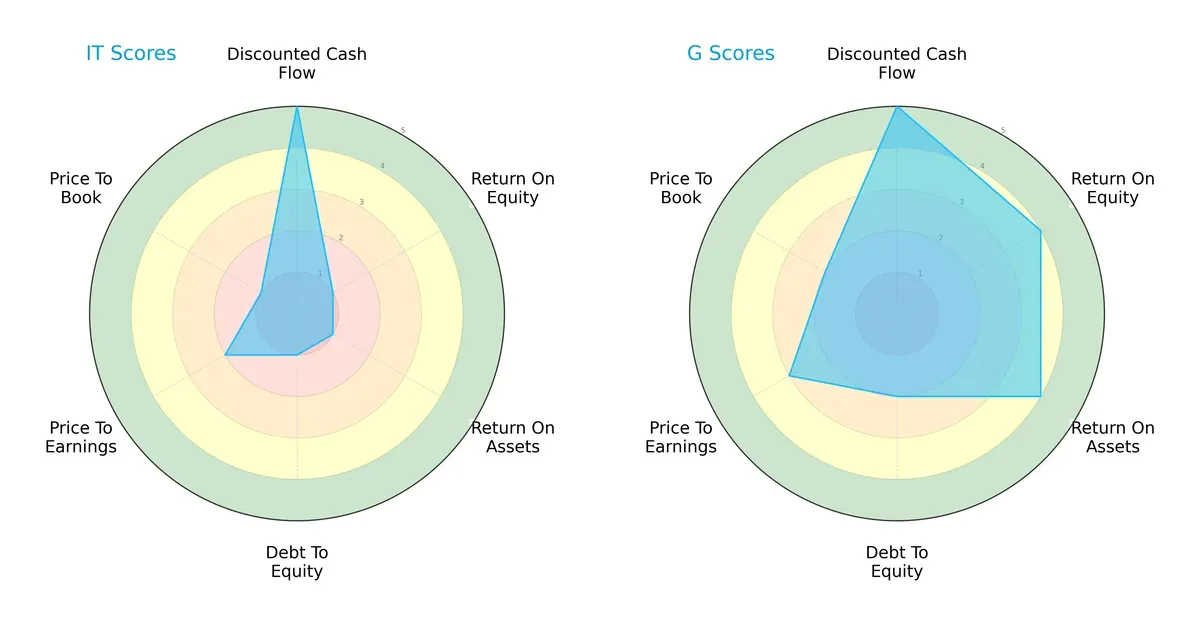
Genpact shows a more balanced profile with strong ROE (4) and ROA (4), and a moderate Debt/Equity score (2). Gartner relies heavily on its Discounted Cash Flow score (5), but suffers from very weak profitability (ROE and ROA at 1) and a high leverage risk (Debt/Equity at 1). Genpact’s valuation metrics (PE 3, PB 2) also suggest relative stability compared to Gartner’s weaker valuations (PE 2, PB 1).
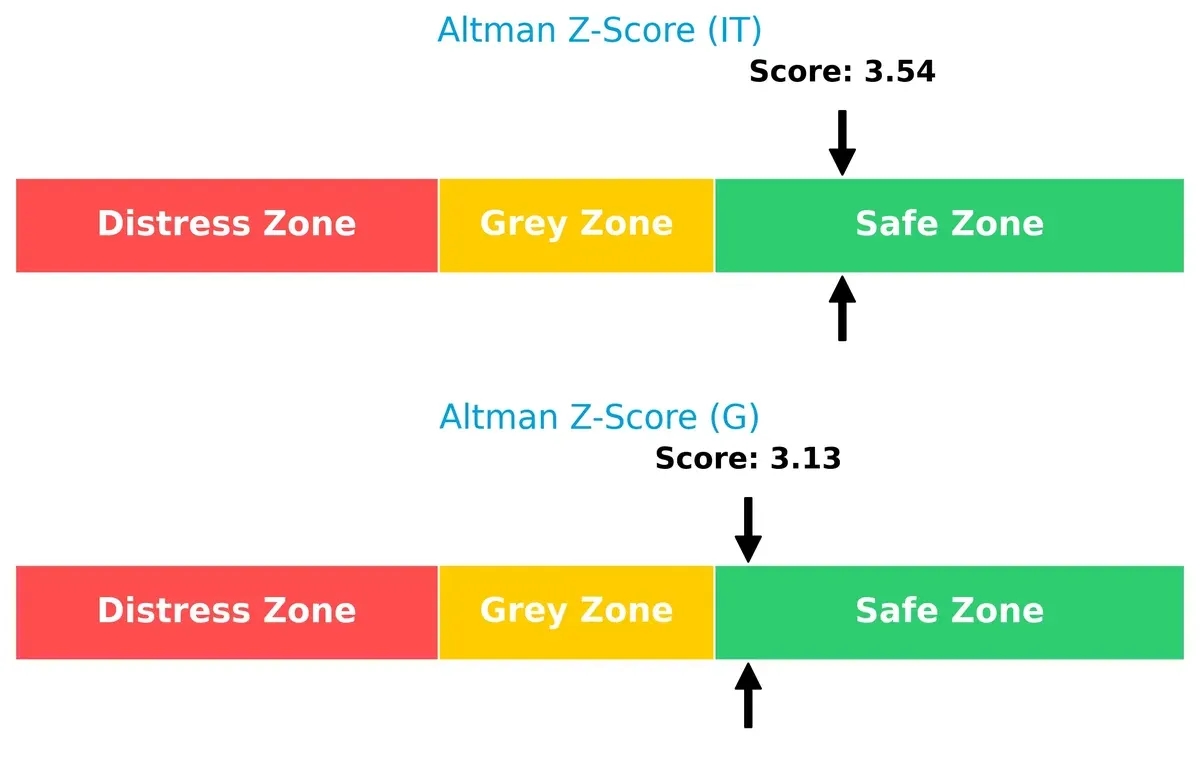
Bankruptcy Risk: Solvency Showdown
Genpact’s Altman Z-Score of 3.13 and Gartner’s 3.54 both place them safely above distress levels. This implies both firms are well-positioned to survive long-term economic cycles, with Gartner slightly more insulated:
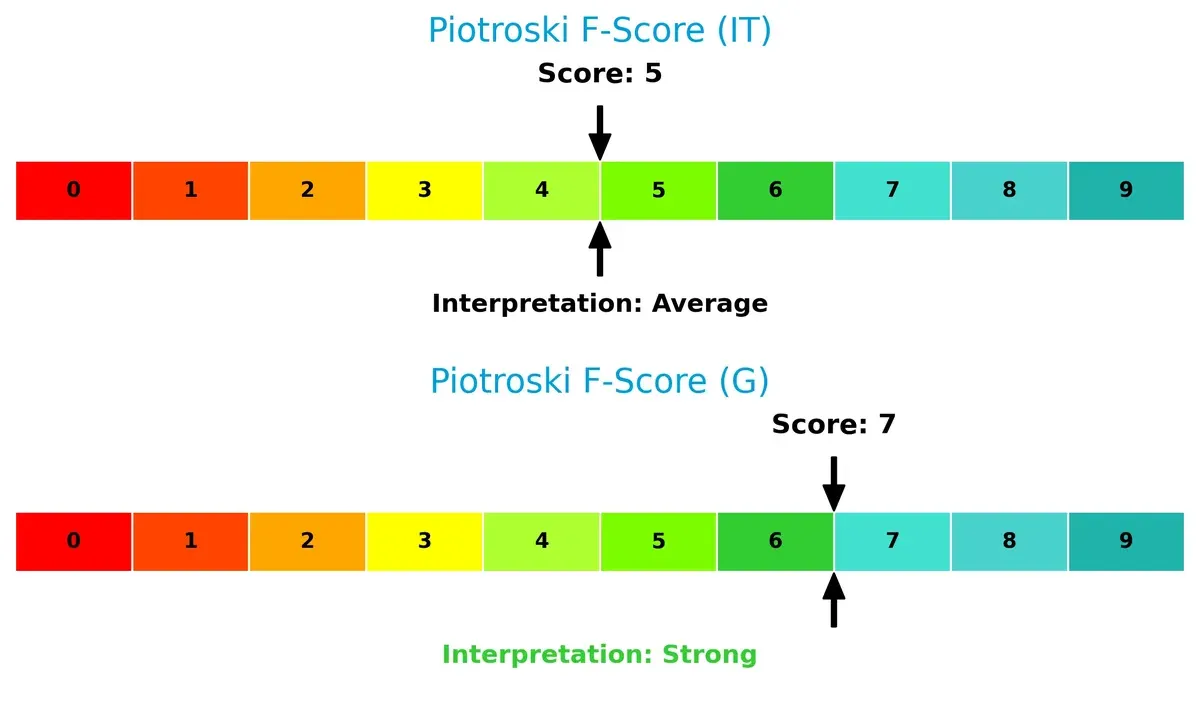
Financial Health: Quality of Operations
Genpact’s Piotroski F-Score of 7 signals strong operational health and robust internal metrics. Gartner’s score of 5 is average, suggesting some red flags in profitability or liquidity measures compared to Genpact’s superior quality:
How are the two companies positioned?
This section dissects the operational DNA of Gartner and Genpact by comparing their revenue distribution and internal dynamics. The goal is to confront their economic moats to identify which model offers the most resilient competitive advantage today.
Revenue Segmentation: The Strategic Mix
The following visual comparison dissects how both firms diversify their income streams and where their primary sector bets lie:
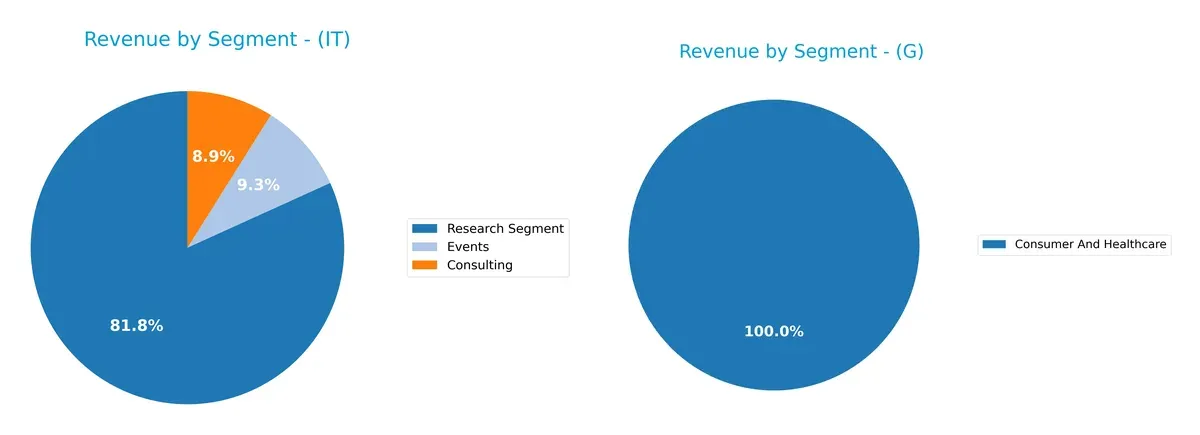
Gartner, Inc. anchors its revenue heavily in the Research Segment with $5.13B in 2024, dwarfing Consulting ($559M) and Events ($583M). This concentration signals strong ecosystem lock-in through specialized insights. In contrast, Genpact Limited’s 2024 revenue centers on Consumer and Healthcare at $1.69B, showing less diversification but a focused bet on high-growth sectors. Gartner’s model carries concentration risk but benefits from dominant market intelligence; Genpact pivots on sector-specific services with broader, but less segmented, exposure.
Strengths and Weaknesses Comparison
This table compares the Strengths and Weaknesses of Gartner, Inc. and Genpact Limited:
Gartner, Inc. Strengths
- Diversified segments in Consulting, Events, and Research with strong revenue growth
- Favorable net margin at 11.22%
- Low debt-to-assets ratio and strong interest coverage
Genpact Limited Strengths
- Diverse revenue streams across Consumer & Healthcare, Banking, High Tech, and Financial Services
- Favorable profitability metrics including ROE 21.67% and ROIC 12.32%
- Strong liquidity ratios with current and quick ratios at 1.66
Gartner, Inc. Weaknesses
- Unfavorable ROE and ROIC at 0%
- Poor liquidity with current and quick ratios at 0
- Unavailable WACC limits cost of capital assessment
- Neutral P/E ratio at 24.91
Genpact Limited Weaknesses
- Elevated price-to-book ratio at 3.19 signals potential overvaluation
- Debt-to-assets at 32.45% and D/E at 0.74 are neutral but higher than Gartner
- Dividend yield is neutral at 1.45%
Gartner shows strength in segment diversification and conservative leverage but faces profitability and liquidity challenges. Genpact excels in profitability and liquidity with a broader global footprint but has valuation and moderate leverage risks. Each company’s financial profile influences its strategic financial flexibility and risk tolerance.
The Moat Duel: Analyzing Competitive Defensibility
Only a durable structural moat protects long-term profits from relentless competitive pressures and market disruption:
Gartner, Inc.: Intangible Asset Moat Anchored in Expert Research
Gartner leverages its brand and expert network to sustain high gross margins near 68%. However, declining ROIC signals potential erosion. New digital services could deepen or threaten its moat in 2026.
Genpact Limited: Operational Excellence and Scale Cost Advantage
Genpact’s moat stems from efficient global delivery and scale in business process outsourcing. It exhibits a strong, growing ROIC above WACC by nearly 6%, signaling expanding value creation and margin stability heading into 2026.
Expertise Edge vs. Scale Efficiency: The Moat Showdown
Genpact’s wider and deeper moat, evidenced by rising ROIC and consistent margin growth, outpaces Gartner’s intangible asset moat, which faces margin pressure and declining capital returns. Genpact is better positioned to defend and expand its market share.
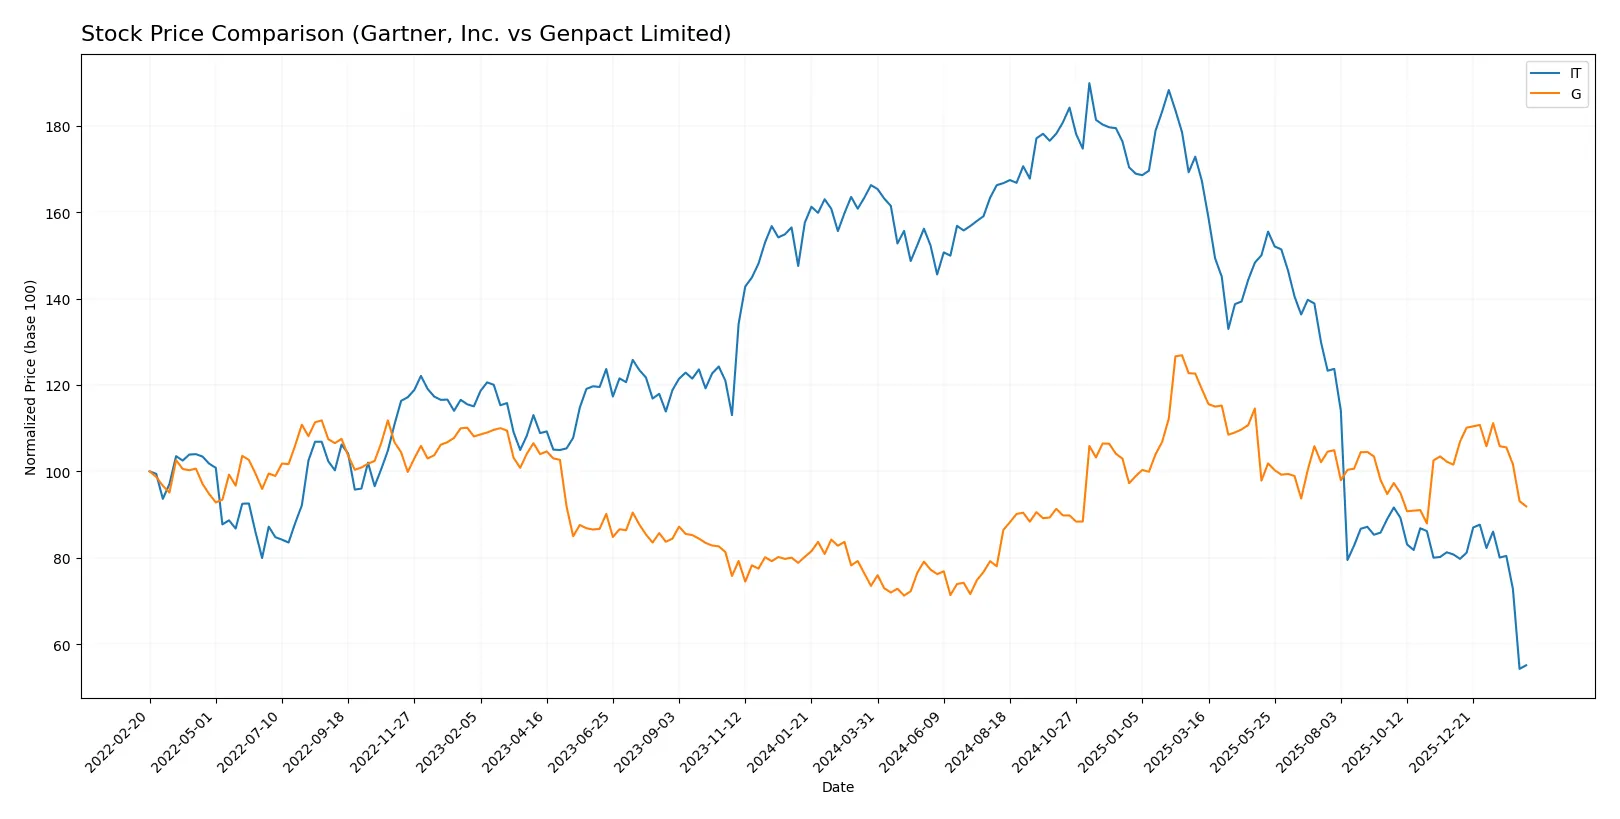
Which stock offers better returns?
The past year shows contrasting price dynamics: Gartner, Inc. suffers a sharp decline, while Genpact Limited posts solid gains despite recent softness.
Trend Comparison
Gartner, Inc. shares dropped 66.88% over the past 12 months, signaling a strong bearish trend with decelerating losses and a wide price range between 547.4 and 156.33.
Genpact Limited’s stock gained 25.06% in the same period, marking a bullish trend with decelerating momentum and a narrower volatility band from 30.9 to 55.05.
Genpact outperformed Gartner by a wide margin, delivering positive market returns while Gartner’s stock sharply declined over the last year.
Target Prices
Analysts present a clear target price consensus for Gartner, Inc. and Genpact Limited.
| Company | Target Low | Target High | Consensus |
|---|---|---|---|
| Gartner, Inc. | 170 | 275 | 206.3 |
| Genpact Limited | 42 | 50 | 46 |
Gartner’s target consensus at $206.3 signals a 30% upside from the current $158.26 price. Genpact’s consensus of $46 implies a 15% gain versus the $39.85 market price.

Don’t Let Luck Decide Your Entry Point
Optimize your entry points with our advanced ProRealTime indicators. You’ll get efficient buy signals with precise price targets for maximum performance. Start outperforming now!
How do institutions grade them?
Gartner, Inc. Grades
The following table summarizes recent grades from major financial institutions for Gartner, Inc.:
| Grading Company | Action | New Grade | Date |
|---|---|---|---|
| Truist Securities | Maintain | Buy | 2026-02-06 |
| Barclays | Maintain | Equal Weight | 2026-02-05 |
| Morgan Stanley | Maintain | Equal Weight | 2026-02-04 |
| Wells Fargo | Maintain | Underweight | 2026-02-04 |
| UBS | Maintain | Neutral | 2026-01-09 |
| Morgan Stanley | Maintain | Equal Weight | 2025-12-17 |
| BMO Capital | Maintain | Market Perform | 2025-11-06 |
| Wells Fargo | Maintain | Underweight | 2025-11-05 |
| Barclays | Maintain | Equal Weight | 2025-11-05 |
| Goldman Sachs | Maintain | Buy | 2025-11-05 |
Genpact Limited Grades
The following table shows recent grades from recognized grading firms for Genpact Limited:
| Grading Company | Action | New Grade | Date |
|---|---|---|---|
| Needham | Maintain | Buy | 2026-02-06 |
| JP Morgan | Maintain | Neutral | 2025-08-20 |
| Needham | Maintain | Buy | 2025-08-08 |
| Mizuho | Maintain | Neutral | 2025-07-01 |
| Needham | Maintain | Buy | 2025-06-30 |
| TD Cowen | Maintain | Buy | 2025-06-27 |
| Baird | Maintain | Neutral | 2025-05-08 |
| Needham | Maintain | Buy | 2025-05-08 |
| Mizuho | Maintain | Neutral | 2025-02-10 |
| Needham | Maintain | Buy | 2025-02-07 |
Which company has the best grades?
Genpact Limited consistently earns “Buy” ratings from multiple institutions, while Gartner, Inc. displays a broader mix including “Equal Weight” and “Underweight.” Investors may interpret Genpact’s stronger consensus as greater confidence from analysts.
Risks specific to each company
The following categories identify the critical pressure points and systemic threats facing both firms in the 2026 market environment:
1. Market & Competition
Gartner, Inc.
- Faces intense rivalry in IT advisory, with pressure on pricing and innovation to maintain market share.
Genpact Limited
- Competes globally in BPO and IT services, challenged by automation trends and cost pressures in emerging markets.
2. Capital Structure & Debt
Gartner, Inc.
- Exhibits a very strong balance sheet with favorable debt metrics and high interest coverage.
Genpact Limited
- Maintains moderate leverage with neutral debt-to-assets ratio, manageable but exposes some financial flexibility risk.
3. Stock Volatility
Gartner, Inc.
- Beta near 1.04 indicates market-correlated volatility with a wide price range signaling episodic swings.
Genpact Limited
- Lower beta at 0.74 suggests relative stability and less sensitivity to market shocks.
4. Regulatory & Legal
Gartner, Inc.
- Global operations expose it to evolving data privacy laws and advisory compliance risks.
Genpact Limited
- Faces regulatory scrutiny in multiple jurisdictions, especially concerning outsourcing and data security compliance.
5. Supply Chain & Operations
Gartner, Inc.
- Relies on expert networks and digital platforms, sensitive to disruptions in talent availability and technology shifts.
Genpact Limited
- Complex global operations create risks from supply chain disruptions and labor market volatility in key regions.
6. ESG & Climate Transition
Gartner, Inc.
- Needs to advance ESG integration to meet investor expectations though less exposed to physical climate risks.
Genpact Limited
- Provides ESG services but faces pressure to improve own sustainability practices in a highly scrutinized sector.
7. Geopolitical Exposure
Gartner, Inc.
- US-based with international exposure, vulnerable to trade tensions and regulatory barriers overseas.
Genpact Limited
- Bermuda headquarters and broad geographic footprint increase risks from geopolitical instability and policy shifts.
Which company shows a better risk-adjusted profile?
Genpact’s greatest risk is its geopolitical exposure and operational complexity, but its strong financial ratios and stable stock volatility support resilience. Gartner’s critical risk lies in competitive pressure and weak profitability metrics, despite excellent capital structure. Genpact’s favorable financial health and higher Piotroski score indicate a superior risk-adjusted profile as of 2026.
Final Verdict: Which stock to choose?
Gartner, Inc. (IT) wields unmatched efficiency in delivering high gross and EBIT margins, reflecting a refined operational engine. Its key point of vigilance is the recent decline in ROIC and net margin, signaling pressure on profitability. This stock might suit an aggressive growth portfolio willing to navigate earnings volatility.
Genpact Limited (G) commands a strategic moat through steadily growing ROIC above WACC, underscoring value creation and a sustainable competitive advantage. Its stronger balance sheet and favorable income growth offer better stability than Gartner. It fits well within a GARP (Growth at a Reasonable Price) portfolio, balancing growth and financial health.
If you prioritize operational efficiency and can tolerate margin compression, Gartner outshines with its cash generation prowess. However, if you seek durable value creation and more stable financial footing, Genpact offers better stability and a growing competitive advantage. Both present distinct analytical scenarios depending on your risk appetite and investment horizon.
Disclaimer: Investment carries a risk of loss of initial capital. The past performance is not a reliable indicator of future results. Be sure to understand risks before making an investment decision.
Go Further
I encourage you to read the complete analyses of Gartner, Inc. and Genpact Limited to enhance your investment decisions: