Garmin Ltd. and Trimble Inc. are two prominent players in the hardware and technology sector, each driving innovation in location-based solutions and precision equipment. Garmin excels in consumer wearables and navigation devices, while Trimble focuses on advanced software and systems for construction, agriculture, and transportation. Given their overlapping markets and distinct innovation strategies, this analysis will help investors determine which company offers the most compelling investment opportunity in 2026.

Table of contents
Companies Overview
I will begin the comparison between Garmin Ltd. and Trimble Inc. by providing an overview of these two companies and their main differences.
Garmin Ltd. Overview
Garmin Ltd. is a Swiss-based technology company specializing in designing, manufacturing, and marketing wireless devices globally. Its product portfolio spans fitness, outdoor, aviation, marine, and automotive segments, offering devices like smartwatches, avionics, and navigation systems. Garmin operates across multiple continents and sells through diverse channels including retailers, distributors, and an online webshop. Founded in 1989, it has a market cap of $41.2B and employs about 21,800 people.
Trimble Inc. Overview
Trimble Inc. is a US-based technology firm focused on providing advanced solutions for professionals and mobile workers worldwide. Its offerings include software and hardware for construction, geospatial, agriculture, and transportation industries, emphasizing automation, data sharing, and asset management. Founded in 1978 and headquartered in California, Trimble has a market cap of $19.1B and employs roughly 12,100 workers. It trades on NASDAQ and has a diverse product portfolio for field and office applications.
Key similarities and differences
Both Garmin and Trimble operate in the technology sector within the hardware and equipment industry, providing specialized devices and software. Garmin targets consumer and professional markets with a focus on navigation and fitness, while Trimble emphasizes professional, industrial, and enterprise solutions for construction, agriculture, and transportation. Garmin’s revenue stream is more diversified across consumer segments, whereas Trimble’s business is heavily oriented towards B2B technology integration and field solutions.
Income Statement Comparison
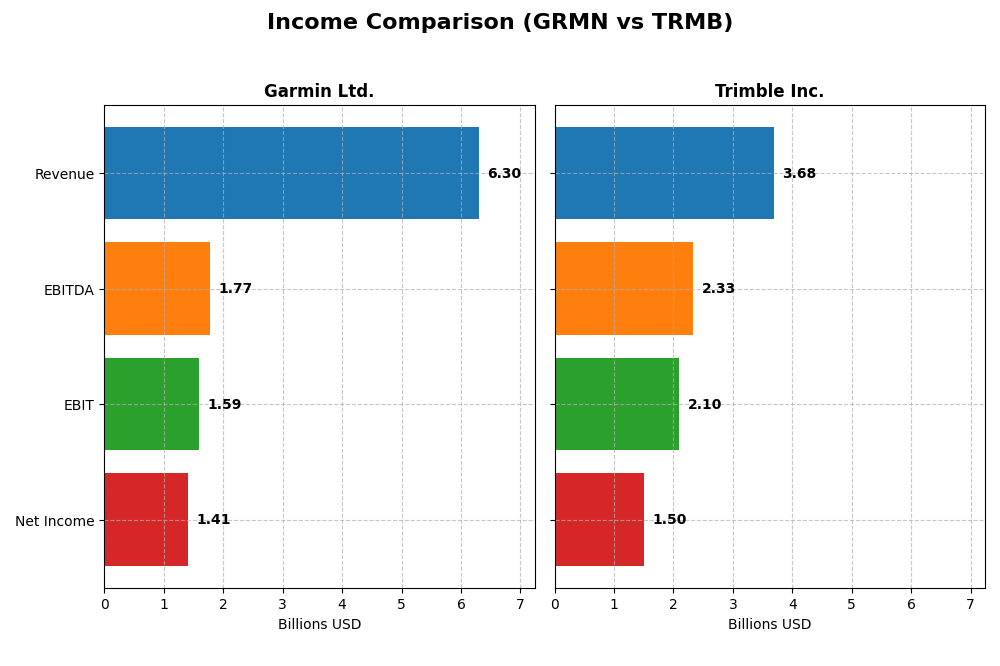
Below is a side-by-side comparison of the most recent fiscal year income statement metrics for Garmin Ltd. and Trimble Inc., providing a clear view of their financial performance.
| Metric | Garmin Ltd. (GRMN) | Trimble Inc. (TRMB) |
|---|---|---|
| Market Cap | 41.2B | 19.1B |
| Revenue | 6.30B | 3.68B |
| EBITDA | 1.77B | 2.33B |
| EBIT | 1.59B | 2.10B |
| Net Income | 1.41B | 1.50B |
| EPS | 7.35 | 6.13 |
| Fiscal Year | 2024 | 2024 |
Income Statement Interpretations
Garmin Ltd.
Garmin Ltd. showed consistent growth in revenue and net income from 2020 to 2024, with a 50.4% revenue increase and 42.2% net income rise overall. Margins remained strong, with a gross margin of 58.7% and an EBIT margin of 25.3% in 2024. The latest year marked a favorable 20.4% revenue rise and 45.9% EBIT growth, though net margin slightly declined by 9.1%.
Trimble Inc.
Trimble Inc. experienced a 17.0% revenue growth and a remarkable 285.8% increase in net income over 2020-2024. Its 2024 gross margin was 65.1% with an EBIT margin of 56.9%, reflecting strong profitability. However, revenue slightly declined by 3.0% in the last year, while EBIT and net margin surged significantly, by 304.8% and 398.4% respectively, indicating improved operational efficiency.
Which one has the stronger fundamentals?
Garmin demonstrates steady growth with stable margins and controlled expenses, reflecting consistent operational performance and sound risk management. Trimble shows higher profitability margins and exceptional net income growth but faces recent revenue contraction. Both have favorable overall income evaluations, with Garmin slightly more balanced and Trimble marked by more volatile but strong earnings expansion.
Financial Ratios Comparison
The table below presents the most recent available financial ratios for Garmin Ltd. and Trimble Inc. for fiscal year 2024, enabling a side-by-side comparison of key performance and financial health indicators.
| Ratios | Garmin Ltd. (GRMN) | Trimble Inc. (TRMB) |
|---|---|---|
| ROE | 17.98% | 26.18% |
| ROIC | 16.28% | 4.49% |
| P/E | 28.5 | 11.52 |
| P/B | 5.13 | 3.02 |
| Current Ratio | 3.54 | 1.27 |
| Quick Ratio | 2.56 | 1.16 |
| D/E (Debt-to-Equity) | 0.021 | 0.264 |
| Debt-to-Assets | 1.69% | 15.96% |
| Interest Coverage | 0 (not available) | 5.08 |
| Asset Turnover | 0.65 | 0.39 |
| Fixed Asset Turnover | 4.49 | 11.81 |
| Payout ratio | 40.55% | 0% |
| Dividend yield | 1.42% | 0% |
Interpretation of the Ratios
Garmin Ltd.
Garmin Ltd. shows a generally favorable ratio profile, with strong net margin (22.41%) and solid returns on equity (17.98%) and invested capital (16.28%). However, valuation ratios such as P/E (28.5) and P/B (5.13) are less attractive, alongside a high current ratio (3.54) that may indicate inefficient asset use. The company pays dividends, with a moderate yield of 1.42%, suggesting steady but cautious shareholder returns.
Trimble Inc.
Trimble Inc. presents mixed ratios with a high net margin (40.84%) and return on equity (26.18%), but a weak return on invested capital (4.49%) and elevated WACC (10.81%) that raise concerns. Its P/E ratio (11.52) is favorable, yet P/B (3.02) is unfavorable. The current ratio is neutral at 1.27. Trimble does not pay dividends, likely prioritizing reinvestment or growth initiatives over direct shareholder payouts.
Which one has the best ratios?
Both Garmin and Trimble have a similar proportion of favorable ratios (57.14%), but Garmin displays stronger returns on invested capital and more balanced leverage metrics. Trimble’s higher net margin and ROE contrast with weaker capital efficiency and no dividend returns. Overall, Garmin’s ratio profile appears more balanced, while Trimble shows higher performance variability.
Strategic Positioning
This section compares the strategic positioning of Garmin Ltd. and Trimble Inc., including Market position, Key segments, and exposure to technological disruption:
Garmin Ltd.
- Strong market presence with $41B market cap; moderate beta
- Diversified segments: Fitness, Outdoor, Marine, Aviation, Automotive Mobile
- Exposure to tech disruption mainly in wearable devices and avionics
Trimble Inc.
- Smaller market cap at $19B; higher beta indicating more volatility and competitive pressure
- Focused on Buildings and Infrastructure, Geospatial, Resources and Utilities, Transportation segments
- Faces disruption risks in software solutions for construction, agriculture, and transportation
Garmin Ltd. vs Trimble Inc. Positioning
Garmin adopts a diversified multi-segment strategy spanning fitness, outdoor, marine, aviation, and automotive mobile markets. Trimble concentrates on integrated technology solutions for professional sectors like construction and agriculture, each offering distinct market opportunities and risks based on their focus.
Which has the best competitive advantage?
Garmin shows a favorable moat with ROIC above WACC and stable profitability, indicating sustainable value creation. Trimble exhibits a very unfavorable moat with declining ROIC, signaling value destruction and weaker competitive advantage.
Stock Comparison
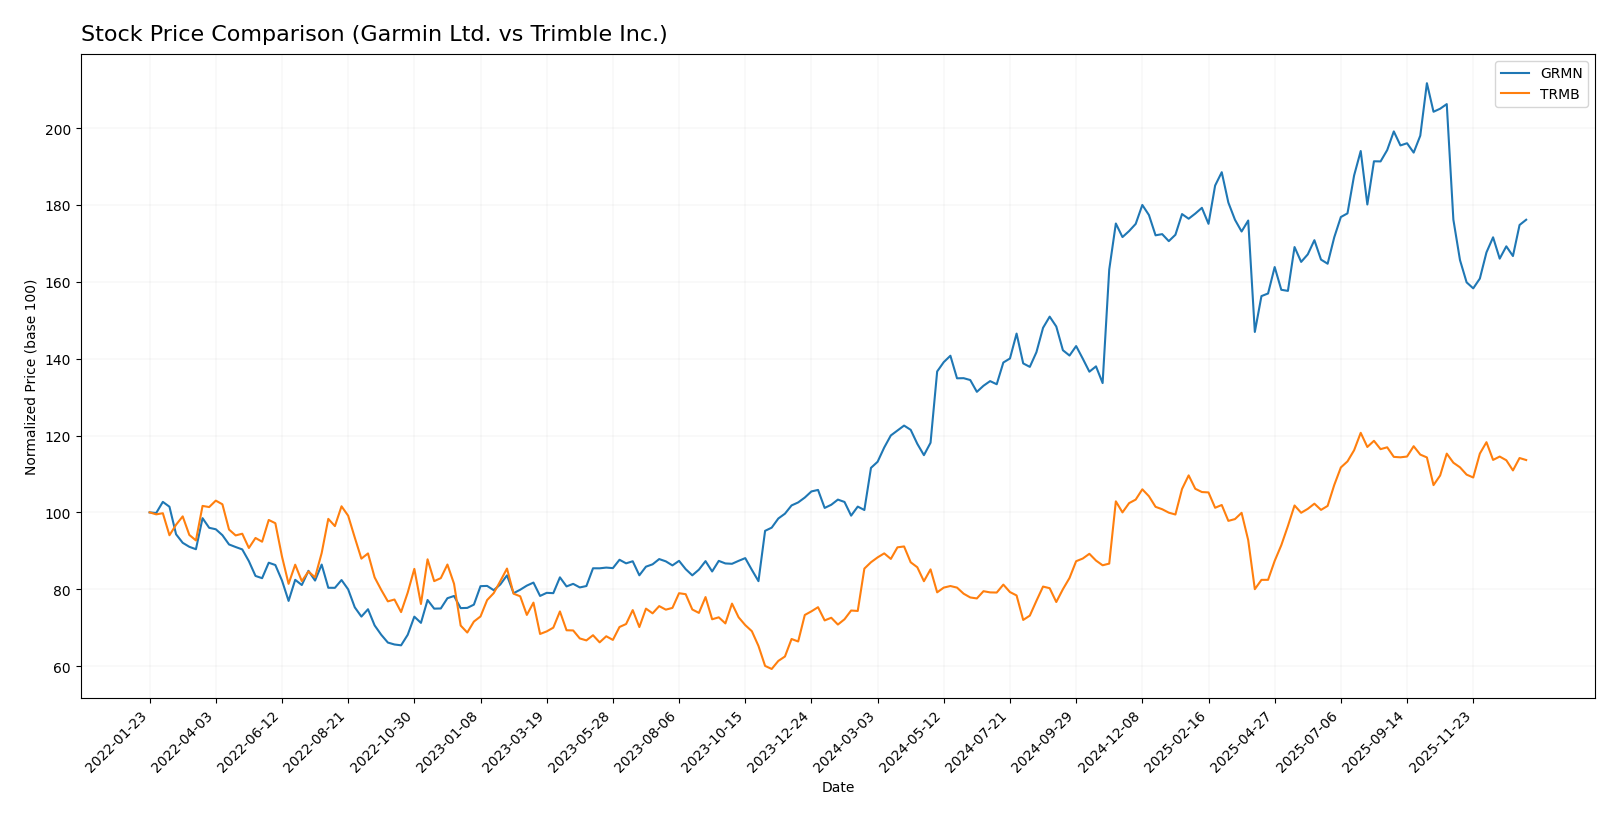
The stock price movements of Garmin Ltd. and Trimble Inc. over the past year reveal contrasting momentum patterns, with Garmin showing a strong long-term bullish acceleration and Trimble experiencing decelerated gains amid differing volume trends.
Trend Analysis
Garmin Ltd. (GRMN) exhibited a bullish trend over the last 12 months, with a 57.86% price increase and accelerating momentum, reaching a high of 257.06 and a low of 135.51, despite recent slight neutral variation.
Trimble Inc. (TRMB) also showed a bullish trend over the same period, rising 30.56% but with decelerating momentum, a lower volatility profile, and a recent modest positive price change of 0.61%.
Comparing both, Garmin delivered the highest market performance with a substantially larger total price gain and stronger acceleration than Trimble, despite Trimble’s steadier recent upward slope.
Target Prices
The current analyst consensus for target prices suggests moderate upside potential for Garmin Ltd. and limited upside for Trimble Inc.
| Company | Target High | Target Low | Consensus |
|---|---|---|---|
| Garmin Ltd. | 310 | 193 | 237 |
| Trimble Inc. | 102 | 94 | 98.2 |
Garmin’s consensus target of 237 USD is above its current price of 213.93 USD, indicating expected growth. Trimble’s consensus target of 98.2 USD is slightly above its current price of 80.24 USD, showing modest analyst optimism.
Analyst Opinions Comparison
This section compares analysts’ ratings and grades for Garmin Ltd. and Trimble Inc.:
Rating Comparison
Garmin Ltd. Rating
- Rating: A- indicating a very favorable overall rating.
- Discounted Cash Flow Score: Moderate score of 3.
- ROE Score: Favorable score of 4 reflects efficient profit generation.
- ROA Score: Very favorable score of 5 shows strong asset utilization.
- Debt To Equity Score: Favorable score of 4 suggests sound financial stability.
- Overall Score: Favorable score of 4 summarizes strong financial health.
Trimble Inc. Rating
- Rating: B- with a very favorable but lower overall rating.
- Discounted Cash Flow Score: Moderate score of 3.
- ROE Score: Moderate score of 3 indicates average efficiency.
- ROA Score: Moderate score of 3 indicates average asset use.
- Debt To Equity Score: Moderate score of 2 indicates higher financial risk.
- Overall Score: Moderate score of 2 reflects weaker financial standing.
Which one is the best rated?
Based strictly on the provided data, Garmin Ltd. is better rated with higher overall and individual financial scores, demonstrating stronger profitability, asset use, and financial stability compared to Trimble Inc.
Scores Comparison
Here is a comparison of the key financial scores for Garmin Ltd. and Trimble Inc.:
Garmin Scores
- Altman Z-Score: 14.6, indicating a strong safe zone.
- Piotroski Score: 5, reflecting average financial health.
Trimble Scores
- Altman Z-Score: 4.6, also in the safe zone but lower.
- Piotroski Score: 6, slightly stronger average rating.
Which company has the best scores?
Garmin Ltd. has a significantly higher Altman Z-Score, showing stronger financial stability, while Trimble Inc. has a marginally better Piotroski Score. Overall, Garmin’s scores indicate a safer financial position.
Grades Comparison
Here is the detailed comparison of recent grades from recognized financial institutions for Garmin Ltd. and Trimble Inc.:
Garmin Ltd. Grades
This table summarizes the latest grades awarded to Garmin Ltd. by major grading companies.
| Grading Company | Action | New Grade | Date |
|---|---|---|---|
| Tigress Financial | Maintain | Strong Buy | 2025-12-19 |
| Longbow Research | Upgrade | Buy | 2025-12-03 |
| Barclays | Maintain | Underweight | 2025-10-30 |
| Morgan Stanley | Maintain | Underweight | 2025-10-30 |
| Tigress Financial | Maintain | Strong Buy | 2025-09-30 |
| Morgan Stanley | Maintain | Underweight | 2025-09-19 |
| Morgan Stanley | Maintain | Underweight | 2025-07-31 |
| Barclays | Maintain | Underweight | 2025-07-31 |
| JP Morgan | Maintain | Neutral | 2025-07-17 |
| JP Morgan | Maintain | Neutral | 2025-05-01 |
Overall, Garmin Ltd. shows a polarized pattern with several Underweight ratings alongside Strong Buy endorsements, reflecting mixed analyst sentiment.
Trimble Inc. Grades
Presented below are the latest grades from credible financial firms for Trimble Inc.
| Grading Company | Action | New Grade | Date |
|---|---|---|---|
| Barclays | Maintain | Overweight | 2026-01-12 |
| Keybanc | Upgrade | Overweight | 2025-12-16 |
| Piper Sandler | Maintain | Overweight | 2025-11-07 |
| JP Morgan | Maintain | Overweight | 2025-09-19 |
| JP Morgan | Maintain | Overweight | 2025-08-07 |
| Oppenheimer | Maintain | Outperform | 2025-08-07 |
| Raymond James | Maintain | Outperform | 2025-08-07 |
| Oppenheimer | Maintain | Outperform | 2025-07-17 |
| JP Morgan | Maintain | Overweight | 2025-07-10 |
| JP Morgan | Maintain | Overweight | 2025-05-14 |
Trimble Inc. consistently receives positive grades such as Overweight and Outperform, indicating broad analyst confidence.
Which company has the best grades?
Trimble Inc. holds generally stronger and more consistent positive grades compared to Garmin Ltd., which has a mix of Underweight and Strong Buy ratings. This contrast may influence investors’ perception of risk and growth potential.
Strengths and Weaknesses
Below is a comparison of Garmin Ltd. (GRMN) and Trimble Inc. (TRMB) based on key financial and strategic criteria.
| Criterion | Garmin Ltd. (GRMN) | Trimble Inc. (TRMB) |
|---|---|---|
| Diversification | Highly diversified across Automotive Mobile, Aviation, Fitness, Marine, and Outdoor segments with steady revenue growth. | Moderate diversification with Products and Services split; exposure to Buildings, Geospatial, Resources, and Transportation sectors. |
| Profitability | Strong profitability: Net margin 22.4%, ROIC 16.3%, ROE 18%, favorable financial ratios overall. | High net margin 40.8% and ROE 26.2%, but ROIC 4.5% below WACC; profitability declining. |
| Innovation | Consistent investment in fitness and outdoor tech, stable ROIC trend indicates maintained competitive edge. | Innovation challenged; declining ROIC trend suggests deteriorating capital efficiency. |
| Global presence | Solid global footprint in various sectors with robust market penetration, especially in fitness and outdoor markets. | Global reach with strong presence in infrastructure and geospatial markets but less diversification in revenue streams. |
| Market Share | Strong market shares particularly in fitness wearables and outdoor devices. | Market leadership in select niche markets like surveying and construction but facing margin pressure. |
Key Takeaways: Garmin shows a favorable moat with stable profitability and diversified revenue streams, making it a value creator. Trimble, despite strong margins, suffers from declining ROIC and value destruction risks, indicating caution for investors.
Risk Analysis
Below is a comparative table highlighting key risks for Garmin Ltd. (GRMN) and Trimble Inc. (TRMB) based on the latest data from 2024.
| Metric | Garmin Ltd. (GRMN) | Trimble Inc. (TRMB) |
|---|---|---|
| Market Risk | Moderate beta of 1.01 indicates average market volatility risk | Higher beta of 1.59 suggests elevated market volatility risk |
| Debt level | Very low debt-to-equity ratio (0.02), minimal financial leverage risk | Moderate debt level (D/E 0.26), manageable but higher leverage risk |
| Regulatory Risk | Exposure to global tech regulations, especially in avionics and GPS | Regulatory risk in technology and infrastructure sectors, plus agriculture and transportation |
| Operational Risk | Diverse product segments reduce operational risk; supply chain sensitivity exists | Complex multi-segment operations increase operational complexity and risk |
| Environmental Risk | Moderate, related to manufacturing and product lifecycle | Elevated due to agriculture and transportation segments’ environmental impact |
| Geopolitical Risk | Swiss base with global markets, sensitive to international trade tensions | U.S.-based with global exposure, vulnerable to trade and political shifts |
Garmin’s most significant risks stem from moderate market volatility and global regulatory environments, although its low debt reduces financial stress. Trimble faces higher market volatility and operational risks due to its diversified segments and moderate debt load. Both companies are in the safe zone financially per Altman Z-scores, but Trimble’s higher beta and segment complexity suggest more caution for risk-sensitive investors.
Which Stock to Choose?
Garmin Ltd. (GRMN) shows steady income growth with a 50.41% revenue increase over five years and favorable profitability ratios including a 22.41% net margin and 17.98% ROE. The company maintains low debt levels and a very favorable A- rating, supported by a strong Altman Z-Score of 14.6 indicating financial safety.
Trimble Inc. (TRMB) presents mixed income trends with a modest 17.02% revenue growth over five years but an impressive 40.84% net margin and 26.18% ROE. Despite higher debt and a declining ROIC, it holds a very favorable B- rating and a safe-zone Altman Z-Score of 4.6, though its value creation appears challenged.
Given Garmin’s consistent value creation and stronger financial stability, it might appeal more to risk-averse or quality-focused investors, while Trimble’s higher profitability but declining moat could be seen as attractive to risk-tolerant investors seeking growth potential despite some financial risks.
Disclaimer: Investment carries a risk of loss of initial capital. The past performance is not a reliable indicator of future results. Be sure to understand risks before making an investment decision.
Go Further
I encourage you to read the complete analyses of Garmin Ltd. and Trimble Inc. to enhance your investment decisions: