Home > Comparison > Technology > GRMN vs TDY
The strategic rivalry between Garmin Ltd. and Teledyne Technologies shapes the competitive landscape of the Technology sector. Garmin operates as a diversified hardware and wearable device manufacturer with a global footprint. Teledyne focuses on high-precision instrumentation and aerospace electronics, emphasizing industrial and defense markets. This analysis contrasts their operational models to identify which company offers superior risk-adjusted returns amid evolving technological demands and sector dynamics.

Table of contents
Companies Overview
Garmin Ltd. and Teledyne Technologies Incorporated are pivotal players in the global hardware and equipment sector.
Garmin Ltd.: Leader in Consumer and Aviation Navigation Devices
Garmin Ltd. dominates with its diverse portfolio of wireless devices, spanning fitness, outdoor, aviation, marine, and automotive markets. Its core revenue comes from selling specialized hardware combined with software platforms like Garmin Connect. In 2026, Garmin focuses on enhancing connectivity and expanding digital services to strengthen user engagement and recurring revenue streams.
Teledyne Technologies Incorporated: Enabler of Industrial and Defense Technologies
Teledyne Technologies Incorporated excels in providing advanced instrumentation and imaging systems for industrial, aerospace, and defense markets. Its revenue base derives from sophisticated sensors, test equipment, and integrated systems sold globally. The company prioritizes innovation in digital imaging and aerospace electronics to capture growth in high-tech industrial applications and defense sectors.
Strategic Collision: Similarities & Divergences
Both companies emphasize high-tech hardware but diverge fundamentally in market approach. Garmin targets a broad consumer and aviation user base with a connected ecosystem, while Teledyne pursues specialized industrial and defense markets with complex instrumentation. Their primary battleground lies in technological innovation and product integration. Garmin offers a consumer-centric growth profile; Teledyne presents a defense-driven, industrial growth investment case.
Income Statement Comparison
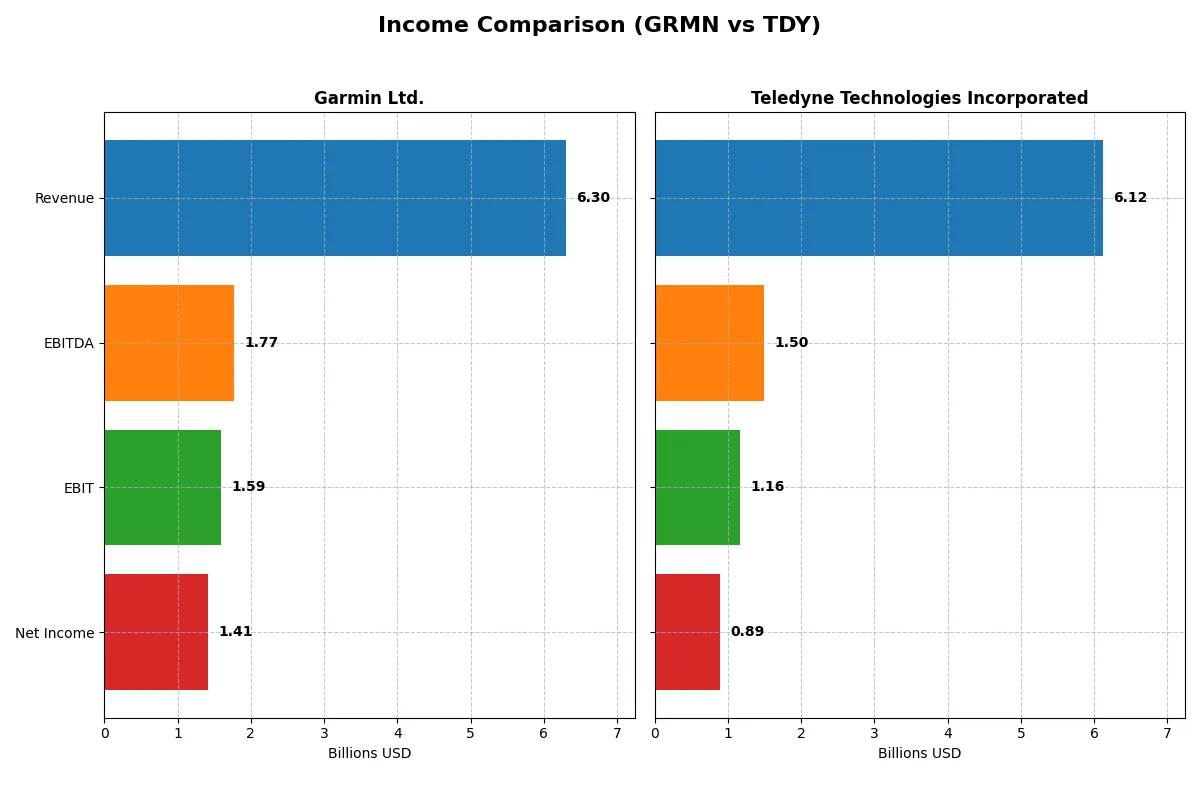
The following data dissects the core profitability and scalability of both corporate engines to reveal who dominates the bottom line:
| Metric | Garmin Ltd. (GRMN) | Teledyne Technologies (TDY) |
|---|---|---|
| Revenue | 6.3B | 6.1B |
| Cost of Revenue | 2.6B | 3.7B |
| Operating Expenses | 2.1B | 1.2B |
| Gross Profit | 3.7B | 2.4B |
| EBITDA | 1.8B | 1.5B |
| EBIT | 1.6B | 1.2B |
| Interest Expense | 0 | 60M |
| Net Income | 1.4B | 895M |
| EPS | 7.35 | 18.88 |
| Fiscal Year | 2024 | 2025 |
Income Statement Analysis: The Bottom-Line Duel
This income statement comparison reveals which company efficiently converts sales into profit, showcasing each firm’s operational strength and financial momentum.
Garmin Ltd. Analysis
Garmin’s revenue surged 20% to 6.3B in 2024, with net income rising 9% to 1.41B. The company sustains robust gross margins near 59%, reflecting strong cost control. Its EBIT margin expanded to 25.3%, signaling improved operational efficiency and solid momentum entering 2025.
Teledyne Technologies Incorporated Analysis
Teledyne posted 6.1B revenue in 2025, growing 7.9% year-over-year, while net income climbed nearly 10% to 895M. Gross margin held at 39.2%, lower than Garmin’s but stable. EBIT margin improved to 19%, showing steady operational gains despite moderate top-line growth.
Verdict: Margin Power vs. Revenue Scale
Garmin leads with superior margins and faster revenue growth, delivering higher profitability and operational leverage. Teledyne shows impressive net income growth and EPS momentum but at lower margin levels. For investors prioritizing efficiency and margin strength, Garmin’s profile offers clearer fundamental advantage.
Financial Ratios Comparison
These vital ratios act as a diagnostic tool to expose the underlying fiscal health, valuation premiums, and capital efficiency of the companies compared below:
| Ratios | Garmin Ltd. (GRMN) | Teledyne Technologies (TDY) |
|---|---|---|
| ROE | 18.0% | 8.5% |
| ROIC | 16.3% | 6.8% |
| P/E | 28.5 | 27.3 |
| P/B | 5.13 | 2.33 |
| Current Ratio | 3.54 | 1.64 |
| Quick Ratio | 2.56 | 1.08 |
| D/E | 0.02 | 0.24 |
| Debt-to-Assets | 1.69% | 16.2% |
| Interest Coverage | 0 (not reported) | 19.3 |
| Asset Turnover | 0.65 | 0.40 |
| Fixed Asset Turnover | 4.49 | 7.29 |
| Payout Ratio | 40.6% | 0% |
| Dividend Yield | 1.42% | 0% |
| Fiscal Year | 2024 | 2025 |
Efficiency & Valuation Duel: The Vital Signs
Financial ratios act as a company’s DNA, exposing hidden risks and operational strengths invisible in raw numbers alone.
Garmin Ltd.
Garmin delivers strong profitability with a 17.98% ROE and a healthy 22.41% net margin. Its valuation is stretched, trading at a high 28.5 P/E and 5.13 P/B, signaling premium pricing. Shareholders receive a modest 1.42% dividend yield, while Garmin reinvests heavily in R&D, fueling future growth and operational efficiency.
Teledyne Technologies Incorporated
Teledyne shows moderate profitability with an 8.51% ROE and a 14.63% net margin. The stock is fairly valued at a 27.35 P/E and a neutral 2.33 P/B ratio. The company does not pay dividends, opting instead for growth investments. Its balance sheet strength supports operational stability, albeit with lower asset turnover compared to Garmin.
Premium Valuation vs. Operational Safety
Garmin balances superior profitability and growth reinvestment against a premium valuation. Teledyne offers a more conservative valuation with stable operations but weaker returns. Investors seeking growth and operational excellence may prefer Garmin, while those favoring steadiness and moderate risk might lean toward Teledyne.
Which one offers the Superior Shareholder Reward?
Garmin (GRMN) delivers steady dividends with a 1.4% yield and a sustainable 40% payout ratio, supported by strong free cash flow (6.4/share). It also repurchases shares consistently, enhancing total returns. Teledyne (TDY) pays no dividends but reinvests aggressively, with a robust free cash flow of 22.7/share fueling growth. Its buyback activity is modest but present. I see Garmin’s balanced dividend and buyback approach as more reliable for income-focused investors. However, TDY’s reinvestment strategy offers higher growth potential, appealing to growth investors. In 2026, Garmin offers a superior total return profile for risk-conscious shareholders seeking income, while TDY suits those prioritizing capital appreciation.
Comparative Score Analysis: The Strategic Profile
The radar chart reveals the fundamental DNA and trade-offs of Garmin Ltd. and Teledyne Technologies Incorporated, highlighting their core financial strengths and vulnerabilities:
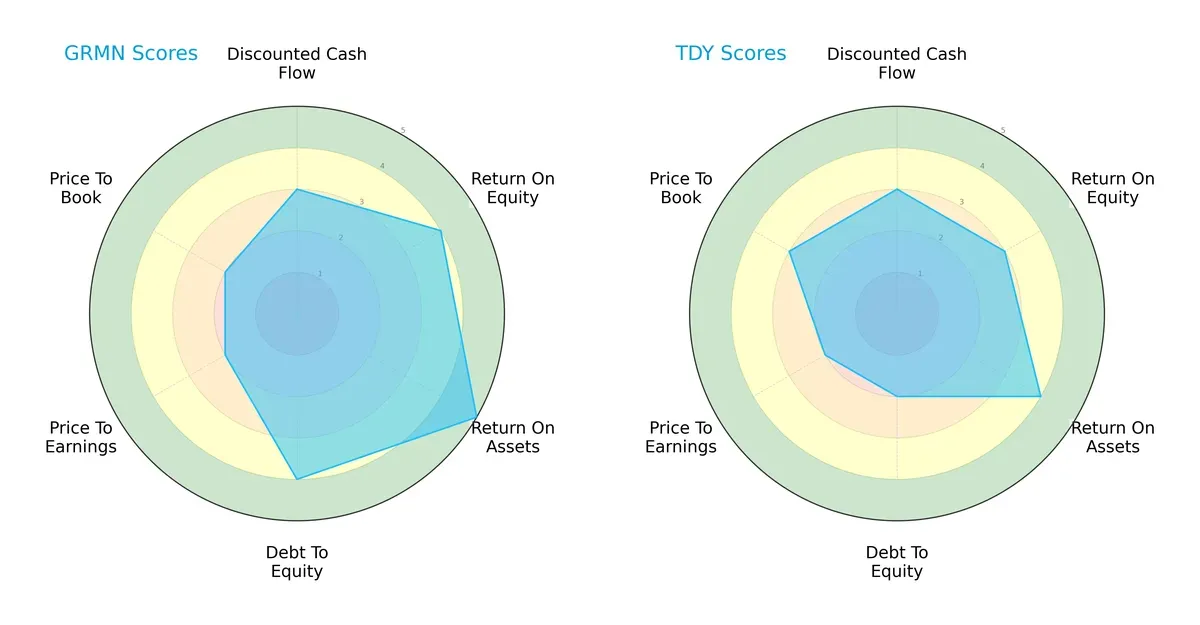
Garmin delivers a more balanced profile, excelling in ROE (4 vs. 3) and ROA (5 vs. 4), signaling superior profitability and asset efficiency. It also maintains stronger leverage control (Debt/Equity 4 vs. 2). Teledyne shows competitive discounted cash flow (3 each) but lags in capital efficiency and financial stability. Both face moderate valuation scores, but Garmin’s edge in operational returns suggests a durable competitive advantage.
Bankruptcy Risk: Solvency Showdown
Garmin’s Altman Z-Score of 14.1 far outpaces Teledyne’s 4.4, signaling a much stronger solvency buffer for Garmin in this economic cycle:
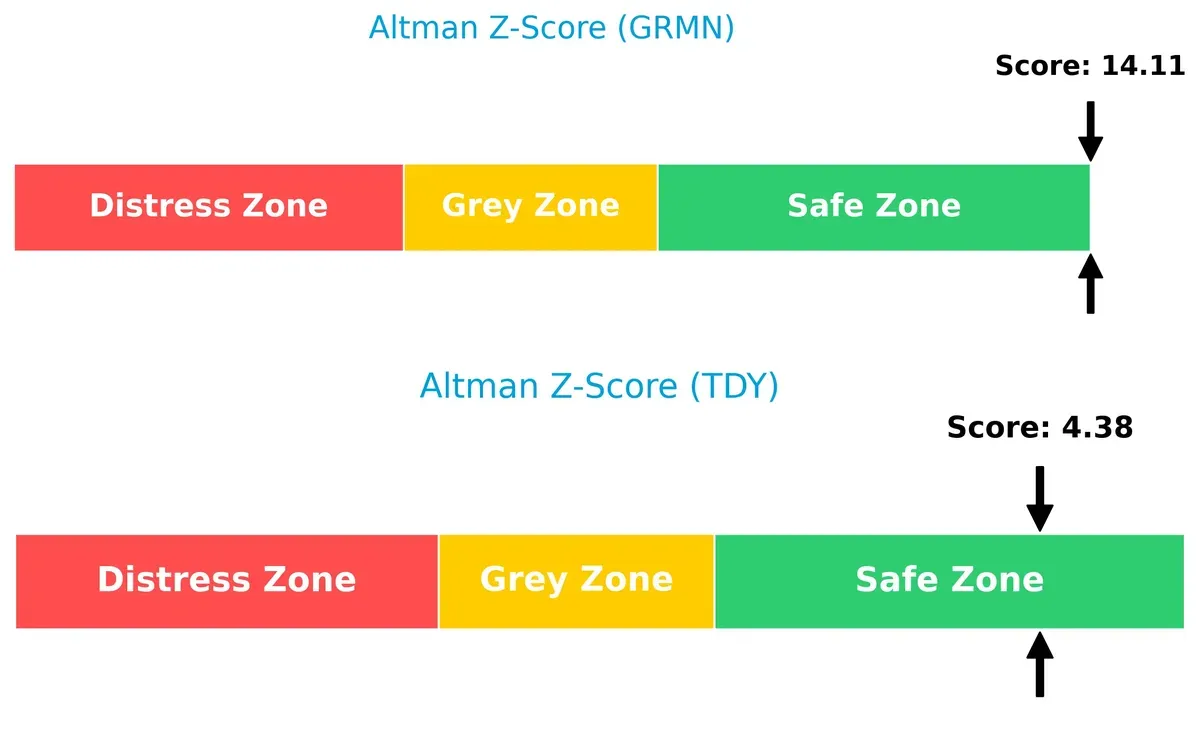
Garmin sits comfortably in the “safe zone,” indicating minimal bankruptcy risk. Teledyne, while also in the safe zone, shows a narrower margin, implying higher sensitivity to financial distress under adverse market conditions.
Financial Health: Quality of Operations
Garmin (Piotroski 5) and Teledyne (Piotroski 6) both reflect average financial health, with Teledyne slightly ahead but neither demonstrating peak operational strength:
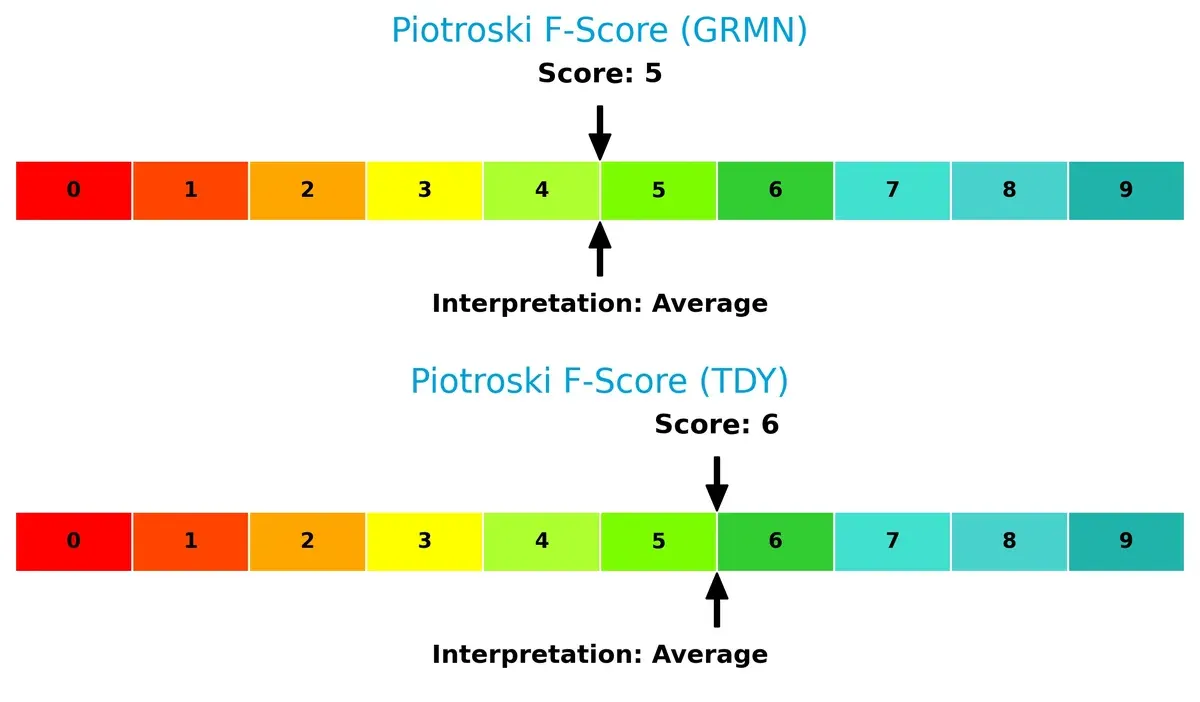
Both firms show room for improvement in internal metrics. Garmin’s slightly lower score suggests caution on operational fundamentals, while Teledyne’s marginally better score reflects steadier profitability and efficiency metrics. Neither company exhibits red flags, but investors should monitor internal financial quality trends closely.
How are the two companies positioned?
This section dissects Garmin and Teledyne’s operational DNA by comparing their revenue distribution and internal dynamics, including strengths and weaknesses. The goal is to confront their economic moats and reveal which model offers the most resilient competitive advantage today.
Revenue Segmentation: The Strategic Mix
This visual comparison dissects how Garmin Ltd. and Teledyne Technologies diversify their income streams and where their primary sector bets lie:
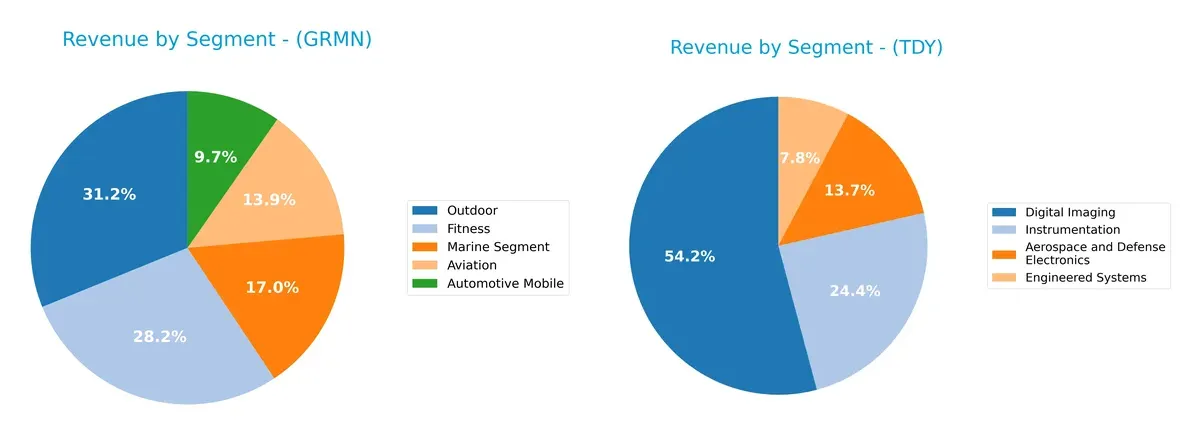
Garmin leans on a balanced portfolio with Fitness at $1.77B and Outdoor leading at $1.96B, showing broad consumer-market reach. Teledyne pivots heavily on Digital Imaging at $3.07B, dwarfing its other segments, revealing a tech infrastructure dominance. Garmin’s diverse mix reduces concentration risk, while Teledyne’s reliance on one segment may boost margins but exposes it to sector-specific volatility.
Strengths and Weaknesses Comparison
This table compares the Strengths and Weaknesses of Garmin Ltd. and Teledyne Technologies Incorporated:
Garmin Ltd. Strengths
- Diverse segments with strong Fitness and Outdoor revenues
- High net margin at 22.41%
- ROE and ROIC above 16% indicate efficient capital use
- Low debt levels with excellent interest coverage
- Strong global sales across Americas, EMEA, and Asia Pacific
Teledyne Technologies Strengths
- Significant Digital Imaging segment driving revenue
- Favorable net margin at 14.63%
- Solid liquidity with current ratio at 1.64
- Favorable debt ratios with manageable leverage
- Global presence including US, Europe, Asia, and other regions
Garmin Ltd. Weaknesses
- High P/E and P/B ratios may indicate overvaluation
- Elevated current ratio at 3.54 could suggest inefficient asset use
- Asset turnover neutral at 0.65, signaling moderate operational efficiency
Teledyne Technologies Weaknesses
- ROE low at 8.51%, indicating weaker shareholder returns
- Asset turnover low at 0.4, showing less operational efficiency
- No dividend yield limits income appeal
- Moderate unfavorable ratios at 28.57%
Garmin’s strengths lie in profitability and low leverage, supported by diverse and growing segments globally. Teledyne excels in a key imaging segment and maintains solid liquidity but faces challenges in returns and asset efficiency. Both companies show distinct financial profiles influencing their strategic positioning.
The Moat Duel: Analyzing Competitive Defensibility
A structural moat is the only reliable shield protecting long-term profits from relentless competition erosion:
Garmin Ltd.: Intangible Assets Driving Margin Stability
Garmin’s moat stems from strong brand reputation and proprietary software in fitness and aviation segments. Its 25% EBIT margin confirms stable profitability. New product expansion in wearables could deepen this moat in 2026.
Teledyne Technologies Incorporated: Innovation-Driven Engineering Excellence
Teledyne’s moat relies on complex aerospace and defense technology integration, distinct from Garmin’s consumer focus. Despite a lower 19% EBIT margin, its growing ROIC signals improving capital efficiency. Expansion into advanced imaging systems may disrupt markets further.
Margin Quality vs. Innovation Scale: Who Holds the Stronger Moat?
Garmin’s consistent ROIC above WACC by 7.7% signals a wider moat with stable value creation. Teledyne, while improving, still sheds value overall. Garmin is better equipped to defend its market share long term.
Which stock offers better returns?
The past year shows strong price appreciation for both Garmin Ltd. and Teledyne Technologies, with distinct acceleration phases and shifting buyer-seller dynamics shaping their trading activity.
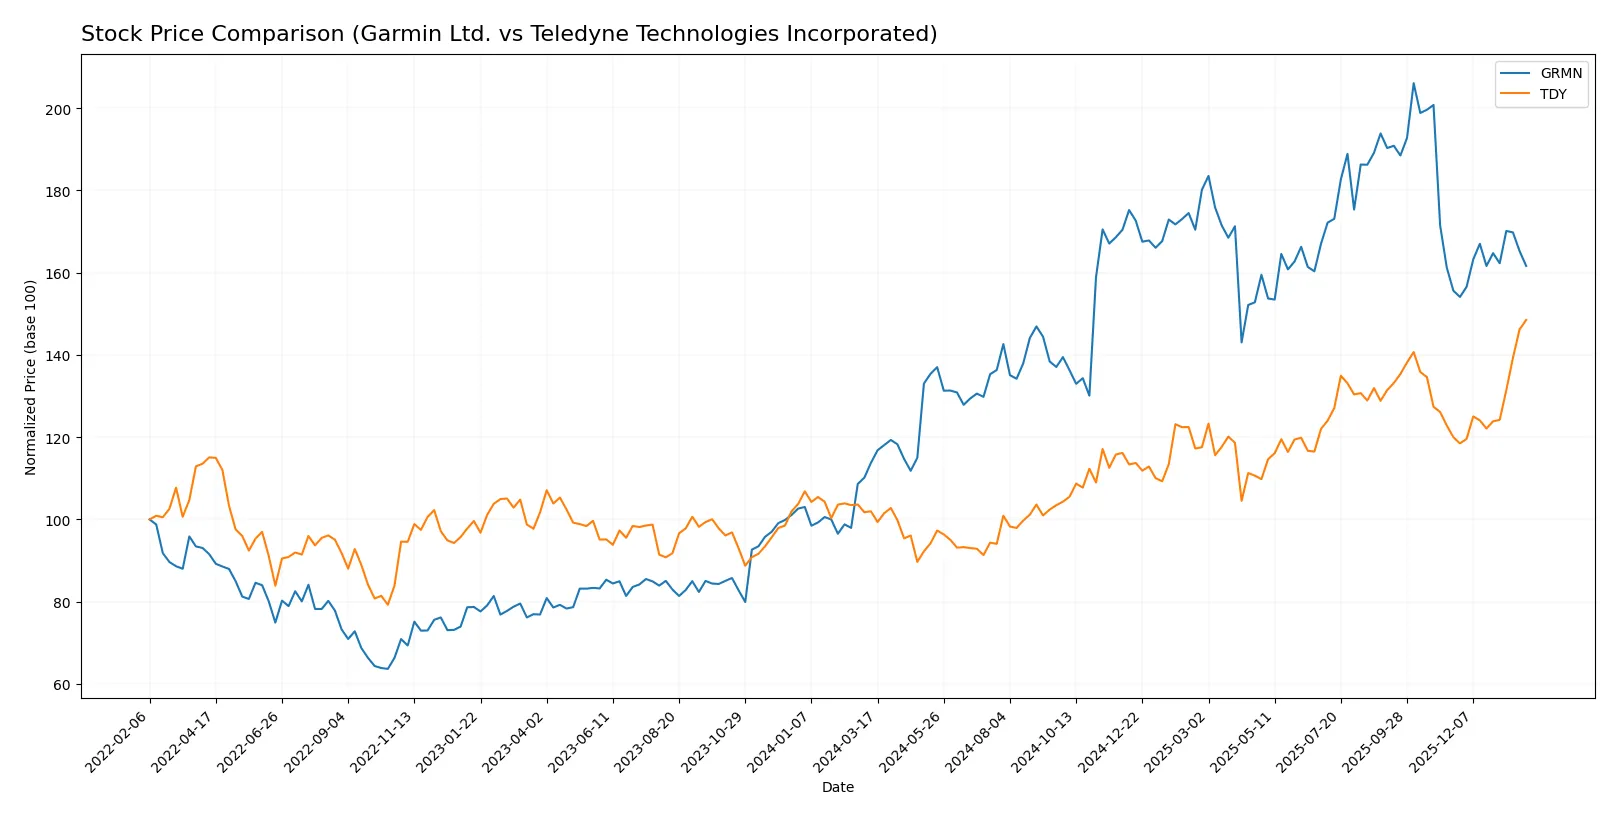
Trend Comparison
Garmin Ltd.’s stock gained 42.06% over the past year, marking a bullish trend with accelerating momentum. Its price ranged from a low of 139.52 to a high of 257.06, showing moderate volatility (28.33 std deviation).
Teledyne Technologies’ stock rose 45.62% over the same period, also bullish with acceleration. It experienced higher volatility (58.2 std deviation), reaching a high of 620.3 and a low of 374.64, indicating stronger price swings.
Teledyne Technologies outperformed Garmin Ltd. in total percentage gain and recent trend steepness, delivering the highest market performance between the two.
Target Prices
Analysts present a balanced target consensus indicating moderate upside potential for both Garmin Ltd. and Teledyne Technologies Incorporated.
| Company | Target Low | Target High | Consensus |
|---|---|---|---|
| Garmin Ltd. | 193 | 310 | 240 |
| Teledyne Technologies Incorporated | 599 | 720 | 638.5 |
Garmin’s consensus target of 240 suggests a 19% upside from its current 2026 price of 201.64. Teledyne’s consensus of 638.5 indicates a slight 3% upside versus its current price near 620.30.

Don’t Let Luck Decide Your Entry Point
Optimize your entry points with our advanced ProRealTime indicators. You’ll get efficient buy signals with precise price targets for maximum performance. Start outperforming now!
How do institutions grade them?
Garmin Ltd. Grades
Here are the recent grades and rating actions from key institutions for Garmin Ltd.:
| Grading Company | Action | New Grade | Date |
|---|---|---|---|
| Barclays | Upgrade | Equal Weight | 2026-01-16 |
| Tigress Financial | Maintain | Strong Buy | 2025-12-19 |
| Longbow Research | Upgrade | Buy | 2025-12-03 |
| Morgan Stanley | Maintain | Underweight | 2025-10-30 |
| Barclays | Maintain | Underweight | 2025-10-30 |
| Tigress Financial | Maintain | Strong Buy | 2025-09-30 |
| Morgan Stanley | Maintain | Underweight | 2025-09-19 |
| Morgan Stanley | Maintain | Underweight | 2025-07-31 |
| Barclays | Maintain | Underweight | 2025-07-31 |
| JP Morgan | Maintain | Neutral | 2025-07-17 |
Teledyne Technologies Incorporated Grades
The following table summarizes the latest grades and ratings for Teledyne Technologies Incorporated:
| Grading Company | Action | New Grade | Date |
|---|---|---|---|
| Barclays | Maintain | Equal Weight | 2026-01-22 |
| Needham | Maintain | Buy | 2026-01-22 |
| Stifel | Maintain | Buy | 2026-01-22 |
| Citigroup | Maintain | Neutral | 2026-01-13 |
| Barclays | Maintain | Equal Weight | 2026-01-12 |
| Needham | Maintain | Buy | 2025-10-23 |
| Barclays | Maintain | Equal Weight | 2025-10-23 |
| Stifel | Maintain | Buy | 2025-10-23 |
| Morgan Stanley | Maintain | Equal Weight | 2025-10-15 |
| UBS | Maintain | Buy | 2025-07-24 |
Which company has the best grades?
Teledyne Technologies shows a consistent pattern of Buy and Equal Weight ratings without downgrades. Garmin Ltd. displays a mixed range, including multiple Underweight ratings despite some Strong Buy and Buy upgrades. Investors may view Teledyne’s steadier grades as a sign of broader institutional confidence compared to Garmin’s more polarized outlook.
Risks specific to each company
The following categories identify the critical pressure points and systemic threats facing both Garmin Ltd. and Teledyne Technologies Incorporated in the 2026 market environment:
1. Market & Competition
Garmin Ltd.
- Faces intense competition in fitness and navigation devices, pressured by rapid tech innovation and consumer preferences.
Teledyne Technologies Incorporated
- Competes in diversified industrial and aerospace markets, challenged by defense budget fluctuations and tech advancements.
2. Capital Structure & Debt
Garmin Ltd.
- Exceptionally low debt (D/E 0.02) reduces financial risk, supporting strong interest coverage and liquidity.
Teledyne Technologies Incorporated
- Moderate leverage (D/E 0.24) with solid interest coverage; debt level manageable but requires monitoring.
3. Stock Volatility
Garmin Ltd.
- Beta near 1.0 suggests volatility in line with the overall market, implying predictable risk patterns.
Teledyne Technologies Incorporated
- Slightly higher beta at 1.03 indicates marginally greater sensitivity to market swings.
4. Regulatory & Legal
Garmin Ltd.
- Exposure to global trade regulations and aviation compliance risks due to diverse product lines.
Teledyne Technologies Incorporated
- Faces stringent aerospace and defense regulations, plus export controls impacting international sales.
5. Supply Chain & Operations
Garmin Ltd.
- Relies on global suppliers; potential disruptions could affect manufacturing and timely product delivery.
Teledyne Technologies Incorporated
- Complex supply chain with critical components for defense and aerospace; vulnerability to raw material shortages.
6. ESG & Climate Transition
Garmin Ltd.
- Increasing pressure to improve sustainability practices in manufacturing and product lifecycle.
Teledyne Technologies Incorporated
- High ESG scrutiny due to defense sector involvement; must balance compliance with operational demands.
7. Geopolitical Exposure
Garmin Ltd.
- Global footprint exposes it to currency fluctuations and geopolitical tensions affecting consumer markets.
Teledyne Technologies Incorporated
- Significant US defense contracts heighten exposure to geopolitical shifts and government budget priorities.
Which company shows a better risk-adjusted profile?
Garmin’s minimal debt and stable market beta create a lower financial risk profile compared to Teledyne. However, Garmin faces intense product innovation pressure, while Teledyne’s defense focus introduces regulatory and geopolitical risks. Garmin’s clear capital strength and consistent profitability offer a better risk-adjusted position in 2026.
Final Verdict: Which stock to choose?
Garmin Ltd. commands attention with its unmatched operational efficiency and strong capital discipline. Its superpower lies in consistently creating value, evidenced by robust returns well above its cost of capital. A point of vigilance remains its relatively high valuation multiples, which could temper near-term upside. Garmin suits portfolios aiming for steady, quality growth with a cushion against volatility.
Teledyne Technologies Incorporated leverages a strategic moat rooted in diversified industrial technology and a solid recurring revenue base. While its profitability metrics trail Garmin’s, Teledyne offers a more conservative balance sheet and lower valuation, providing a safety buffer. It fits well within a GARP (Growth at a Reasonable Price) portfolio seeking stable growth with moderate risk.
If you prioritize enduring value creation and efficiency, Garmin outshines as the compelling choice due to its superior returns on invested capital and operational strength. However, if you seek better stability with a value tilt and diversification, Teledyne offers a more balanced profile despite its current challenges in value generation. Each company addresses distinct investor risk appetites and growth expectations.
Disclaimer: Investment carries a risk of loss of initial capital. The past performance is not a reliable indicator of future results. Be sure to understand risks before making an investment decision.
Go Further
I encourage you to read the complete analyses of Garmin Ltd. and Teledyne Technologies Incorporated to enhance your investment decisions: