Home > Comparison > Technology > TEL vs GRMN
The strategic rivalry between TE Connectivity Ltd. and Garmin Ltd. shapes the evolution of the technology hardware sector. TE Connectivity operates as a capital-intensive manufacturer focused on connectivity and sensor solutions across industrial and transportation markets. Garmin Ltd. specializes in high-margin wireless devices and integrated systems for fitness, outdoor, aviation, and marine applications. This analysis evaluates which business model delivers the superior risk-adjusted return for a diversified portfolio navigating sector growth and innovation.
Table of contents
Companies Overview
TE Connectivity and Garmin stand as key players in the global hardware and equipment sector, shaping technology solutions across diverse markets.
TE Connectivity Ltd.: Global Connectivity Pioneer
TE Connectivity dominates as a manufacturer of connectivity and sensor solutions, driving revenue through its three core segments: Transportation, Industrial, and Communications Solutions. In 2026, the company sharpens its strategic focus on expanding its footprint in automotive and industrial markets, leveraging its broad product range sold in roughly 140 countries. Its extensive portfolio and global reach underpin a robust competitive advantage.
Garmin Ltd.: Wireless Devices Innovator
Garmin excels in designing and marketing a diverse range of wireless devices spanning fitness, outdoor, aviation, marine, and automotive sectors. Revenue flows from high-margin segments including fitness tracking and avionics. In 2026, Garmin emphasizes integrated software platforms like Garmin Connect to deepen customer engagement and broaden its ecosystem, reinforcing its leadership in specialized consumer electronics.
Strategic Collision: Similarities & Divergences
Both companies excel in hardware but diverge significantly in business philosophy. TE Connectivity operates a broad industrial solutions model, focusing on B2B connectivity components. Garmin relies on an integrated consumer device and software ecosystem, enhancing user experience. Their primary battleground is the expanding IoT and smart device market, where TE’s industrial scale meets Garmin’s consumer tech innovation. These distinct models create contrasting investment profiles—industrial breadth versus specialized innovation.
Income Statement Comparison
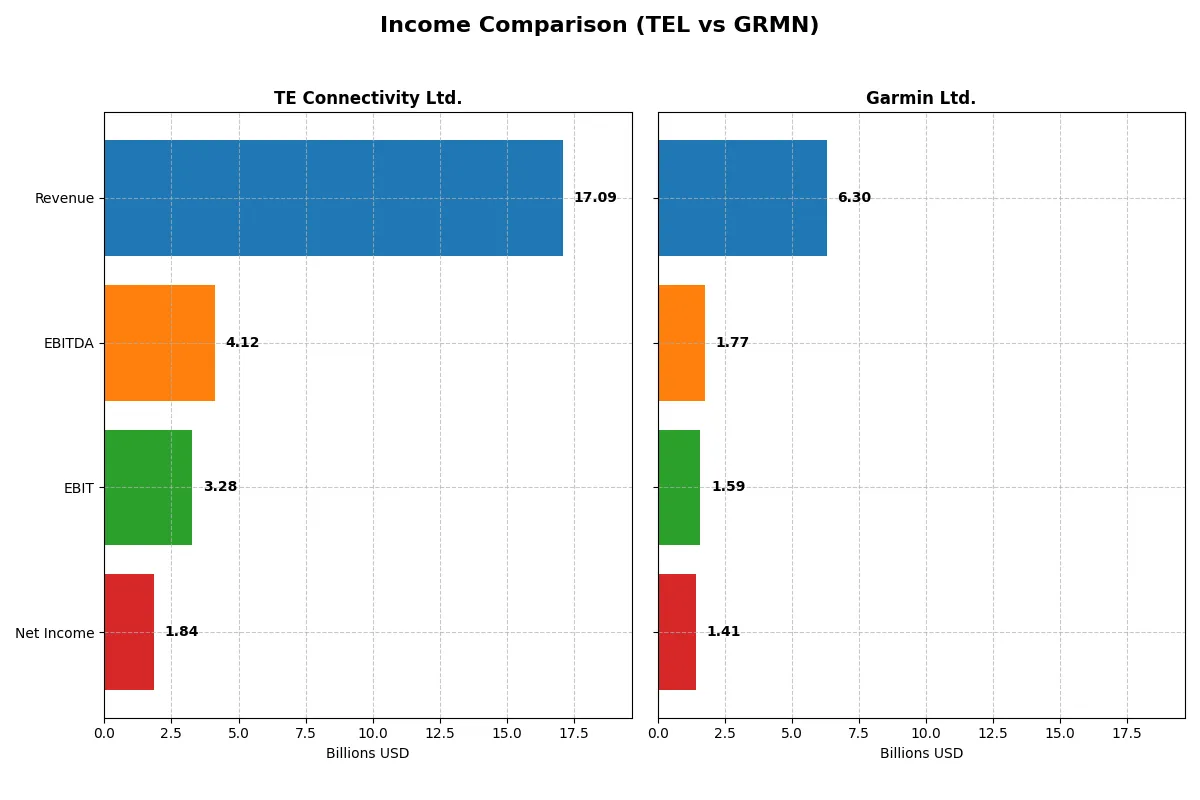
The following data dissects the core profitability and scalability of both corporate engines to reveal who dominates the bottom line:
| Metric | TE Connectivity Ltd. (TEL) | Garmin Ltd. (GRMN) |
|---|---|---|
| Revenue | 17B | 6.3B |
| Cost of Revenue | 11.2B | 2.6B |
| Operating Expenses | 2.7B | 2.1B |
| Gross Profit | 5.9B | 3.7B |
| EBITDA | 4.1B | 1.8B |
| EBIT | 3.3B | 1.6B |
| Interest Expense | 77M | 0 |
| Net Income | 1.8B | 1.4B |
| EPS | 6.2 | 7.35 |
| Fiscal Year | 2025 | 2024 |
Income Statement Analysis: The Bottom-Line Duel
This income statement comparison reveals which company runs a more efficient and profitable corporate engine through recent revenue and net income trends.
TE Connectivity Ltd. Analysis
TE Connectivity’s revenue grew steadily from $14.9B in 2021 to $17.1B in 2025, showing resilience in sales. However, net income declined overall, falling from $2.26B in 2021 to $1.84B in 2025, with net margin slipping to 10.78%. Its gross margin remains solid at 34.56%, but a nearly 47% net margin drop in the latest year signals margin pressure and efficiency challenges.
Garmin Ltd. Analysis
Garmin’s revenue jumped robustly from $4.19B in 2020 to $6.3B in 2024, reflecting impressive top-line momentum. Net income grew strongly to $1.41B, supporting a high 22.41% net margin. Garmin’s gross margin holds at 58.7%, and EBIT margin at 25.31% indicates efficient cost control. Despite a slight recent net margin dip, its consistent EPS growth signals sustained profitability gains.
Margin Power vs. Revenue Scale
Garmin outperforms TE Connectivity with superior margin expansion and stronger net income growth. Garmin’s higher gross and net margins demonstrate a more efficient cost structure. TE Connectivity shows healthy revenue but struggles with margin preservation. Investors favor Garmin’s profile for durable profitability and compelling earnings momentum.
Financial Ratios Comparison
These vital ratios act as a diagnostic tool to expose the underlying fiscal health, valuation premiums, and capital efficiency of each company:
| Ratios | TE Connectivity Ltd. (TEL) | Garmin Ltd. (GRMN) |
|---|---|---|
| ROE | 14.6% | 18.0% |
| ROIC | 8.8% | 16.3% |
| P/E | 35.0x | 28.5x |
| P/B | 5.12x | 5.13x |
| Current Ratio | 1.56 | 3.54 |
| Quick Ratio | 1.03 | 2.56 |
| D/E | 0.52 | 0.02 |
| Debt-to-Assets | 26.1% | 1.7% |
| Interest Coverage | 41.7x | N/A |
| Asset Turnover | 0.68 | 0.65 |
| Fixed Asset Turnover | 3.96 | 4.49 |
| Payout Ratio | 43.6% | 40.6% |
| Dividend Yield | 1.25% | 1.42% |
| Fiscal Year | 2025 | 2024 |
Efficiency & Valuation Duel: The Vital Signs
Financial ratios serve as a company’s DNA, uncovering hidden risks and highlighting operational strengths critical for investors’ decisions.
TE Connectivity Ltd.
TE Connectivity posts a moderate ROE of 14.64% with a favorable net margin of 10.78%, indicating decent profitability. Its P/E ratio of 35 suggests the stock is stretched relative to earnings. The company maintains a 1.25% dividend yield, balancing shareholder returns with reinvestment in R&D, reflecting a cautious growth approach.
Garmin Ltd.
Garmin demonstrates stronger profitability, with a 17.98% ROE and a robust 22.41% net margin. The P/E ratio of 28.5 still signals a premium valuation but less stretched than TE Connectivity. Garmin offers a 1.42% dividend yield, supported by a favorable balance sheet and reinvestment in R&D, emphasizing operational efficiency and shareholder value.
Premium Valuation vs. Operational Safety
Garmin holds a more favorable profitability and capital efficiency profile despite a relatively high valuation. TE Connectivity’s higher P/E ratio and moderate returns suggest elevated risk. Investors prioritizing operational safety and superior profitability may lean toward Garmin’s profile, while those tolerant of valuation stretch might consider TE Connectivity’s growth strategy.
Which one offers the Superior Shareholder Reward?
I compare TE Connectivity Ltd. (TEL) and Garmin Ltd. (GRMN) on dividends, payout ratios, and buybacks. TEL yields 1.25% with a 44% payout ratio, showing moderate dividend coverage and steady buybacks. GRMN offers a 1.42% yield but a higher 41% payout ratio, balancing dividends and aggressive share repurchases. TEL’s free cash flow per share stands at $10.78 vs. GRMN’s $6.45, supporting TEL’s sustainable distributions. Garmin’s low debt and high cash ratios enable flexible capital allocation, but higher valuation multiples pressure returns. I find TEL’s disciplined payout and stronger FCF coverage offer a more reliable total return in 2026.
Comparative Score Analysis: The Strategic Profile
The radar chart reveals the fundamental DNA and trade-offs between TE Connectivity Ltd. and Garmin Ltd., highlighting their core financial strengths and vulnerabilities:
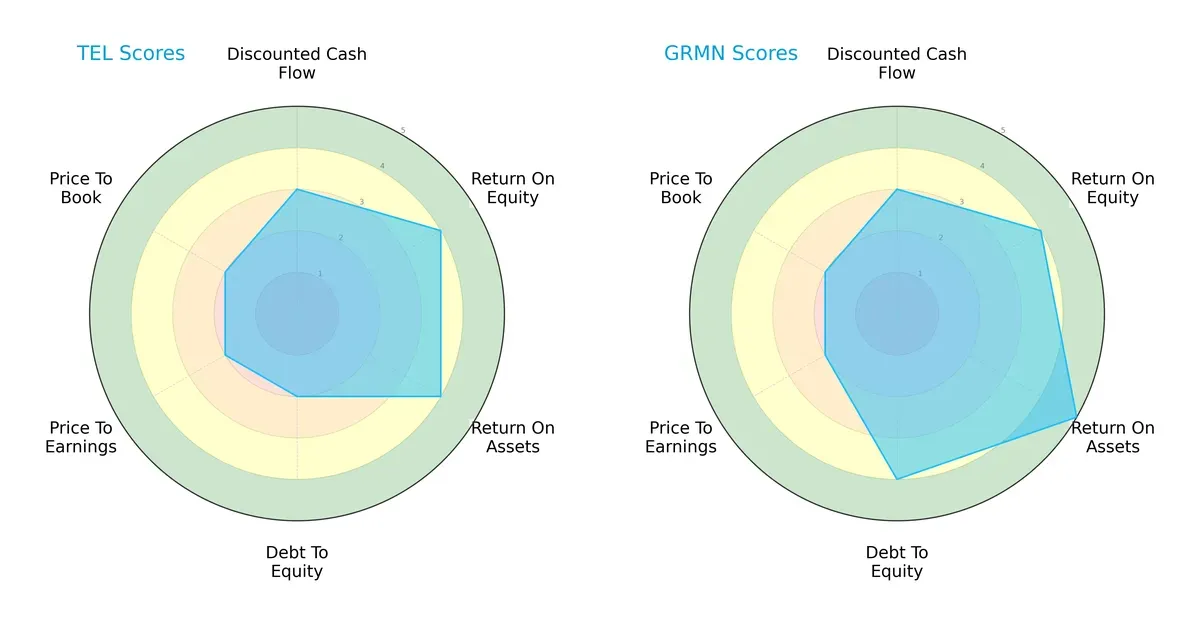
Garmin leads with a more balanced and robust profile, scoring higher on ROA (5 vs. 4) and debt-to-equity (4 vs. 2), signaling superior asset utilization and lower financial risk. TE Connectivity holds steady in ROE but lags in valuation metrics (P/E and P/B at 2 each), indicating potential undervaluation but also moderate risk. Garmin relies on operational efficiency and strong balance sheet discipline, whereas TE Connectivity leans on steady equity returns with a weaker capital structure.
Bankruptcy Risk: Solvency Showdown
Garmin’s Altman Z-Score of 14.1 far surpasses TE Connectivity’s 5.3, placing both comfortably in the safe zone but with Garmin exhibiting far stronger long-term solvency:
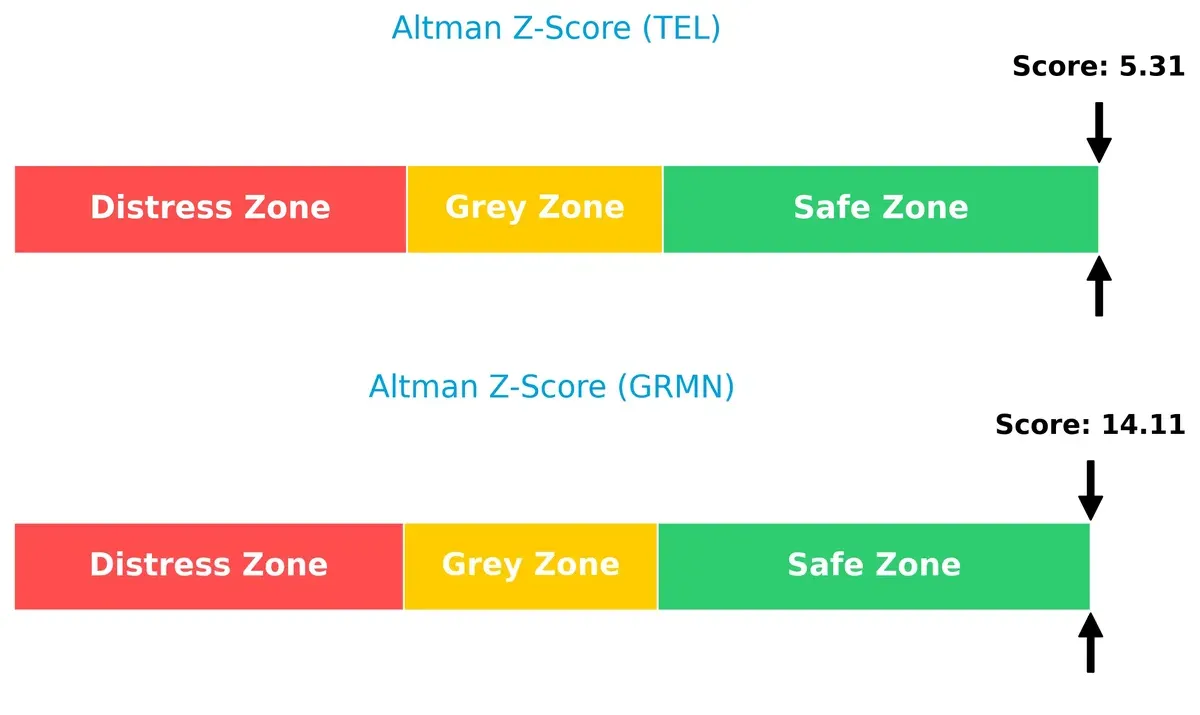
This wide delta suggests Garmin is exceptionally well-positioned to weather economic downturns, while TE Connectivity, though safe, carries greater financial leverage risk in cyclical stress.
Financial Health: Quality of Operations
TE Connectivity’s Piotroski F-Score of 7 signals strong financial health, surpassing Garmin’s average score of 5, indicating more consistent operational quality and internal stability:

I note Garmin’s lower score flags certain internal inefficiencies or weaker profitability metrics. TE Connectivity’s higher score confirms it manages profitability, leverage, and liquidity more effectively, despite its higher debt-to-equity risk. This contrast highlights the nuanced trade-off between balance sheet strength and operational excellence.
How are the two companies positioned?
This section dissects TEL and GRMN’s operational DNA by comparing their revenue distribution and internal dynamics—strengths and weaknesses. The goal is to confront their economic moats to identify which model offers the most resilient, sustainable competitive advantage today.
Revenue Segmentation: The Strategic Mix
This visual comparison dissects how TE Connectivity Ltd. and Garmin Ltd. diversify their income streams and exposes their primary sector bets:
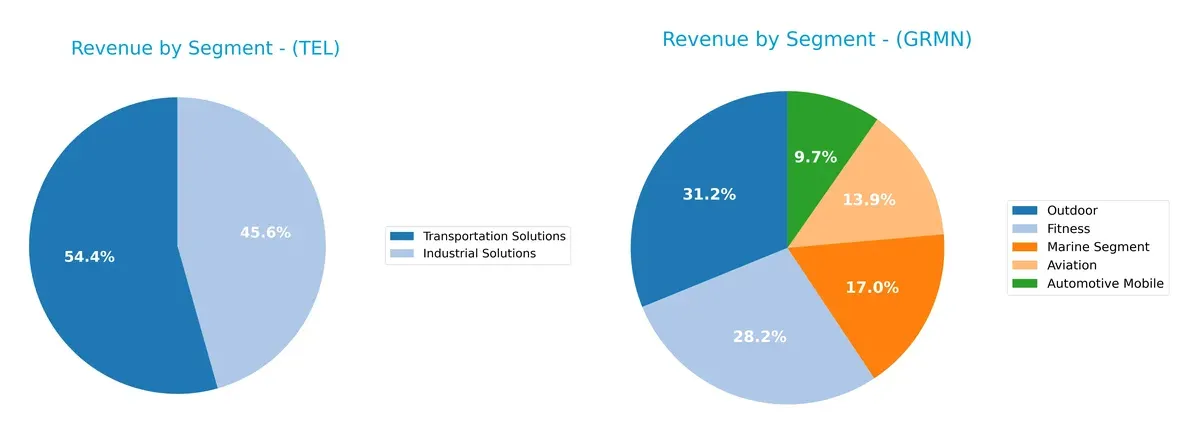
TE Connectivity anchors its revenue heavily in Transportation Solutions at $9.39B and Industrial Solutions at $7.87B, revealing a strong focus on infrastructure and industrial markets. Garmin, however, shows a more balanced mix across Outdoor ($1.96B), Fitness ($1.77B), and Marine ($1.07B) segments, reflecting diversified consumer engagement. TE’s concentration risks contrast Garmin’s broader ecosystem lock-in, catering to varied lifestyle and navigation sectors.
Strengths and Weaknesses Comparison
This table compares the Strengths and Weaknesses of TE Connectivity Ltd. (TEL) and Garmin Ltd. (GRMN):
TEL Strengths
- Diverse industrial and transportation product segments
- Balanced geographic revenue across Americas, Asia-Pacific, and Europe
- Favorable debt-to-assets and interest coverage ratios
- Strong fixed asset turnover
GRMN Strengths
- High profitability margins and returns on equity and invested capital
- Favorable leverage with very low debt levels
- Strong innovation across diverse segments: automotive, aviation, fitness, marine, outdoor
- Favorable fixed asset turnover and quick ratio
TEL Weaknesses
- Unfavorable valuation multiples with high P/E and P/B ratios
- Neutral returns on invested capital relative to WACC
- Moderate asset turnover and leverage ratios
- Less pronounced profitability compared to peer
GRMN Weaknesses
- Unfavorable current ratio signaling liquidity concerns
- Elevated valuation multiples despite strong profitability
- Moderate asset turnover
- Some reliance on Americas region revenue
Overall, TEL shows strength in diversified industrial and transportation solutions and solid financial stability. GRMN excels in profitability, innovation, and conservative leverage but faces liquidity and valuation challenges. These contrasts imply TEL focuses on balanced global operations while GRMN emphasizes high-margin innovation with tighter financial structure risks.
The Moat Duel: Analyzing Competitive Defensibility
A structural moat is the only shield protecting long-term profits from relentless competitive pressures. Let’s examine the distinct moats of these two firms:
TE Connectivity Ltd.: Scale and Industrial Integration Moat
TE Connectivity’s competitive edge stems from its cost advantage and broad industrial integration. Its moderate margins and declining ROIC indicate margin pressure and eroding efficiency. Expansion into automotive sensors and communications in 2026 may stabilize its position but won’t fully reverse the value loss trend.
Garmin Ltd.: Innovation-Driven Brand and Product Moat
Garmin’s moat is rooted in its strong brand, product innovation, and high gross margins, contrasting sharply with TE’s. It sustains superior ROIC well above WACC, reflecting efficient capital use. In 2026, Garmin’s growth in fitness and avionics markets could further deepen its moat and fend off rivals.
Moat Strength: Industrial Scale vs. Innovation Powerhouse
Garmin holds the wider, more durable moat with consistent value creation and expanding profitability. TE Connectivity faces a narrowing moat due to declining returns and margin pressure. Garmin is better equipped to defend and grow its market share in 2026.
Which stock offers better returns?
Over the past year, TE Connectivity Ltd. surged over 58%, showing a strong but decelerating bullish trend. Garmin Ltd. gained 42%, with accelerating momentum in recent months.
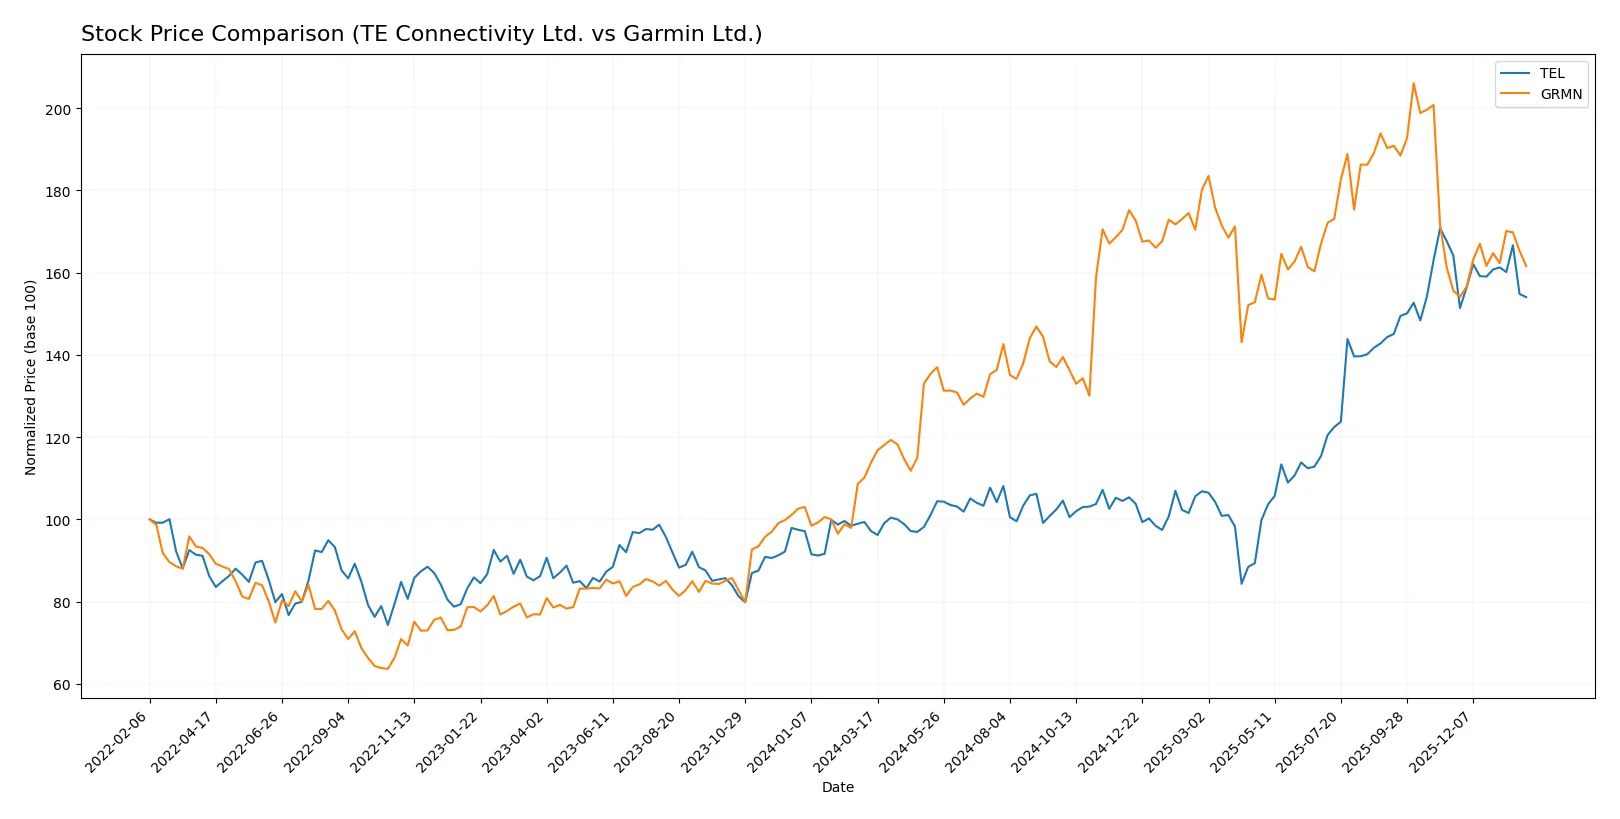
Trend Comparison
TE Connectivity Ltd. exhibited a 58.53% price rise over 12 months, marking a bullish trend with decelerating gains and a wide price range from 122.0 to 247.01.
Garmin Ltd. posted a 42.06% increase, sustaining a bullish trend with acceleration. Its price fluctuated between 139.52 and 257.06, reflecting robust upward momentum.
Comparing both, TE Connectivity delivered higher market returns despite recent deceleration, outperforming Garmin’s accelerating but smaller 42.06% gain.
Target Prices
Analysts present a mixed but optimistic view on TE Connectivity Ltd. and Garmin Ltd., with clear upside potential from current levels.
| Company | Target Low | Target High | Consensus |
|---|---|---|---|
| TE Connectivity Ltd. | 238 | 306 | 270.29 |
| Garmin Ltd. | 193 | 310 | 240 |
TE Connectivity’s target consensus at 270.29 exceeds its current 222.78 price, implying 21% upside. Garmin’s consensus of 240 also suggests roughly 19% growth potential from 201.64. Both stocks show analyst confidence above prevailing market prices.

Don’t Let Luck Decide Your Entry Point
Optimize your entry points with our advanced ProRealTime indicators. You’ll get efficient buy signals with precise price targets for maximum performance. Start outperforming now!
How do institutions grade them?
TE Connectivity Ltd. Grades
The following table summarizes recent grades issued by major financial institutions for TE Connectivity Ltd.:
| Grading Company | Action | New Grade | Date |
|---|---|---|---|
| Oppenheimer | Upgrade | Outperform | 2026-01-27 |
| Barclays | Maintain | Overweight | 2026-01-23 |
| Truist Securities | Maintain | Hold | 2026-01-22 |
| Wells Fargo | Maintain | Equal Weight | 2026-01-22 |
| UBS | Maintain | Buy | 2026-01-14 |
Garmin Ltd. Grades
The following table summarizes recent grades issued by major financial institutions for Garmin Ltd.:
| Grading Company | Action | New Grade | Date |
|---|---|---|---|
| Barclays | Upgrade | Equal Weight | 2026-01-16 |
| Tigress Financial | Maintain | Strong Buy | 2025-12-19 |
| Longbow Research | Upgrade | Buy | 2025-12-03 |
| Morgan Stanley | Maintain | Underweight | 2025-10-30 |
| Barclays | Maintain | Underweight | 2025-10-30 |
Which company has the best grades?
TE Connectivity Ltd. has mostly Hold to Buy ratings with an Outperform upgrade, indicating moderate optimism. Garmin Ltd. shows a mix of Strong Buy and Buy from some firms but also Underweight from others, reflecting more divergent views. These differences may affect investor sentiment and portfolio positioning.
Risks specific to each company
The following categories identify critical pressure points and systemic threats facing TE Connectivity Ltd. and Garmin Ltd. in the 2026 market environment:
1. Market & Competition
TE Connectivity Ltd.
- Faces intense competition in hardware and sensor solutions, requiring constant innovation to maintain market share.
Garmin Ltd.
- Operates in a diverse hardware segment with strong brand loyalty but faces pressure from tech wearables and navigation rivals.
2. Capital Structure & Debt
TE Connectivity Ltd.
- Moderate leverage with debt-to-assets at 26.12%, interest coverage very strong at 42.61x, signaling manageable debt risk.
Garmin Ltd.
- Extremely low debt levels with debt-to-assets at 1.69%, infinite interest coverage, reflecting a very conservative capital structure.
3. Stock Volatility
TE Connectivity Ltd.
- Beta of 1.242 indicates above-market volatility, increasing risk during market downturns.
Garmin Ltd.
- Beta near 1.013 suggests market-matched volatility, offering relatively stable price movements.
4. Regulatory & Legal
TE Connectivity Ltd.
- Global operations expose it to diverse regulatory risks, especially in automotive and industrial sectors.
Garmin Ltd.
- Broad geographic footprint with aviation and marine segments heightens regulatory complexity and compliance costs.
5. Supply Chain & Operations
TE Connectivity Ltd.
- Relies on global supply chains for components; vulnerable to geopolitical disruptions and raw material price swings.
Garmin Ltd.
- Manages diversified manufacturing and distribution, but supply chain shocks in electronics could affect delivery schedules.
6. ESG & Climate Transition
TE Connectivity Ltd.
- Increasing pressure to align products with sustainability trends in energy and transportation sectors.
Garmin Ltd.
- Faces challenges integrating ESG in manufacturing and outdoor product lifecycle amid rising consumer expectations.
7. Geopolitical Exposure
TE Connectivity Ltd.
- Based in Switzerland but with extensive operations worldwide, sensitive to trade tensions and regional instability.
Garmin Ltd.
- Also Swiss-based with global sales; exposure to geopolitical risks in aviation and marine markets is notable.
Which company shows a better risk-adjusted profile?
Garmin’s ultra-low debt and stable stock volatility offer a safer financial footing. TE Connectivity’s higher leverage and beta increase its risk profile. However, TE’s diversified industrial segments provide some resilience. Garmin’s moderate Piotroski score versus TE’s stronger score signals room for operational improvement despite better balance sheet strength. Overall, Garmin demonstrates a better risk-adjusted profile due to lower financial risk and steadier market behavior. TE’s key risk remains elevated market volatility, while Garmin’s greatest concern is managing competitive pressure in fast-evolving tech niches. Notably, Garmin’s debt-to-assets ratio at 1.69% versus TE’s 26.12% justifies my cautious stance on TE’s capital structure risk.
Final Verdict: Which stock to choose?
TE Connectivity Ltd. (TEL) shines with its operational efficiency and stable cash generation, making it a reliable workhorse. Its value creation is hampered by a declining ROIC, signaling a point of vigilance on profitability sustainability. TEL suits investors seeking steady income within a balanced or conservative growth portfolio.
Garmin Ltd. (GRMN) boasts a robust strategic moat rooted in high returns on invested capital and strong balance sheet health. Its recurring revenue and low debt level offer superior financial safety compared to TEL. GRMN fits well in Growth at a Reasonable Price (GARP) portfolios aiming for quality growth with defensive traits.
If you prioritize operational efficiency and consistent cash flow, TEL is a compelling choice despite its waning profitability. However, if you seek durable competitive advantages and better financial stability, GRMN outshines with a proven value-creator profile and accelerating market momentum. Each company serves distinct investor profiles with contrasting risk-reward dynamics.
Disclaimer: Investment carries a risk of loss of initial capital. The past performance is not a reliable indicator of future results. Be sure to understand risks before making an investment decision.
Go Further
I encourage you to read the complete analyses of TE Connectivity Ltd. and Garmin Ltd. to enhance your investment decisions: